
|
|||||
|
 | |
| |
| |
| |
| |
| |
|
Gene: MRPL2 |
Gene summary for MRPL2 |
| Gene information | Species | Human | Gene symbol | MRPL2 | Gene ID | 51069 |
| Gene name | mitochondrial ribosomal protein L2 | |
| Gene Alias | CGI-22 | |
| Cytomap | 6p21.1 | |
| Gene Type | protein-coding | GO ID | GO:0006412 | UniProtAcc | C9IY40 |
Top |
Malignant transformation analysis |
| Identification of the aberrant gene expression in precancerous and cancerous lesions by comparing the gene expression of stem-like cells in diseased tissues with normal stem cells |
| Entrez ID | Symbol | Replicates | Species | Organ | Tissue | Adj P-value | Log2FC | Malignancy |
| 51069 | MRPL2 | LZE2T | Human | Esophagus | ESCC | 1.12e-08 | 1.74e+00 | 0.082 |
| 51069 | MRPL2 | LZE4T | Human | Esophagus | ESCC | 4.52e-10 | 2.76e-01 | 0.0811 |
| 51069 | MRPL2 | LZE5T | Human | Esophagus | ESCC | 1.06e-06 | 2.84e-01 | 0.0514 |
| 51069 | MRPL2 | LZE7T | Human | Esophagus | ESCC | 2.98e-07 | 5.02e-01 | 0.0667 |
| 51069 | MRPL2 | LZE8T | Human | Esophagus | ESCC | 4.70e-09 | 1.96e-01 | 0.067 |
| 51069 | MRPL2 | LZE20T | Human | Esophagus | ESCC | 2.24e-10 | 3.33e-01 | 0.0662 |
| 51069 | MRPL2 | LZE22D1 | Human | Esophagus | HGIN | 1.11e-05 | 2.30e-01 | 0.0595 |
| 51069 | MRPL2 | LZE22T | Human | Esophagus | ESCC | 1.38e-02 | 3.35e-01 | 0.068 |
| 51069 | MRPL2 | LZE24T | Human | Esophagus | ESCC | 4.55e-24 | 6.44e-01 | 0.0596 |
| 51069 | MRPL2 | LZE6T | Human | Esophagus | ESCC | 4.86e-06 | 5.31e-01 | 0.0845 |
| 51069 | MRPL2 | P1T-E | Human | Esophagus | ESCC | 1.62e-15 | 6.83e-01 | 0.0875 |
| 51069 | MRPL2 | P2T-E | Human | Esophagus | ESCC | 2.03e-27 | 6.00e-01 | 0.1177 |
| 51069 | MRPL2 | P4T-E | Human | Esophagus | ESCC | 1.09e-33 | 9.99e-01 | 0.1323 |
| 51069 | MRPL2 | P5T-E | Human | Esophagus | ESCC | 3.64e-45 | 8.66e-01 | 0.1327 |
| 51069 | MRPL2 | P8T-E | Human | Esophagus | ESCC | 1.96e-26 | 5.31e-01 | 0.0889 |
| 51069 | MRPL2 | P9T-E | Human | Esophagus | ESCC | 2.08e-25 | 6.39e-01 | 0.1131 |
| 51069 | MRPL2 | P10T-E | Human | Esophagus | ESCC | 4.71e-25 | 4.09e-01 | 0.116 |
| 51069 | MRPL2 | P11T-E | Human | Esophagus | ESCC | 9.57e-17 | 6.77e-01 | 0.1426 |
| 51069 | MRPL2 | P12T-E | Human | Esophagus | ESCC | 2.26e-36 | 5.84e-01 | 0.1122 |
| 51069 | MRPL2 | P15T-E | Human | Esophagus | ESCC | 6.80e-24 | 5.47e-01 | 0.1149 |
| Page: 1 2 3 4 5 6 |
| Tissue | Expression Dynamics | Abbreviation |
| Esophagus | 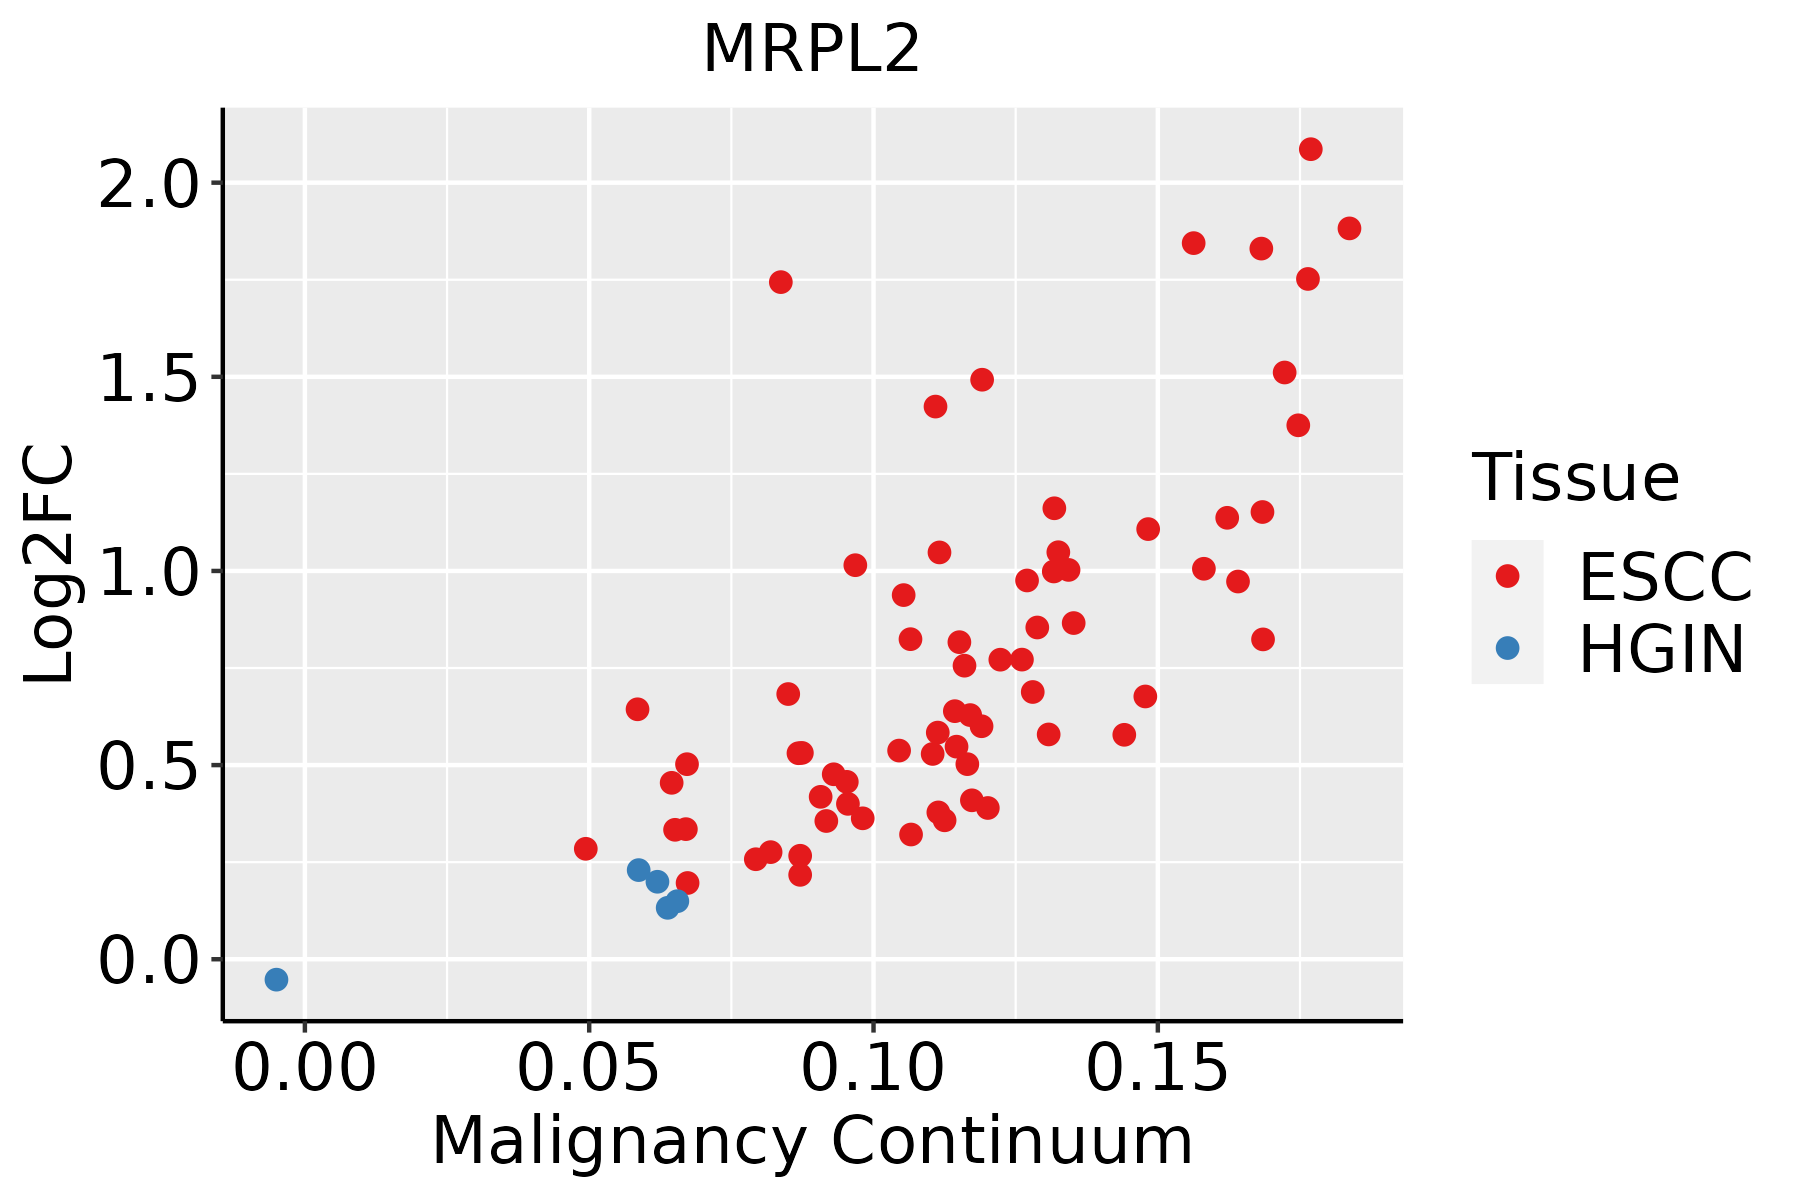 | ESCC: Esophageal squamous cell carcinoma |
| HGIN: High-grade intraepithelial neoplasias | ||
| LGIN: Low-grade intraepithelial neoplasias | ||
| Liver |  | HCC: Hepatocellular carcinoma |
| NAFLD: Non-alcoholic fatty liver disease | ||
| Oral Cavity |  | EOLP: Erosive Oral lichen planus |
| LP: leukoplakia | ||
| NEOLP: Non-erosive oral lichen planus | ||
| OSCC: Oral squamous cell carcinoma | ||
| Skin | 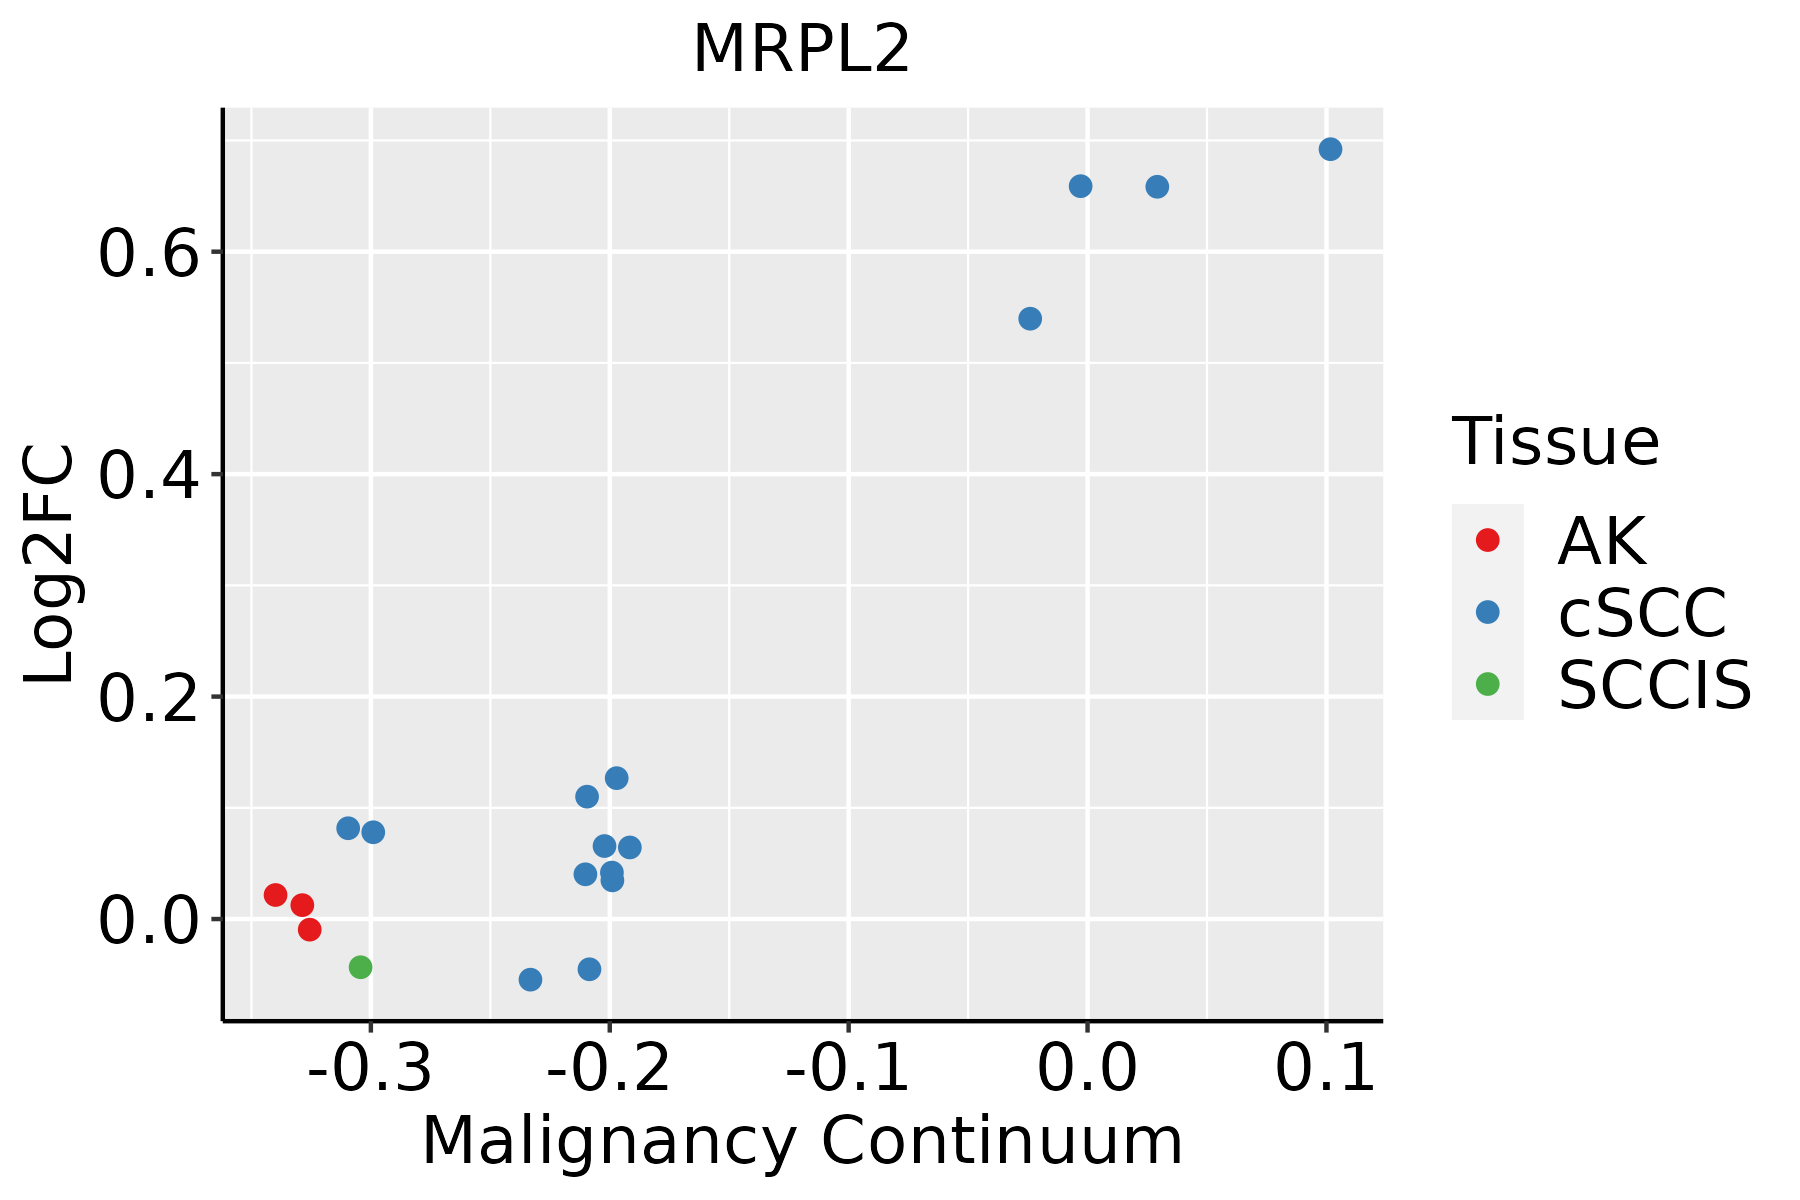 | AK: Actinic keratosis |
| cSCC: Cutaneous squamous cell carcinoma | ||
| SCCIS:squamous cell carcinoma in situ | ||
| Thyroid |  | ATC: Anaplastic thyroid cancer |
| HT: Hashimoto's thyroiditis | ||
| PTC: Papillary thyroid cancer |
| ∗log2FC in expression of this searched gene in stem-like cells from each diseased tissue sample relative to stem-like cells in normal samples in each tissue plotted against the malignancy continuum. Samples are colored based on if they are from different disease stage. |
Top |
Malignant transformation related pathway analysis |
| Find out the enriched GO biological processes and KEGG pathways involved in transition from healthy to precancer to cancer |
| Tissue | Disease Stage | Enriched GO biological Processes |
| Colorectum | AD |  |
| Colorectum | SER |  |
| Colorectum | MSS |  |
| Colorectum | MSI-H |  |
| Colorectum | FAP |  |
| ∗Top 15 enriched GO BP terms are showed in the bar plot of each disease state in each tissue. Each row represents a significant GO biological process which is colored according to the -log10(p.adjust). |
| Page: 1 2 3 4 5 6 7 8 9 |
| GO ID | Tissue | Disease Stage | Description | Gene Ratio | Bg Ratio | pvalue | p.adjust | Count |
| GO:00226139 | Breast | Precancer | ribonucleoprotein complex biogenesis | 79/1080 | 463/18723 | 2.11e-18 | 1.03e-15 | 79 |
| GO:00718269 | Breast | Precancer | ribonucleoprotein complex subunit organization | 48/1080 | 227/18723 | 2.68e-15 | 8.45e-13 | 48 |
| GO:00226189 | Breast | Precancer | ribonucleoprotein complex assembly | 47/1080 | 220/18723 | 3.47e-15 | 1.03e-12 | 47 |
| GO:00422549 | Breast | Precancer | ribosome biogenesis | 52/1080 | 299/18723 | 7.35e-13 | 1.51e-10 | 52 |
| GO:00422559 | Breast | Precancer | ribosome assembly | 21/1080 | 61/18723 | 1.06e-11 | 1.53e-09 | 21 |
| GO:00422739 | Breast | Precancer | ribosomal large subunit biogenesis | 22/1080 | 72/18723 | 5.03e-11 | 5.61e-09 | 22 |
| GO:00000279 | Breast | Precancer | ribosomal large subunit assembly | 9/1080 | 27/18723 | 1.24e-05 | 3.19e-04 | 9 |
| GO:002261314 | Breast | IDC | ribonucleoprotein complex biogenesis | 83/1434 | 463/18723 | 2.01e-13 | 5.20e-11 | 83 |
| GO:007182614 | Breast | IDC | ribonucleoprotein complex subunit organization | 52/1434 | 227/18723 | 5.18e-13 | 1.21e-10 | 52 |
| GO:002261814 | Breast | IDC | ribonucleoprotein complex assembly | 51/1434 | 220/18723 | 5.32e-13 | 1.21e-10 | 51 |
| GO:004225514 | Breast | IDC | ribosome assembly | 21/1434 | 61/18723 | 1.98e-09 | 1.76e-07 | 21 |
| GO:004227314 | Breast | IDC | ribosomal large subunit biogenesis | 22/1434 | 72/18723 | 1.04e-08 | 7.67e-07 | 22 |
| GO:004225414 | Breast | IDC | ribosome biogenesis | 52/1434 | 299/18723 | 1.90e-08 | 1.32e-06 | 52 |
| GO:000002714 | Breast | IDC | ribosomal large subunit assembly | 9/1434 | 27/18723 | 1.17e-04 | 2.17e-03 | 9 |
| GO:002261324 | Breast | DCIS | ribonucleoprotein complex biogenesis | 83/1390 | 463/18723 | 3.65e-14 | 1.09e-11 | 83 |
| GO:007182624 | Breast | DCIS | ribonucleoprotein complex subunit organization | 52/1390 | 227/18723 | 1.54e-13 | 3.95e-11 | 52 |
| GO:002261824 | Breast | DCIS | ribonucleoprotein complex assembly | 51/1390 | 220/18723 | 1.60e-13 | 3.95e-11 | 51 |
| GO:004225524 | Breast | DCIS | ribosome assembly | 21/1390 | 61/18723 | 1.13e-09 | 1.14e-07 | 21 |
| GO:004227324 | Breast | DCIS | ribosomal large subunit biogenesis | 22/1390 | 72/18723 | 5.88e-09 | 4.82e-07 | 22 |
| GO:004225423 | Breast | DCIS | ribosome biogenesis | 52/1390 | 299/18723 | 6.73e-09 | 5.44e-07 | 52 |
| Page: 1 2 3 4 5 6 7 8 |
| Pathway ID | Tissue | Disease Stage | Description | Gene Ratio | Bg Ratio | pvalue | p.adjust | qvalue | Count |
| hsa0301039 | Esophagus | HGIN | Ribosome | 108/1383 | 167/8465 | 1.44e-45 | 4.71e-43 | 3.74e-43 | 108 |
| hsa03010115 | Esophagus | HGIN | Ribosome | 108/1383 | 167/8465 | 1.44e-45 | 4.71e-43 | 3.74e-43 | 108 |
| hsa03010211 | Esophagus | ESCC | Ribosome | 129/4205 | 167/8465 | 1.43e-13 | 3.43e-12 | 1.75e-12 | 129 |
| hsa03010310 | Esophagus | ESCC | Ribosome | 129/4205 | 167/8465 | 1.43e-13 | 3.43e-12 | 1.75e-12 | 129 |
| hsa0301022 | Liver | Cirrhotic | Ribosome | 127/2530 | 167/8465 | 2.12e-35 | 7.06e-33 | 4.35e-33 | 127 |
| hsa0301032 | Liver | Cirrhotic | Ribosome | 127/2530 | 167/8465 | 2.12e-35 | 7.06e-33 | 4.35e-33 | 127 |
| hsa0301042 | Liver | HCC | Ribosome | 128/4020 | 167/8465 | 7.32e-15 | 2.23e-13 | 1.24e-13 | 128 |
| hsa0301052 | Liver | HCC | Ribosome | 128/4020 | 167/8465 | 7.32e-15 | 2.23e-13 | 1.24e-13 | 128 |
| hsa0301030 | Oral cavity | OSCC | Ribosome | 128/3704 | 167/8465 | 2.42e-18 | 1.62e-16 | 8.25e-17 | 128 |
| hsa03010114 | Oral cavity | OSCC | Ribosome | 128/3704 | 167/8465 | 2.42e-18 | 1.62e-16 | 8.25e-17 | 128 |
| hsa03010210 | Oral cavity | LP | Ribosome | 127/2418 | 167/8465 | 1.22e-37 | 4.05e-35 | 2.61e-35 | 127 |
| hsa0301038 | Oral cavity | LP | Ribosome | 127/2418 | 167/8465 | 1.22e-37 | 4.05e-35 | 2.61e-35 | 127 |
| Page: 1 |
Top |
Cell-cell communication analysis |
| Identification of potential cell-cell interactions between two cell types and their ligand-receptor pairs for different disease states |
| Ligand | Receptor | LRpair | Pathway | Tissue | Disease Stage |
| Page: 1 |
Top |
Single-cell gene regulatory network inference analysis |
| Find out the significant the regulons (TFs) and the target genes of each regulon across cell types for different disease states |
| TF | Cell Type | Tissue | Disease Stage | Target Gene | RSS | Regulon Activity |
| MRPL2 | CLUB | Lung | Healthy | PIGR,B3GNT7,HSP90B1, etc. | 1.63e-01 |  |
| MRPL2 | MSC | Pancreas | ADJ | CKB,COL13A1,NKX2-3, etc. | 2.08e-02 |  |
| MRPL2 | FIB | Pancreas | ADJ | CKB,COL13A1,NKX2-3, etc. | 5.01e-03 | |
| MRPL2 | MYOFIB | Pancreas | Healthy | CKB,COL13A1,NKX2-3, etc. | 1.89e-01 |  |
| MRPL2 | MSC | Pancreas | Healthy | CKB,COL13A1,NKX2-3, etc. | 3.67e-02 | |
| MRPL2 | MSC | Pancreas | PanIN | CKB,COL13A1,NKX2-3, etc. | 7.90e-02 |  |
| MRPL2 | MSC | Pancreas | PDAC | CKB,COL13A1,NKX2-3, etc. | 1.84e-01 |  |
| ∗The dot plots of a searched regulon are shown for all cell subpopulations in each disease state of each tissue based on the regulon specific score inferred using pySCENIC and by calculating the average expression. |
| Page: 1 |
Top |
Somatic mutation of malignant transformation related genes |
| Annotation of somatic variants for genes involved in malignant transformation |
| Hugo Symbol | Variant Class | Variant Classification | dbSNP RS | HGVSc | HGVSp | HGVSp Short | SWISSPROT | BIOTYPE | SIFT | PolyPhen | Tumor Sample Barcode | Tissue | Histology | Sex | Age | Stage | Therapy Types | Drugs | Outcome |
| MRPL2 | SNV | Missense_Mutation | novel | c.452T>G | p.Ile151Ser | p.I151S | Q5T653 | protein_coding | deleterious(0) | probably_damaging(1) | TCGA-AN-A046-01 | Breast | breast invasive carcinoma | Female | >=65 | I/II | Unknown | Unknown | SD |
| MRPL2 | SNV | Missense_Mutation | c.724N>T | p.Ala242Ser | p.A242S | Q5T653 | protein_coding | deleterious(0.01) | possibly_damaging(0.797) | TCGA-BH-A0BD-01 | Breast | breast invasive carcinoma | Female | <65 | I/II | Chemotherapy | doxorubicin | SD | |
| MRPL2 | SNV | Missense_Mutation | c.102N>A | p.Met34Ile | p.M34I | Q5T653 | protein_coding | tolerated_low_confidence(0.57) | benign(0) | TCGA-C8-A1HM-01 | Breast | breast invasive carcinoma | Female | >=65 | I/II | Chemotherapy | doxorubicin | CR | |
| MRPL2 | SNV | Missense_Mutation | rs201420185 | c.835N>A | p.Gly279Arg | p.G279R | Q5T653 | protein_coding | deleterious(0.01) | probably_damaging(1) | TCGA-C8-A274-01 | Breast | breast invasive carcinoma | Female | <65 | I/II | Hormone Therapy | tamoxiphen | SD |
| MRPL2 | SNV | Missense_Mutation | c.372G>C | p.Glu124Asp | p.E124D | Q5T653 | protein_coding | deleterious(0.04) | possibly_damaging(0.808) | TCGA-E9-A1R4-01 | Breast | breast invasive carcinoma | Female | >=65 | I/II | Chemotherapy | 5-fluorouracil | SD | |
| MRPL2 | deletion | Frame_Shift_Del | novel | c.126delN | p.Ser43LeufsTer3 | p.S43Lfs*3 | Q5T653 | protein_coding | TCGA-D8-A27V-01 | Breast | breast invasive carcinoma | Female | <65 | I/II | Hormone Therapy | tamoxiphen | SD | ||
| MRPL2 | SNV | Missense_Mutation | novel | c.405N>T | p.Arg135Ser | p.R135S | Q5T653 | protein_coding | deleterious(0) | probably_damaging(0.999) | TCGA-VS-A950-01 | Cervix | cervical & endocervical cancer | Female | <65 | III/IV | Unknown | Unknown | SD |
| MRPL2 | SNV | Missense_Mutation | rs532734983 | c.512N>A | p.Arg171Gln | p.R171Q | Q5T653 | protein_coding | tolerated(0.06) | probably_damaging(0.998) | TCGA-A6-2672-01 | Colorectum | colon adenocarcinoma | Female | >=65 | III/IV | Unknown | Unknown | SD |
| MRPL2 | SNV | Missense_Mutation | c.830N>A | p.Arg277His | p.R277H | Q5T653 | protein_coding | deleterious(0) | probably_damaging(0.999) | TCGA-AU-6004-01 | Colorectum | colon adenocarcinoma | Female | >=65 | I/II | Unknown | Unknown | SD | |
| MRPL2 | SNV | Missense_Mutation | novel | c.187N>G | p.Phe63Val | p.F63V | Q5T653 | protein_coding | tolerated(0.55) | benign(0) | TCGA-CA-6717-01 | Colorectum | colon adenocarcinoma | Male | <65 | I/II | Chemotherapy | oxaliplatin | CR |
| Page: 1 2 3 4 |
Top |
Related drugs of malignant transformation related genes |
| Identification of chemicals and drugs interact with genes involved in malignant transfromation |
| (DGIdb 4.0) |
| Entrez ID | Symbol | Category | Interaction Types | Drug Claim Name | Drug Name | PMIDs |
| Page: 1 |

Copyright 2023-Present -The University of Texas Health Science Center at Houston |