
|
|||||
|
 | |
| |
| |
| |
| |
| |
|
Gene: MRPL18 |
Gene summary for MRPL18 |
| Gene information | Species | Human | Gene symbol | MRPL18 | Gene ID | 29074 |
| Gene name | mitochondrial ribosomal protein L18 | |
| Gene Alias | HSPC071 | |
| Cytomap | 6q25.3 | |
| Gene Type | protein-coding | GO ID | GO:0006403 | UniProtAcc | Q9H0U6 |
Top |
Malignant transformation analysis |
| Identification of the aberrant gene expression in precancerous and cancerous lesions by comparing the gene expression of stem-like cells in diseased tissues with normal stem cells |
| Entrez ID | Symbol | Replicates | Species | Organ | Tissue | Adj P-value | Log2FC | Malignancy |
| 29074 | MRPL18 | HTA11_3410_2000001011 | Human | Colorectum | AD | 6.59e-05 | 1.41e-01 | 0.0155 |
| 29074 | MRPL18 | HTA11_2487_2000001011 | Human | Colorectum | SER | 1.93e-02 | 1.80e-01 | -0.1808 |
| 29074 | MRPL18 | HTA11_1938_2000001011 | Human | Colorectum | AD | 4.57e-07 | 2.95e-01 | -0.0811 |
| 29074 | MRPL18 | HTA11_347_2000001011 | Human | Colorectum | AD | 1.49e-18 | 4.07e-01 | -0.1954 |
| 29074 | MRPL18 | HTA11_411_2000001011 | Human | Colorectum | SER | 3.31e-06 | 5.74e-01 | -0.2602 |
| 29074 | MRPL18 | HTA11_83_2000001011 | Human | Colorectum | SER | 6.69e-05 | 3.21e-01 | -0.1526 |
| 29074 | MRPL18 | HTA11_696_2000001011 | Human | Colorectum | AD | 1.12e-06 | 2.81e-01 | -0.1464 |
| 29074 | MRPL18 | HTA11_1391_2000001011 | Human | Colorectum | AD | 1.13e-08 | 4.17e-01 | -0.059 |
| 29074 | MRPL18 | HTA11_546_2000001011 | Human | Colorectum | AD | 1.15e-02 | 1.59e-01 | -0.0842 |
| 29074 | MRPL18 | HTA11_9341_2000001011 | Human | Colorectum | SER | 7.82e-03 | 3.17e-01 | -0.00410000000000005 |
| 29074 | MRPL18 | HTA11_7862_2000001011 | Human | Colorectum | AD | 4.70e-04 | 2.69e-01 | -0.0179 |
| 29074 | MRPL18 | HTA11_866_3004761011 | Human | Colorectum | AD | 6.96e-09 | 3.48e-01 | 0.096 |
| 29074 | MRPL18 | HTA11_10623_2000001011 | Human | Colorectum | AD | 5.30e-04 | 2.49e-01 | -0.0177 |
| 29074 | MRPL18 | HTA11_6801_2000001011 | Human | Colorectum | SER | 1.57e-04 | 4.86e-01 | 0.0171 |
| 29074 | MRPL18 | HTA11_99999970781_79442 | Human | Colorectum | MSS | 4.44e-08 | 3.38e-01 | 0.294 |
| 29074 | MRPL18 | HTA11_99999965104_69814 | Human | Colorectum | MSS | 3.23e-03 | 1.91e-01 | 0.281 |
| 29074 | MRPL18 | HTA11_99999971662_82457 | Human | Colorectum | MSS | 2.93e-16 | 5.71e-01 | 0.3859 |
| 29074 | MRPL18 | HTA11_99999973899_84307 | Human | Colorectum | MSS | 1.19e-05 | 4.20e-01 | 0.2585 |
| 29074 | MRPL18 | AEH-subject2 | Human | Endometrium | AEH | 5.36e-11 | -1.80e-01 | -0.2525 |
| 29074 | MRPL18 | EEC-subject1 | Human | Endometrium | EEC | 6.53e-08 | -6.07e-02 | -0.2682 |
| Page: 1 2 3 4 5 6 7 8 9 10 11 |
| Tissue | Expression Dynamics | Abbreviation |
| Colorectum (GSE201348) |  | FAP: Familial adenomatous polyposis |
| CRC: Colorectal cancer | ||
| Colorectum (HTA11) |  | AD: Adenomas |
| SER: Sessile serrated lesions | ||
| MSI-H: Microsatellite-high colorectal cancer | ||
| MSS: Microsatellite stable colorectal cancer | ||
| Endometrium | 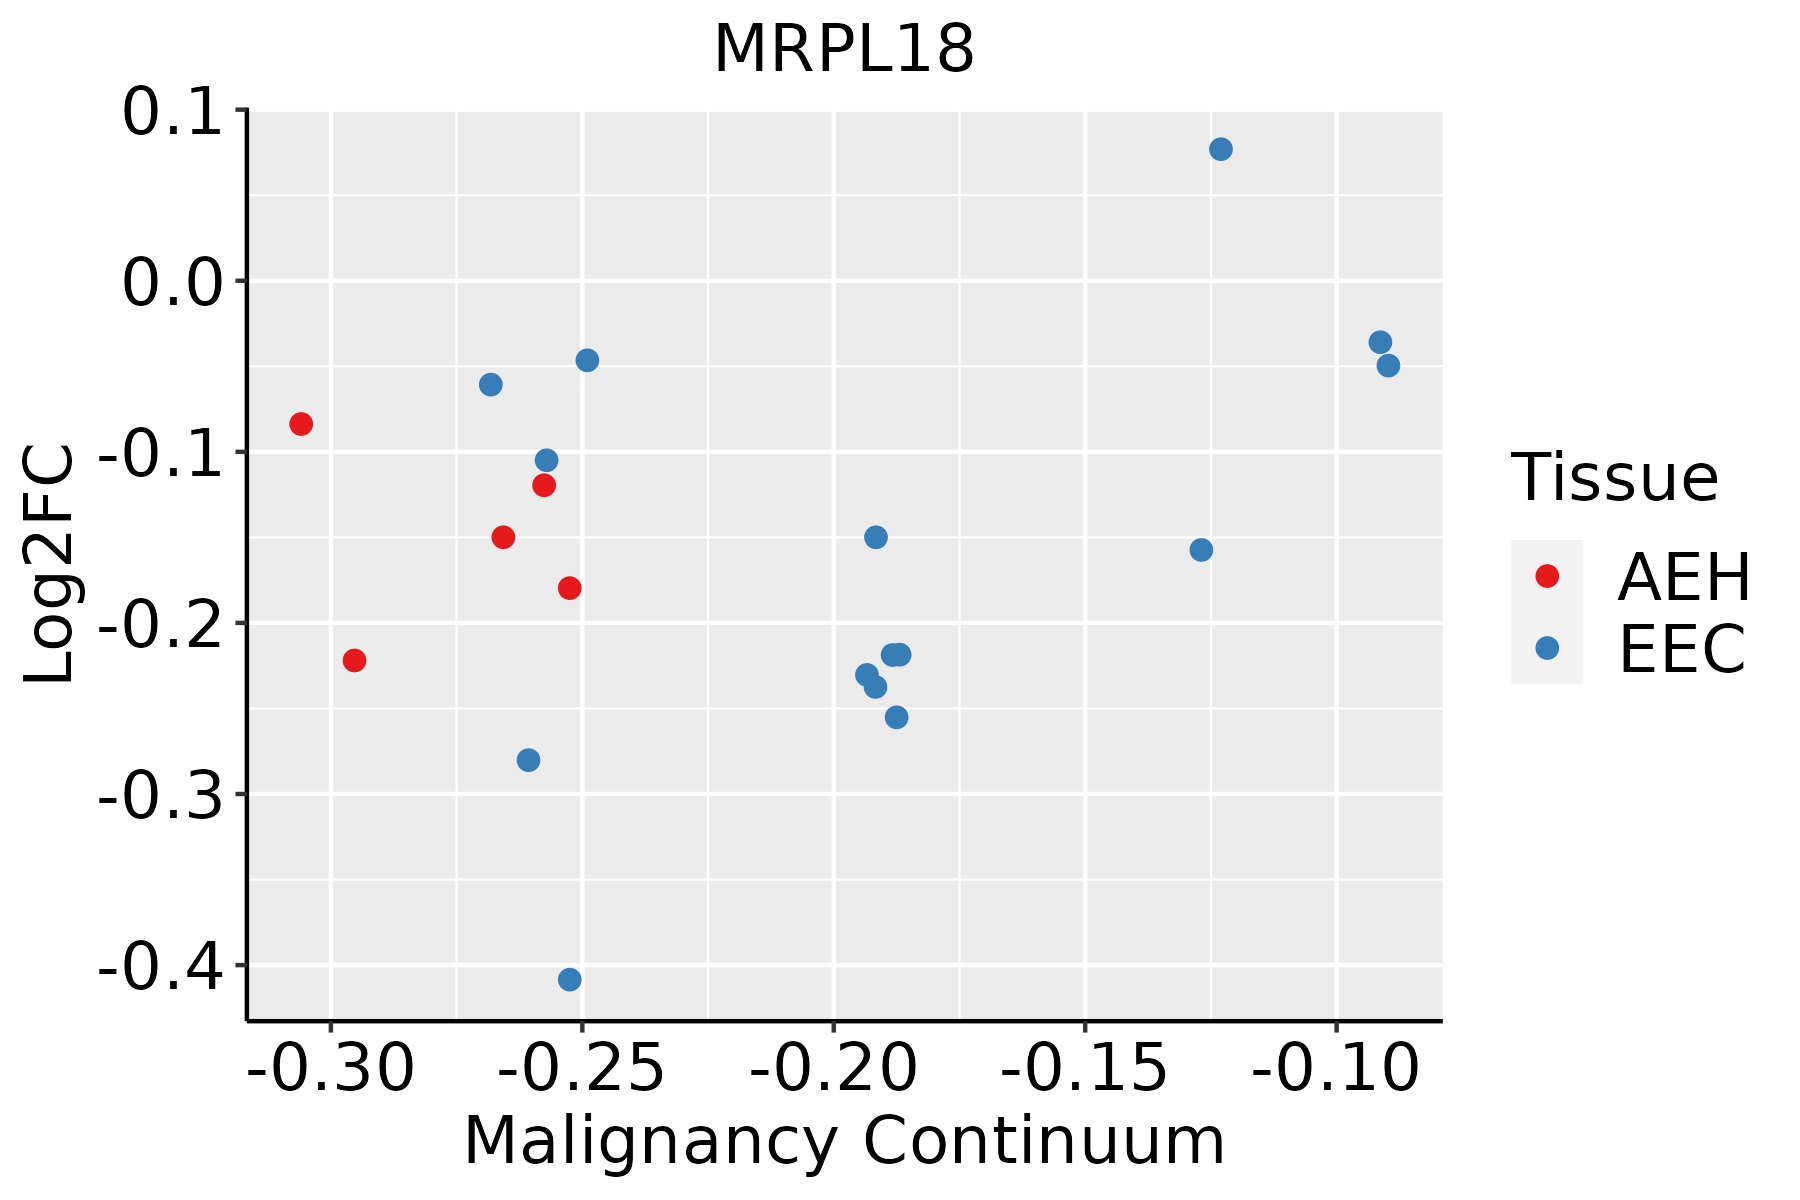 | AEH: Atypical endometrial hyperplasia |
| EEC: Endometrioid Cancer | ||
| Esophagus |  | ESCC: Esophageal squamous cell carcinoma |
| HGIN: High-grade intraepithelial neoplasias | ||
| LGIN: Low-grade intraepithelial neoplasias | ||
| GC |  | CAG: Chronic atrophic gastritis |
| CAG with IM: Chronic atrophic gastritis with intestinal metaplasia | ||
| CSG: Chronic superficial gastritis | ||
| GC: Gastric cancer | ||
| SIM: Severe intestinal metaplasia | ||
| WIM: Wild intestinal metaplasia | ||
| Liver | 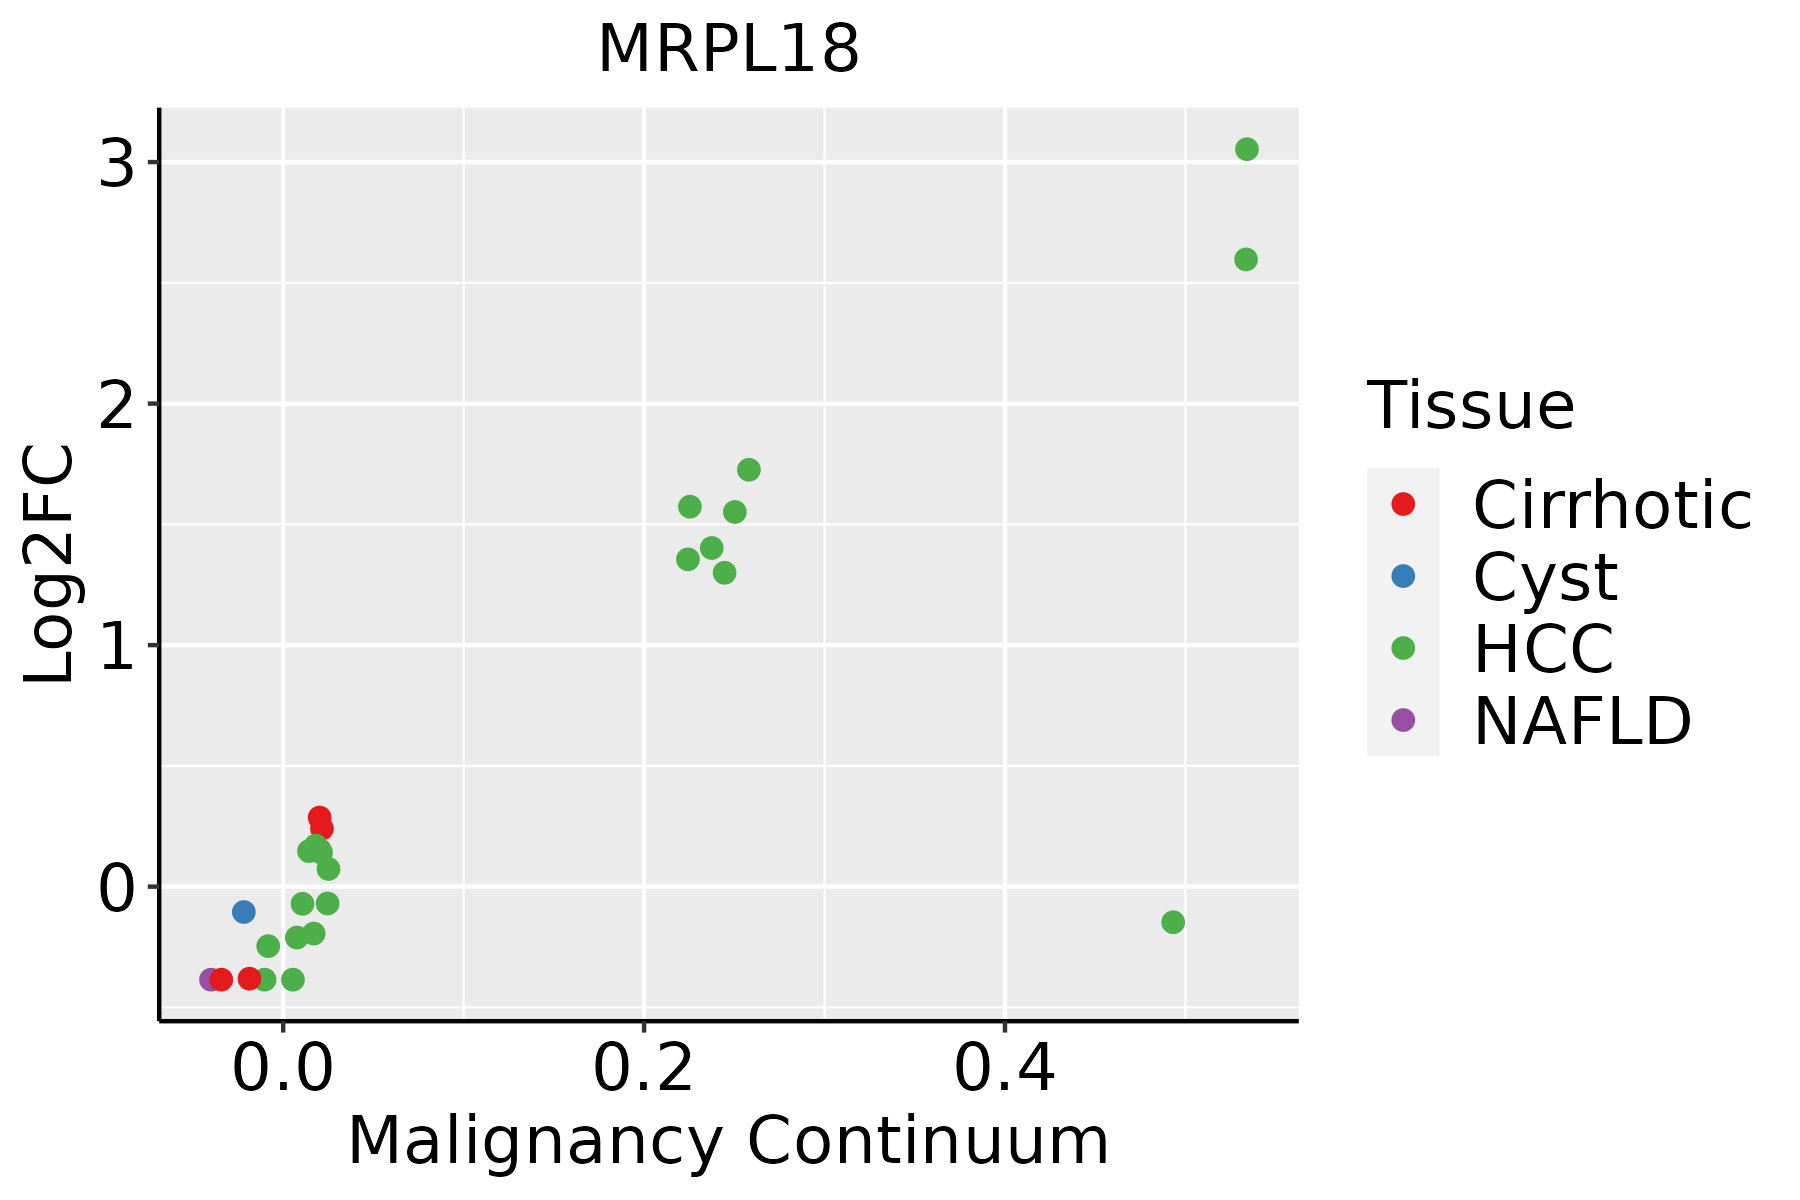 | HCC: Hepatocellular carcinoma |
| NAFLD: Non-alcoholic fatty liver disease | ||
| Oral Cavity |  | EOLP: Erosive Oral lichen planus |
| LP: leukoplakia | ||
| NEOLP: Non-erosive oral lichen planus | ||
| OSCC: Oral squamous cell carcinoma | ||
| Prostate | 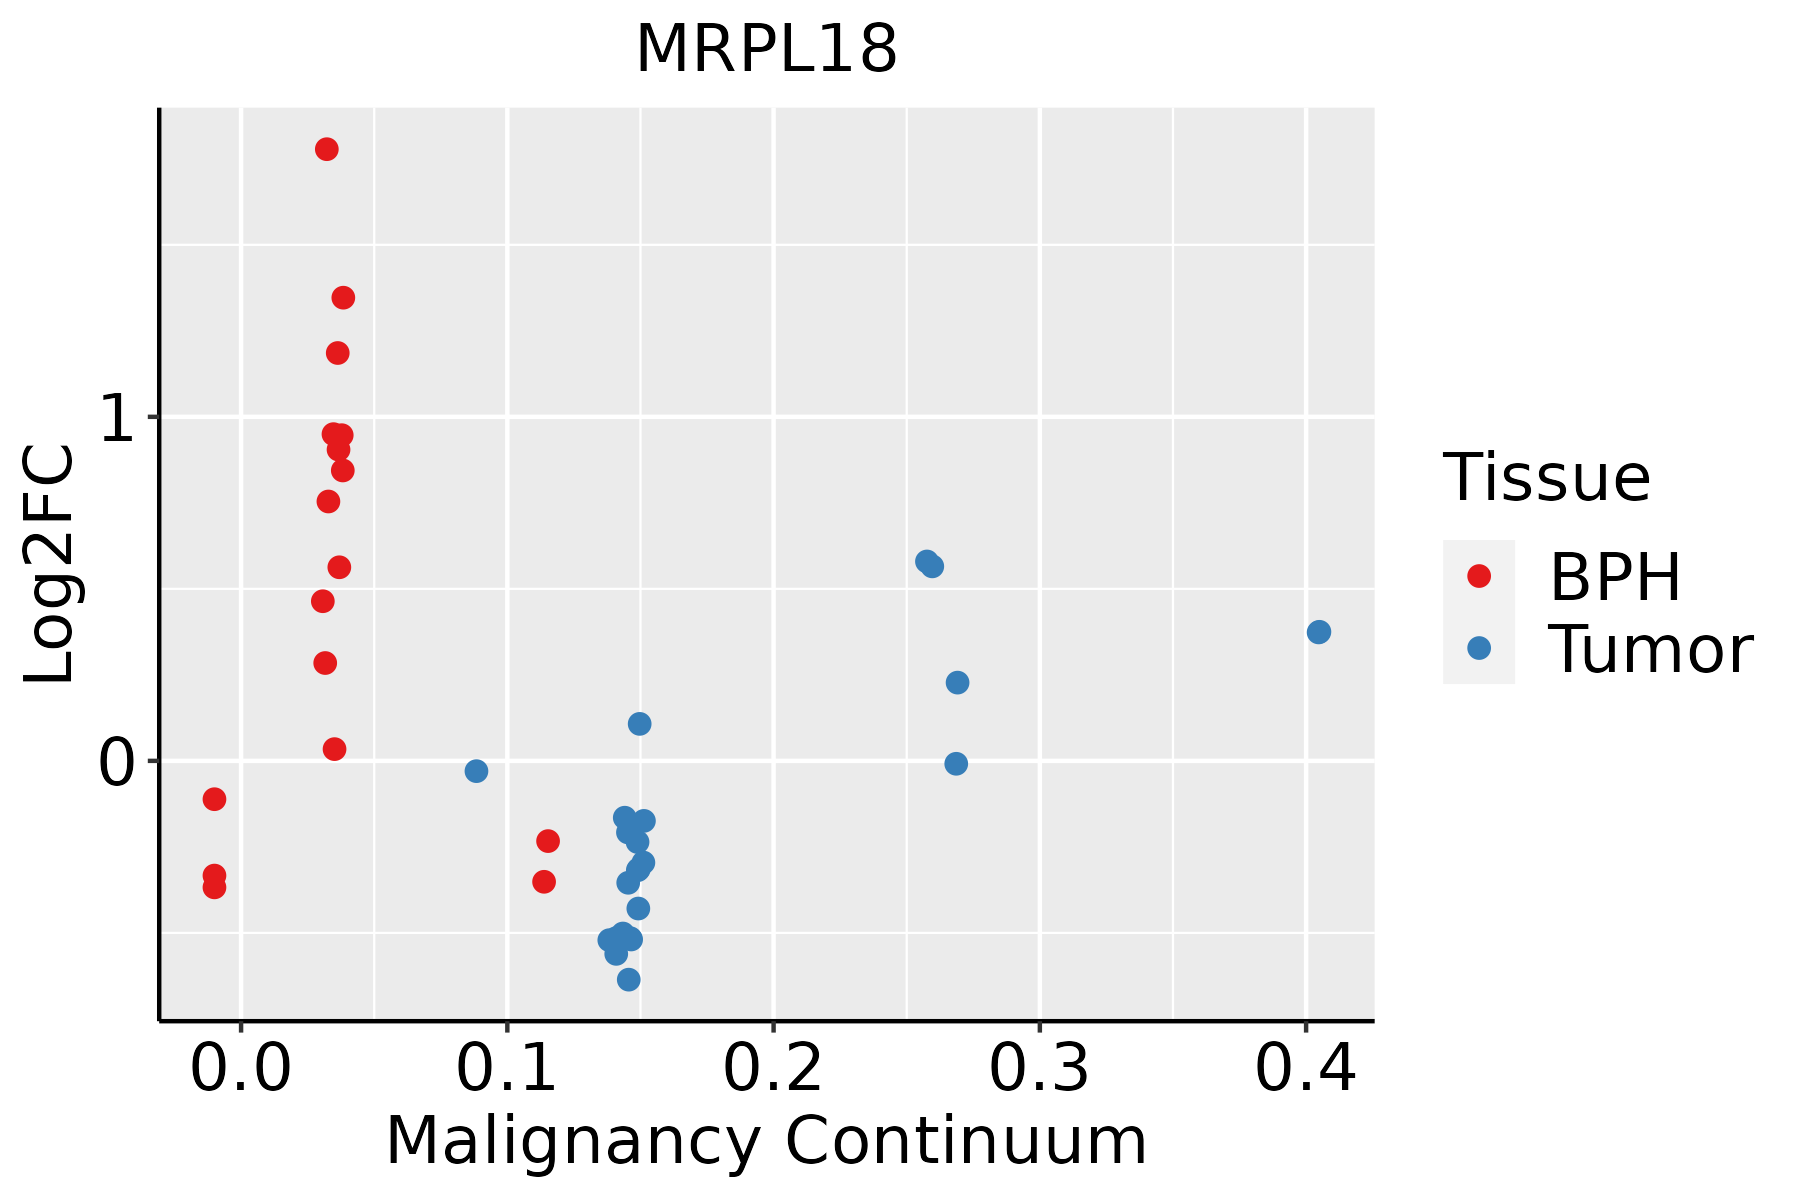 | BPH: Benign Prostatic Hyperplasia |
| Skin |  | AK: Actinic keratosis |
| cSCC: Cutaneous squamous cell carcinoma | ||
| SCCIS:squamous cell carcinoma in situ | ||
| Thyroid | 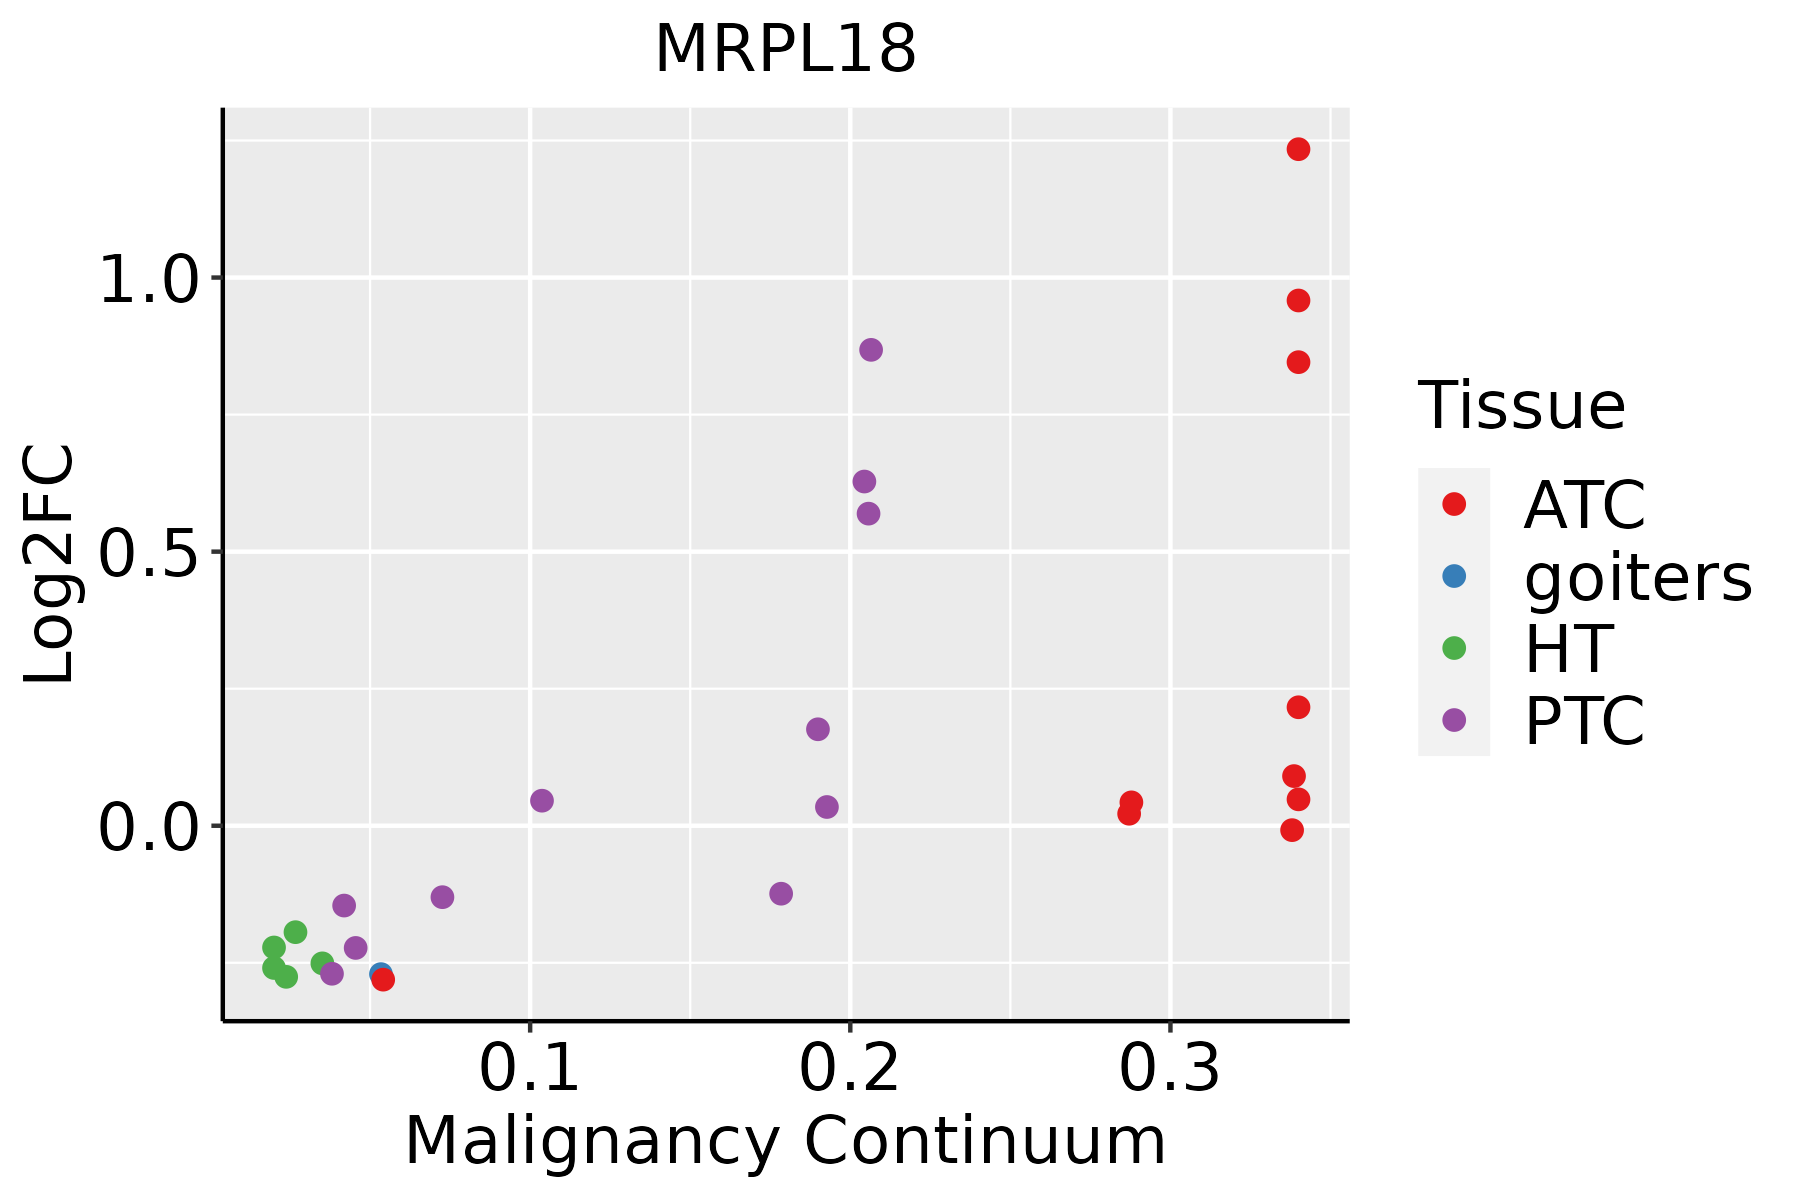 | ATC: Anaplastic thyroid cancer |
| HT: Hashimoto's thyroiditis | ||
| PTC: Papillary thyroid cancer |
| ∗log2FC in expression of this searched gene in stem-like cells from each diseased tissue sample relative to stem-like cells in normal samples in each tissue plotted against the malignancy continuum. Samples are colored based on if they are from different disease stage. |
Top |
Malignant transformation related pathway analysis |
| Find out the enriched GO biological processes and KEGG pathways involved in transition from healthy to precancer to cancer |
| Tissue | Disease Stage | Enriched GO biological Processes |
| Colorectum | AD |  |
| Colorectum | SER |  |
| Colorectum | MSS |  |
| Colorectum | MSI-H |  |
| Colorectum | FAP |  |
| ∗Top 15 enriched GO BP terms are showed in the bar plot of each disease state in each tissue. Each row represents a significant GO biological process which is colored according to the -log10(p.adjust). |
| Page: 1 2 3 4 5 6 7 8 9 |
| GO ID | Tissue | Disease Stage | Description | Gene Ratio | Bg Ratio | pvalue | p.adjust | Count |
| GO:0006839 | Colorectum | AD | mitochondrial transport | 102/3918 | 254/18723 | 1.87e-12 | 3.08e-10 | 102 |
| GO:1990542 | Colorectum | AD | mitochondrial transmembrane transport | 47/3918 | 102/18723 | 1.09e-08 | 6.52e-07 | 47 |
| GO:0006403 | Colorectum | AD | RNA localization | 71/3918 | 201/18723 | 1.54e-06 | 4.76e-05 | 71 |
| GO:0051236 | Colorectum | AD | establishment of RNA localization | 58/3918 | 166/18723 | 1.95e-05 | 4.01e-04 | 58 |
| GO:0015931 | Colorectum | AD | nucleobase-containing compound transport | 73/3918 | 222/18723 | 2.02e-05 | 4.10e-04 | 73 |
| GO:0050657 | Colorectum | AD | nucleic acid transport | 57/3918 | 163/18723 | 2.22e-05 | 4.39e-04 | 57 |
| GO:0050658 | Colorectum | AD | RNA transport | 57/3918 | 163/18723 | 2.22e-05 | 4.39e-04 | 57 |
| GO:00068391 | Colorectum | SER | mitochondrial transport | 87/2897 | 254/18723 | 7.91e-14 | 3.03e-11 | 87 |
| GO:19905421 | Colorectum | SER | mitochondrial transmembrane transport | 42/2897 | 102/18723 | 3.65e-10 | 4.77e-08 | 42 |
| GO:00064031 | Colorectum | SER | RNA localization | 53/2897 | 201/18723 | 4.51e-05 | 1.13e-03 | 53 |
| GO:00159311 | Colorectum | SER | nucleobase-containing compound transport | 54/2897 | 222/18723 | 3.65e-04 | 5.67e-03 | 54 |
| GO:00512361 | Colorectum | SER | establishment of RNA localization | 42/2897 | 166/18723 | 6.70e-04 | 8.96e-03 | 42 |
| GO:00506571 | Colorectum | SER | nucleic acid transport | 41/2897 | 163/18723 | 8.74e-04 | 1.06e-02 | 41 |
| GO:00506581 | Colorectum | SER | RNA transport | 41/2897 | 163/18723 | 8.74e-04 | 1.06e-02 | 41 |
| GO:00068392 | Colorectum | MSS | mitochondrial transport | 93/3467 | 254/18723 | 6.14e-12 | 9.82e-10 | 93 |
| GO:00064032 | Colorectum | MSS | RNA localization | 69/3467 | 201/18723 | 6.33e-08 | 3.26e-06 | 69 |
| GO:19905422 | Colorectum | MSS | mitochondrial transmembrane transport | 41/3467 | 102/18723 | 2.70e-07 | 1.11e-05 | 41 |
| GO:00159312 | Colorectum | MSS | nucleobase-containing compound transport | 70/3467 | 222/18723 | 1.92e-06 | 6.01e-05 | 70 |
| GO:00512362 | Colorectum | MSS | establishment of RNA localization | 55/3467 | 166/18723 | 4.54e-06 | 1.27e-04 | 55 |
| GO:00506572 | Colorectum | MSS | nucleic acid transport | 54/3467 | 163/18723 | 5.54e-06 | 1.49e-04 | 54 |
| Page: 1 2 3 4 5 6 7 |
| Pathway ID | Tissue | Disease Stage | Description | Gene Ratio | Bg Ratio | pvalue | p.adjust | qvalue | Count |
| hsa03010 | Colorectum | AD | Ribosome | 96/2092 | 167/8465 | 8.28e-20 | 5.54e-18 | 3.54e-18 | 96 |
| hsa030101 | Colorectum | AD | Ribosome | 96/2092 | 167/8465 | 8.28e-20 | 5.54e-18 | 3.54e-18 | 96 |
| hsa030102 | Colorectum | SER | Ribosome | 92/1580 | 167/8465 | 2.21e-26 | 3.66e-24 | 2.66e-24 | 92 |
| hsa030103 | Colorectum | SER | Ribosome | 92/1580 | 167/8465 | 2.21e-26 | 3.66e-24 | 2.66e-24 | 92 |
| hsa030104 | Colorectum | MSS | Ribosome | 96/1875 | 167/8465 | 1.82e-23 | 2.03e-21 | 1.24e-21 | 96 |
| hsa030105 | Colorectum | MSS | Ribosome | 96/1875 | 167/8465 | 1.82e-23 | 2.03e-21 | 1.24e-21 | 96 |
| hsa0301027 | Endometrium | EEC | Ribosome | 89/1237 | 167/8465 | 2.55e-32 | 8.39e-30 | 6.26e-30 | 89 |
| hsa0301036 | Endometrium | EEC | Ribosome | 89/1237 | 167/8465 | 2.55e-32 | 8.39e-30 | 6.26e-30 | 89 |
| hsa03010211 | Esophagus | ESCC | Ribosome | 129/4205 | 167/8465 | 1.43e-13 | 3.43e-12 | 1.75e-12 | 129 |
| hsa03010310 | Esophagus | ESCC | Ribosome | 129/4205 | 167/8465 | 1.43e-13 | 3.43e-12 | 1.75e-12 | 129 |
| hsa0301022 | Liver | Cirrhotic | Ribosome | 127/2530 | 167/8465 | 2.12e-35 | 7.06e-33 | 4.35e-33 | 127 |
| hsa0301032 | Liver | Cirrhotic | Ribosome | 127/2530 | 167/8465 | 2.12e-35 | 7.06e-33 | 4.35e-33 | 127 |
| hsa0301042 | Liver | HCC | Ribosome | 128/4020 | 167/8465 | 7.32e-15 | 2.23e-13 | 1.24e-13 | 128 |
| hsa0301052 | Liver | HCC | Ribosome | 128/4020 | 167/8465 | 7.32e-15 | 2.23e-13 | 1.24e-13 | 128 |
| hsa0301030 | Oral cavity | OSCC | Ribosome | 128/3704 | 167/8465 | 2.42e-18 | 1.62e-16 | 8.25e-17 | 128 |
| hsa03010114 | Oral cavity | OSCC | Ribosome | 128/3704 | 167/8465 | 2.42e-18 | 1.62e-16 | 8.25e-17 | 128 |
| hsa03010210 | Oral cavity | LP | Ribosome | 127/2418 | 167/8465 | 1.22e-37 | 4.05e-35 | 2.61e-35 | 127 |
| hsa0301038 | Oral cavity | LP | Ribosome | 127/2418 | 167/8465 | 1.22e-37 | 4.05e-35 | 2.61e-35 | 127 |
| hsa0301028 | Prostate | BPH | Ribosome | 104/1718 | 167/8465 | 8.04e-33 | 1.33e-30 | 8.21e-31 | 104 |
| hsa03010113 | Prostate | BPH | Ribosome | 104/1718 | 167/8465 | 8.04e-33 | 1.33e-30 | 8.21e-31 | 104 |
| Page: 1 2 |
Top |
Cell-cell communication analysis |
| Identification of potential cell-cell interactions between two cell types and their ligand-receptor pairs for different disease states |
| Ligand | Receptor | LRpair | Pathway | Tissue | Disease Stage |
| Page: 1 |
Top |
Single-cell gene regulatory network inference analysis |
| Find out the significant the regulons (TFs) and the target genes of each regulon across cell types for different disease states |
| TF | Cell Type | Tissue | Disease Stage | Target Gene | RSS | Regulon Activity |
| ∗The dot plots of a searched regulon are shown for all cell subpopulations in each disease state of each tissue based on the regulon specific score inferred using pySCENIC and by calculating the average expression. |
| Page: 1 |
Top |
Somatic mutation of malignant transformation related genes |
| Annotation of somatic variants for genes involved in malignant transformation |
| Hugo Symbol | Variant Class | Variant Classification | dbSNP RS | HGVSc | HGVSp | HGVSp Short | SWISSPROT | BIOTYPE | SIFT | PolyPhen | Tumor Sample Barcode | Tissue | Histology | Sex | Age | Stage | Therapy Types | Drugs | Outcome |
| MRPL18 | SNV | Missense_Mutation | c.177N>T | p.Leu59Phe | p.L59F | Q9H0U6 | protein_coding | deleterious(0.02) | possibly_damaging(0.904) | TCGA-BH-A0BZ-01 | Breast | breast invasive carcinoma | Female | <65 | III/IV | Chemotherapy | doxorubicin | CR | |
| MRPL18 | SNV | Missense_Mutation | rs374235021 | c.389G>A | p.Arg130Gln | p.R130Q | Q9H0U6 | protein_coding | tolerated(0.05) | possibly_damaging(0.616) | TCGA-BH-A0RX-01 | Breast | breast invasive carcinoma | Female | <65 | I/II | Chemotherapy | fluorouracil | SD |
| MRPL18 | SNV | Missense_Mutation | rs746544871 | c.245N>A | p.Arg82Gln | p.R82Q | Q9H0U6 | protein_coding | tolerated(0.19) | possibly_damaging(0.563) | TCGA-E2-A10C-01 | Breast | breast invasive carcinoma | Female | <65 | I/II | Chemotherapy | cytoxan | SD |
| MRPL18 | SNV | Missense_Mutation | novel | c.25N>C | p.Gly9Arg | p.G9R | Q9H0U6 | protein_coding | tolerated_low_confidence(0.5) | benign(0) | TCGA-E2-A1LH-01 | Breast | breast invasive carcinoma | Female | <65 | I/II | Chemotherapy | adriamycin | SD |
| MRPL18 | SNV | Missense_Mutation | novel | c.187A>G | p.Arg63Gly | p.R63G | Q9H0U6 | protein_coding | tolerated(0.06) | possibly_damaging(0.598) | TCGA-EW-A3U0-01 | Breast | breast invasive carcinoma | Female | <65 | III/IV | Chemotherapy | cisplatin | CR |
| MRPL18 | SNV | Missense_Mutation | rs762288486 | c.35C>T | p.Ser12Leu | p.S12L | Q9H0U6 | protein_coding | tolerated(0.21) | benign(0) | TCGA-GM-A4E0-01 | Breast | breast invasive carcinoma | Female | >=65 | III/IV | Chemotherapy | xeloda | CR |
| MRPL18 | SNV | Missense_Mutation | c.499G>A | p.Glu167Lys | p.E167K | Q9H0U6 | protein_coding | deleterious(0) | probably_damaging(0.998) | TCGA-DR-A0ZM-01 | Cervix | cervical & endocervical cancer | Female | <65 | III/IV | Unspecific | Cisplatin | SD | |
| MRPL18 | SNV | Missense_Mutation | c.95N>T | p.Ala32Val | p.A32V | Q9H0U6 | protein_coding | tolerated(0.73) | benign(0) | TCGA-A6-5661-01 | Colorectum | colon adenocarcinoma | Female | >=65 | I/II | Unknown | Unknown | SD | |
| MRPL18 | SNV | Missense_Mutation | c.161N>A | p.Arg54Gln | p.R54Q | Q9H0U6 | protein_coding | deleterious(0) | possibly_damaging(0.703) | TCGA-AA-3811-01 | Colorectum | colon adenocarcinoma | Female | >=65 | III/IV | Unknown | Unknown | PD | |
| MRPL18 | SNV | Missense_Mutation | c.398N>T | p.Ala133Val | p.A133V | Q9H0U6 | protein_coding | deleterious(0) | possibly_damaging(0.732) | TCGA-A5-A0GI-01 | Endometrium | uterine corpus endometrioid carcinoma | Female | <65 | I/II | Unknown | Unknown | SD |
| Page: 1 2 3 |
Top |
Related drugs of malignant transformation related genes |
| Identification of chemicals and drugs interact with genes involved in malignant transfromation |
| (DGIdb 4.0) |
| Entrez ID | Symbol | Category | Interaction Types | Drug Claim Name | Drug Name | PMIDs |
| Page: 1 |

Copyright 2023-Present -The University of Texas Health Science Center at Houston |