
|
|||||
|
 | |
| |
| |
| |
| |
| |
|
Gene: MRPL17 |
Gene summary for MRPL17 |
| Gene information | Species | Human | Gene symbol | MRPL17 | Gene ID | 63875 |
| Gene name | mitochondrial ribosomal protein L17 | |
| Gene Alias | L17mt | |
| Cytomap | 11p15.4 | |
| Gene Type | protein-coding | GO ID | GO:0006412 | UniProtAcc | Q9NRX2 |
Top |
Malignant transformation analysis |
| Identification of the aberrant gene expression in precancerous and cancerous lesions by comparing the gene expression of stem-like cells in diseased tissues with normal stem cells |
| Entrez ID | Symbol | Replicates | Species | Organ | Tissue | Adj P-value | Log2FC | Malignancy |
| 63875 | MRPL17 | HTA11_3410_2000001011 | Human | Colorectum | AD | 7.98e-03 | 7.49e-02 | 0.0155 |
| 63875 | MRPL17 | HTA11_2487_2000001011 | Human | Colorectum | SER | 3.37e-03 | 1.49e-01 | -0.1808 |
| 63875 | MRPL17 | HTA11_1938_2000001011 | Human | Colorectum | AD | 1.83e-13 | 3.49e-01 | -0.0811 |
| 63875 | MRPL17 | HTA11_347_2000001011 | Human | Colorectum | AD | 2.18e-10 | 2.13e-01 | -0.1954 |
| 63875 | MRPL17 | HTA11_411_2000001011 | Human | Colorectum | SER | 4.01e-04 | 2.71e-01 | -0.2602 |
| 63875 | MRPL17 | HTA11_2112_2000001011 | Human | Colorectum | SER | 1.90e-02 | 2.84e-01 | -0.2196 |
| 63875 | MRPL17 | HTA11_3361_2000001011 | Human | Colorectum | AD | 3.26e-04 | 2.02e-01 | -0.1207 |
| 63875 | MRPL17 | HTA11_83_2000001011 | Human | Colorectum | SER | 4.23e-03 | 1.68e-01 | -0.1526 |
| 63875 | MRPL17 | HTA11_696_2000001011 | Human | Colorectum | AD | 1.70e-04 | 2.50e-01 | -0.1464 |
| 63875 | MRPL17 | HTA11_866_2000001011 | Human | Colorectum | AD | 1.26e-02 | 1.46e-01 | -0.1001 |
| 63875 | MRPL17 | HTA11_1391_2000001011 | Human | Colorectum | AD | 2.12e-21 | 5.36e-01 | -0.059 |
| 63875 | MRPL17 | HTA11_2992_2000001011 | Human | Colorectum | SER | 1.09e-02 | 1.92e-01 | -0.1706 |
| 63875 | MRPL17 | HTA11_5216_2000001011 | Human | Colorectum | SER | 3.34e-04 | 2.29e-01 | -0.1462 |
| 63875 | MRPL17 | HTA11_546_2000001011 | Human | Colorectum | AD | 2.65e-04 | 1.61e-01 | -0.0842 |
| 63875 | MRPL17 | HTA11_866_3004761011 | Human | Colorectum | AD | 1.51e-20 | 4.12e-01 | 0.096 |
| 63875 | MRPL17 | HTA11_4255_2000001011 | Human | Colorectum | SER | 3.34e-04 | 2.29e-01 | 0.0446 |
| 63875 | MRPL17 | HTA11_8622_2000001021 | Human | Colorectum | SER | 6.14e-04 | 2.45e-01 | 0.0528 |
| 63875 | MRPL17 | HTA11_7663_2000001011 | Human | Colorectum | SER | 6.81e-04 | 2.35e-01 | 0.0131 |
| 63875 | MRPL17 | HTA11_10623_2000001011 | Human | Colorectum | AD | 8.98e-03 | 1.45e-01 | -0.0177 |
| 63875 | MRPL17 | HTA11_6801_2000001011 | Human | Colorectum | SER | 1.85e-04 | 3.07e-01 | 0.0171 |
| Page: 1 2 3 4 5 6 7 8 |
| Tissue | Expression Dynamics | Abbreviation |
| Colorectum (GSE201348) |  | FAP: Familial adenomatous polyposis |
| CRC: Colorectal cancer | ||
| Colorectum (HTA11) |  | AD: Adenomas |
| SER: Sessile serrated lesions | ||
| MSI-H: Microsatellite-high colorectal cancer | ||
| MSS: Microsatellite stable colorectal cancer | ||
| Esophagus | 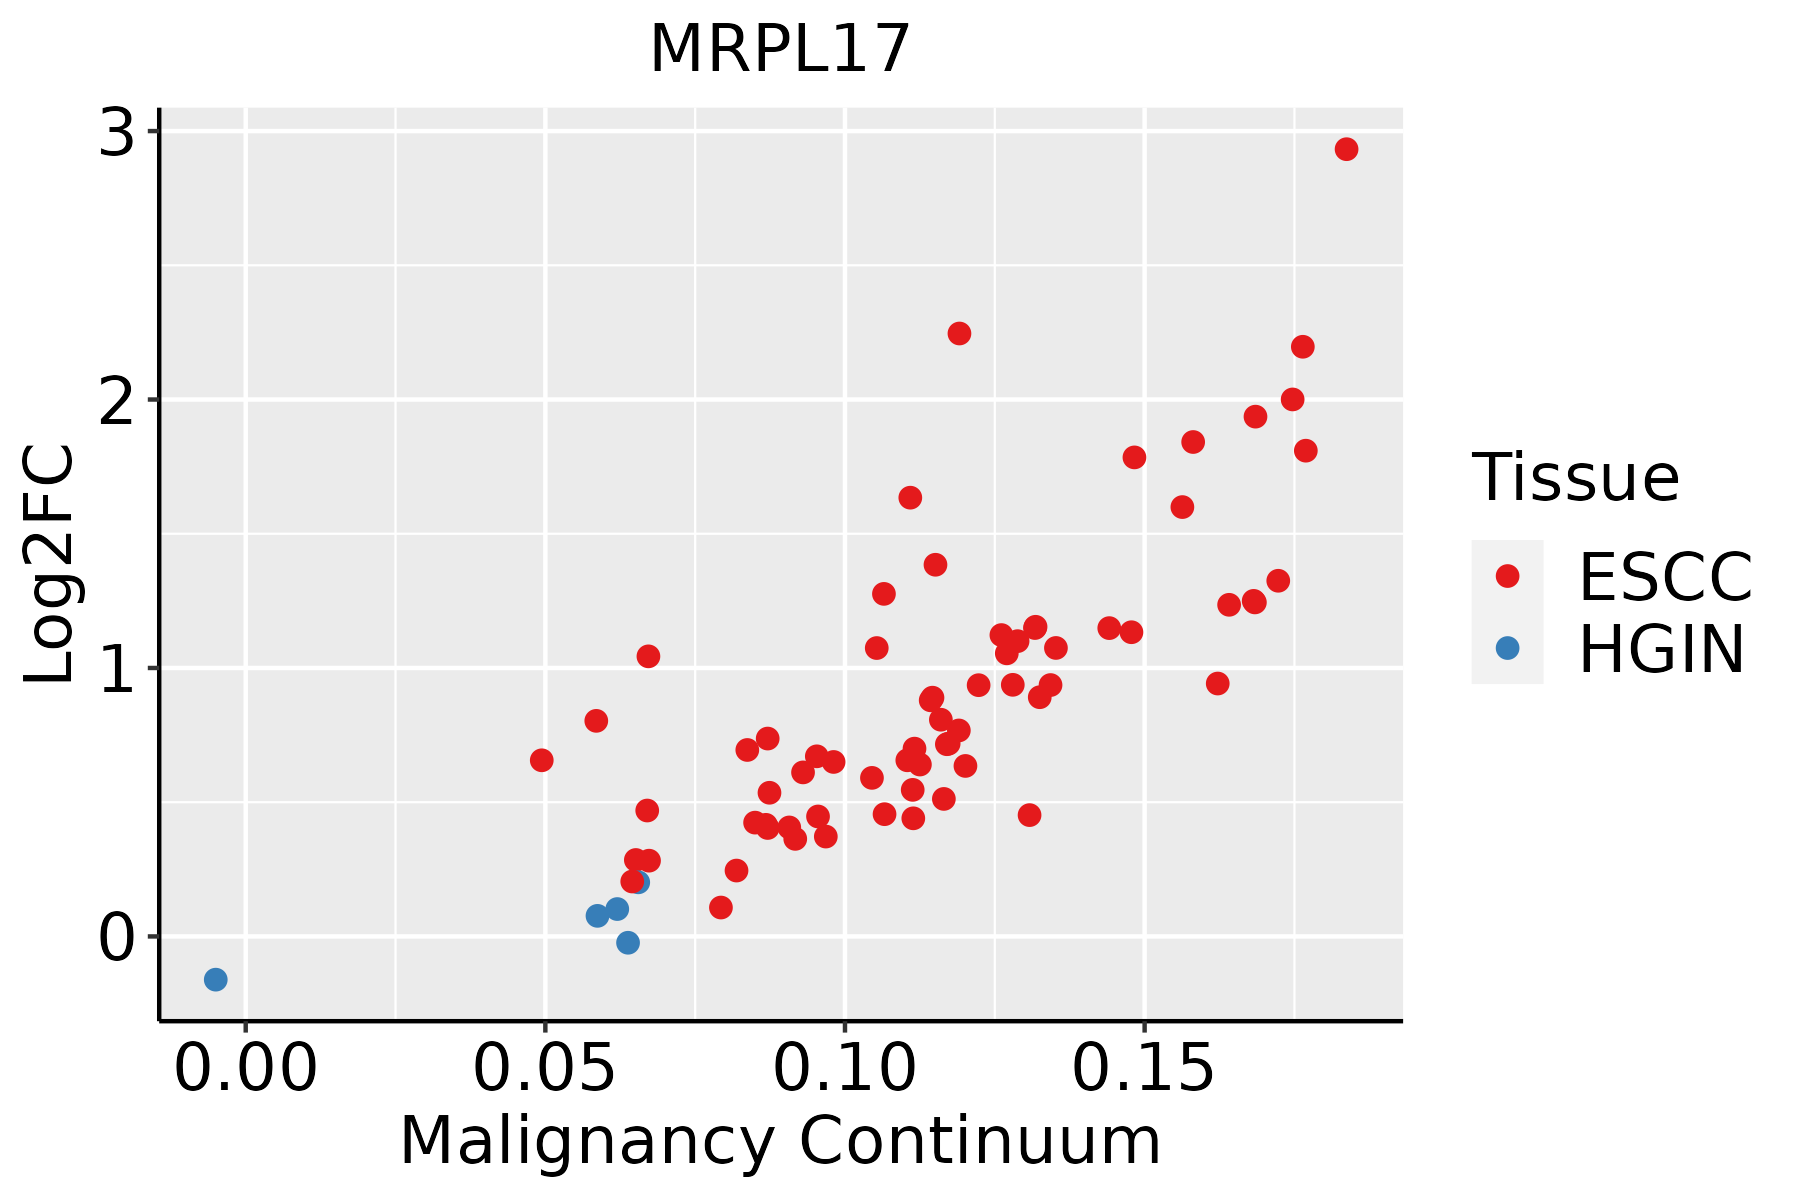 | ESCC: Esophageal squamous cell carcinoma |
| HGIN: High-grade intraepithelial neoplasias | ||
| LGIN: Low-grade intraepithelial neoplasias | ||
| Liver | 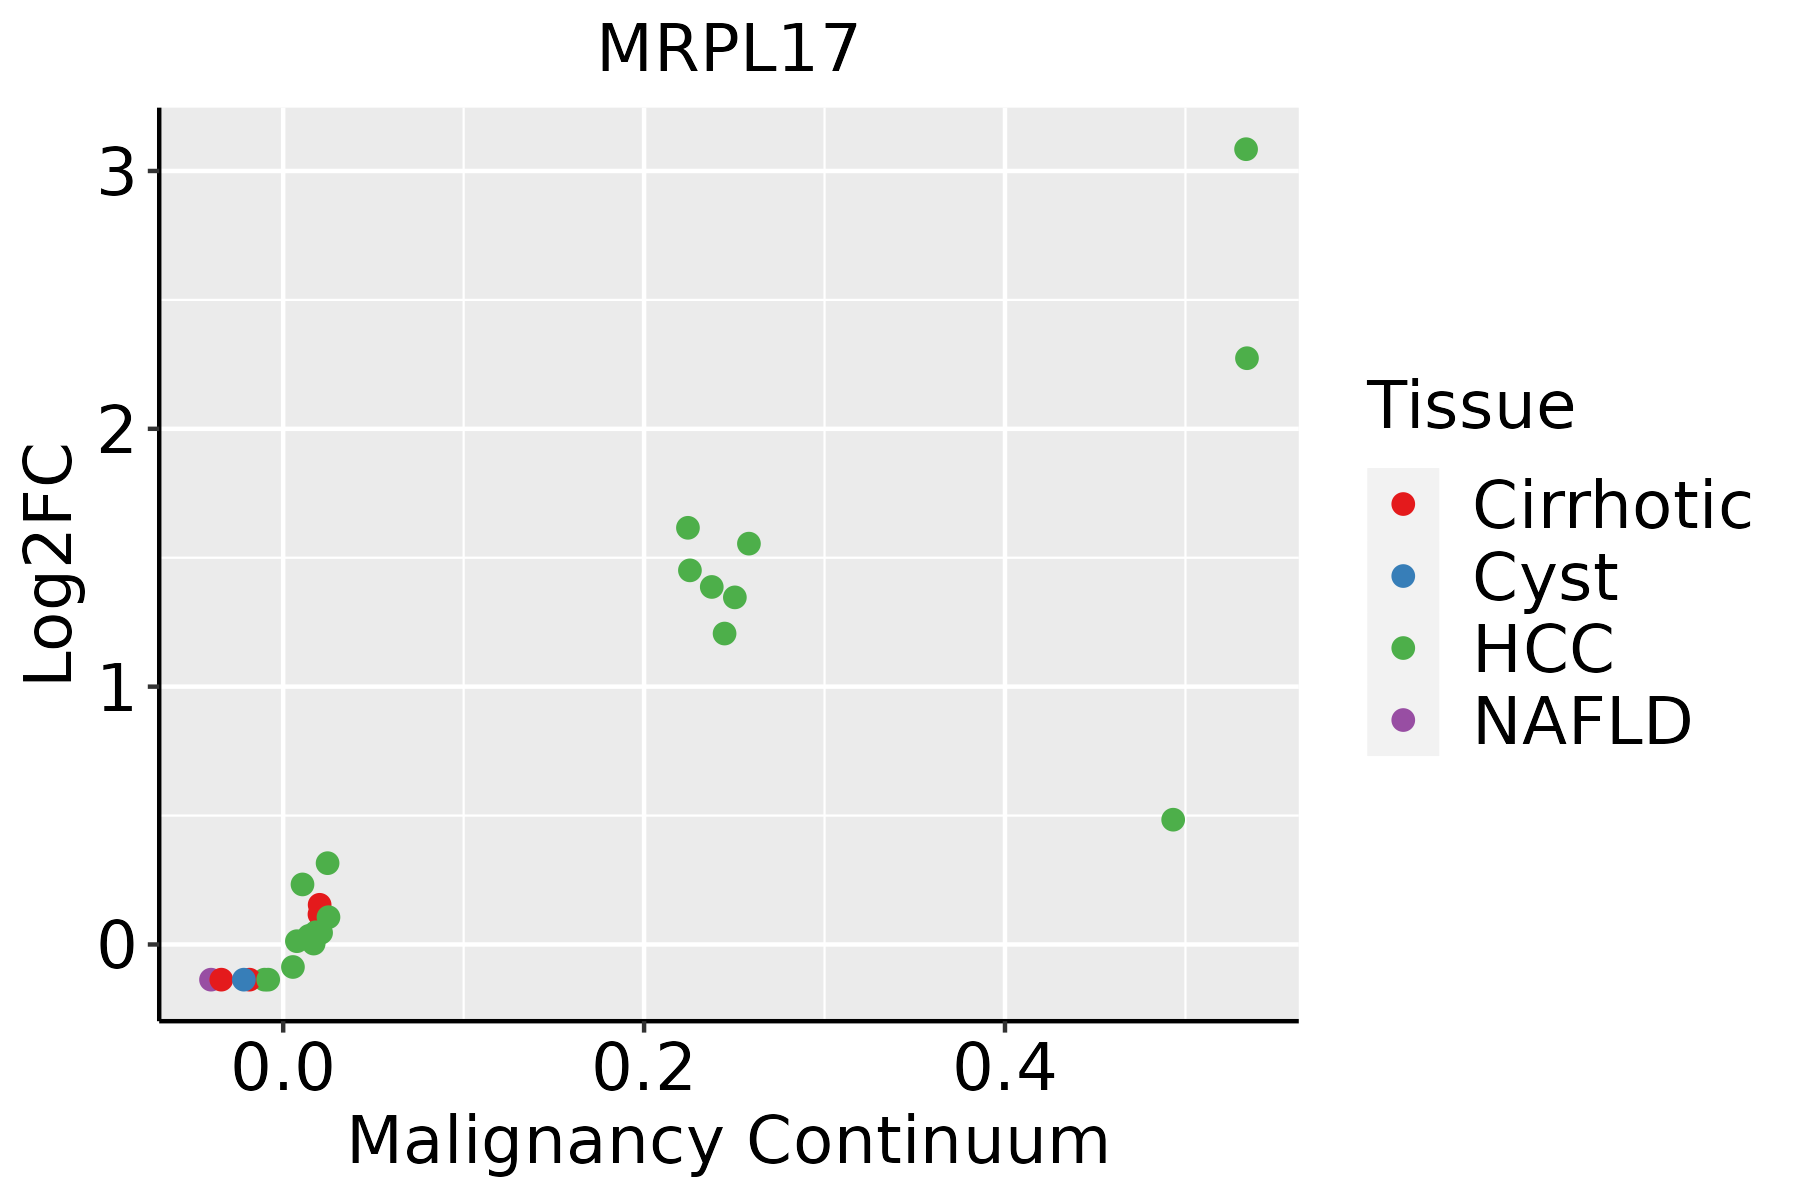 | HCC: Hepatocellular carcinoma |
| NAFLD: Non-alcoholic fatty liver disease | ||
| Oral Cavity |  | EOLP: Erosive Oral lichen planus |
| LP: leukoplakia | ||
| NEOLP: Non-erosive oral lichen planus | ||
| OSCC: Oral squamous cell carcinoma | ||
| Skin | 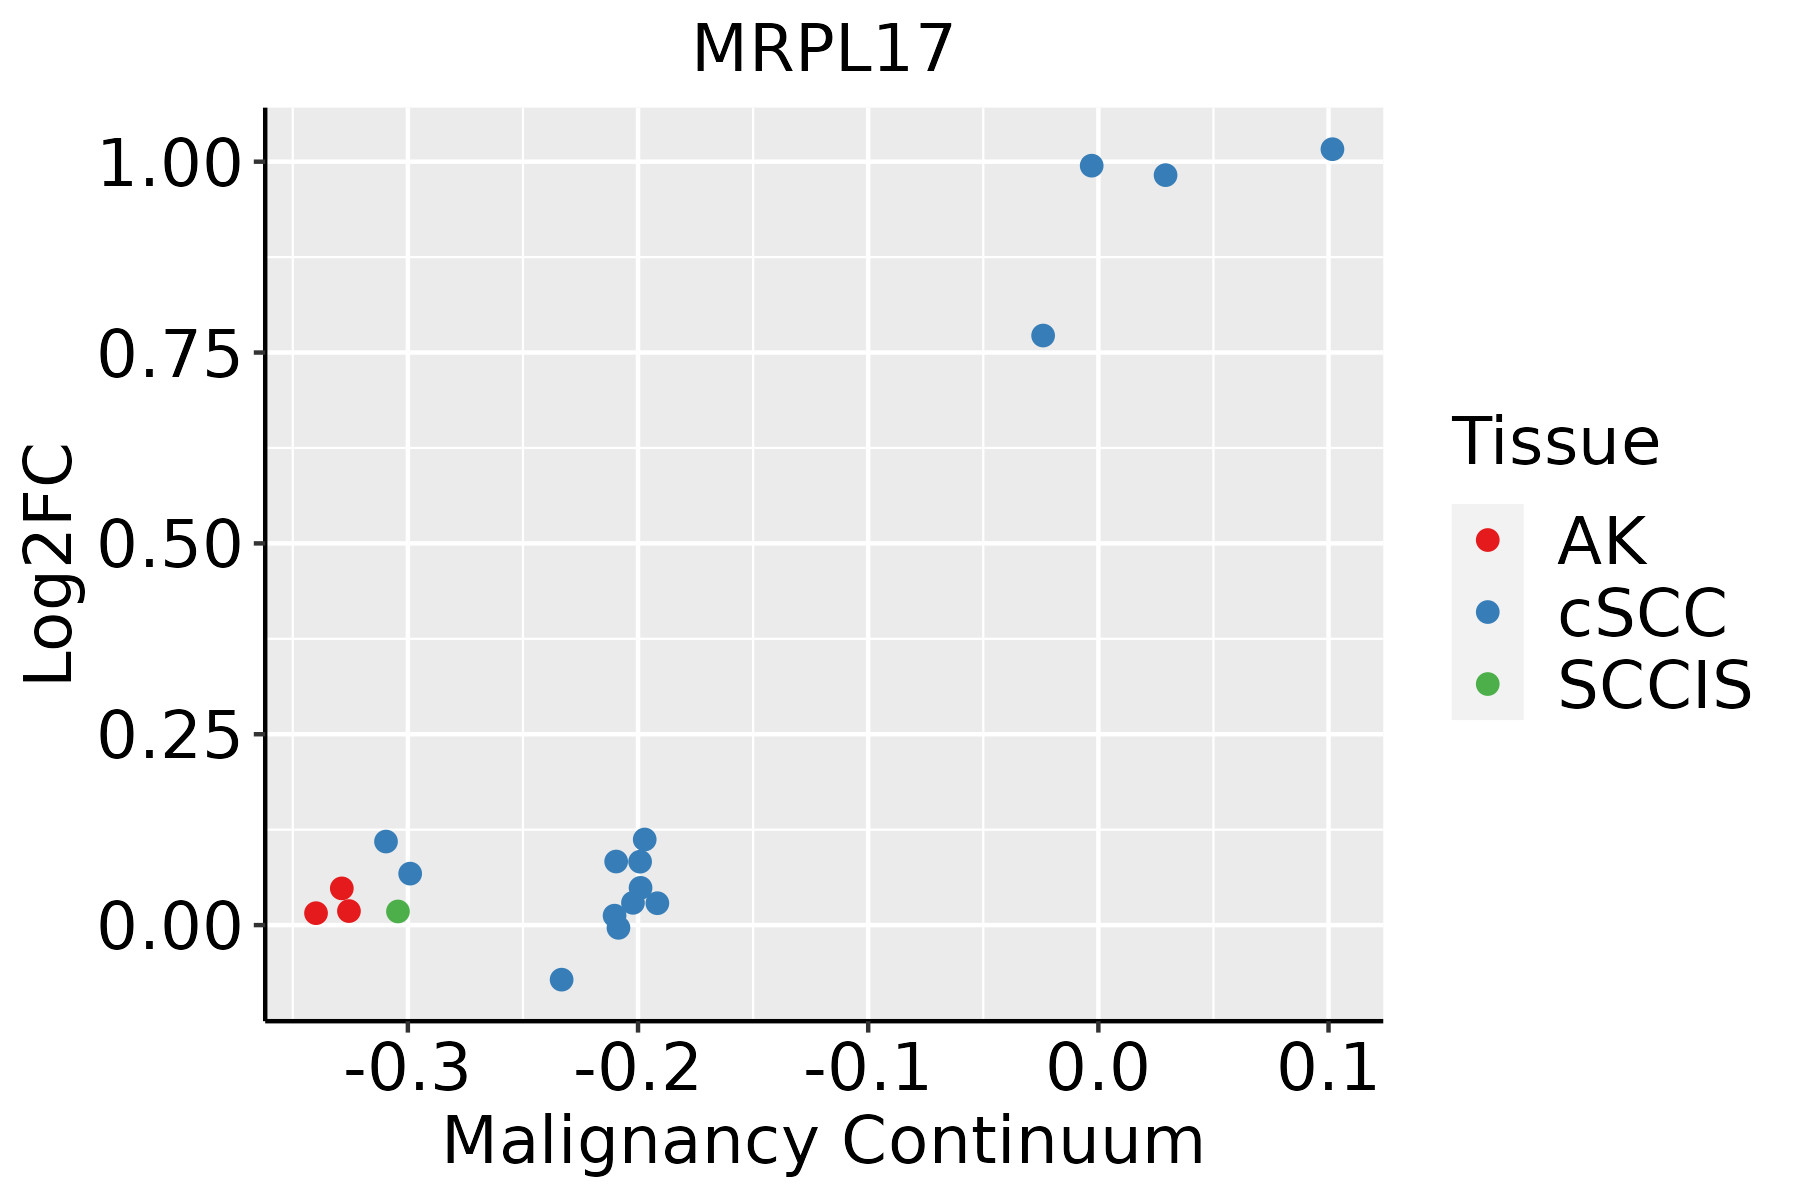 | AK: Actinic keratosis |
| cSCC: Cutaneous squamous cell carcinoma | ||
| SCCIS:squamous cell carcinoma in situ | ||
| Thyroid | 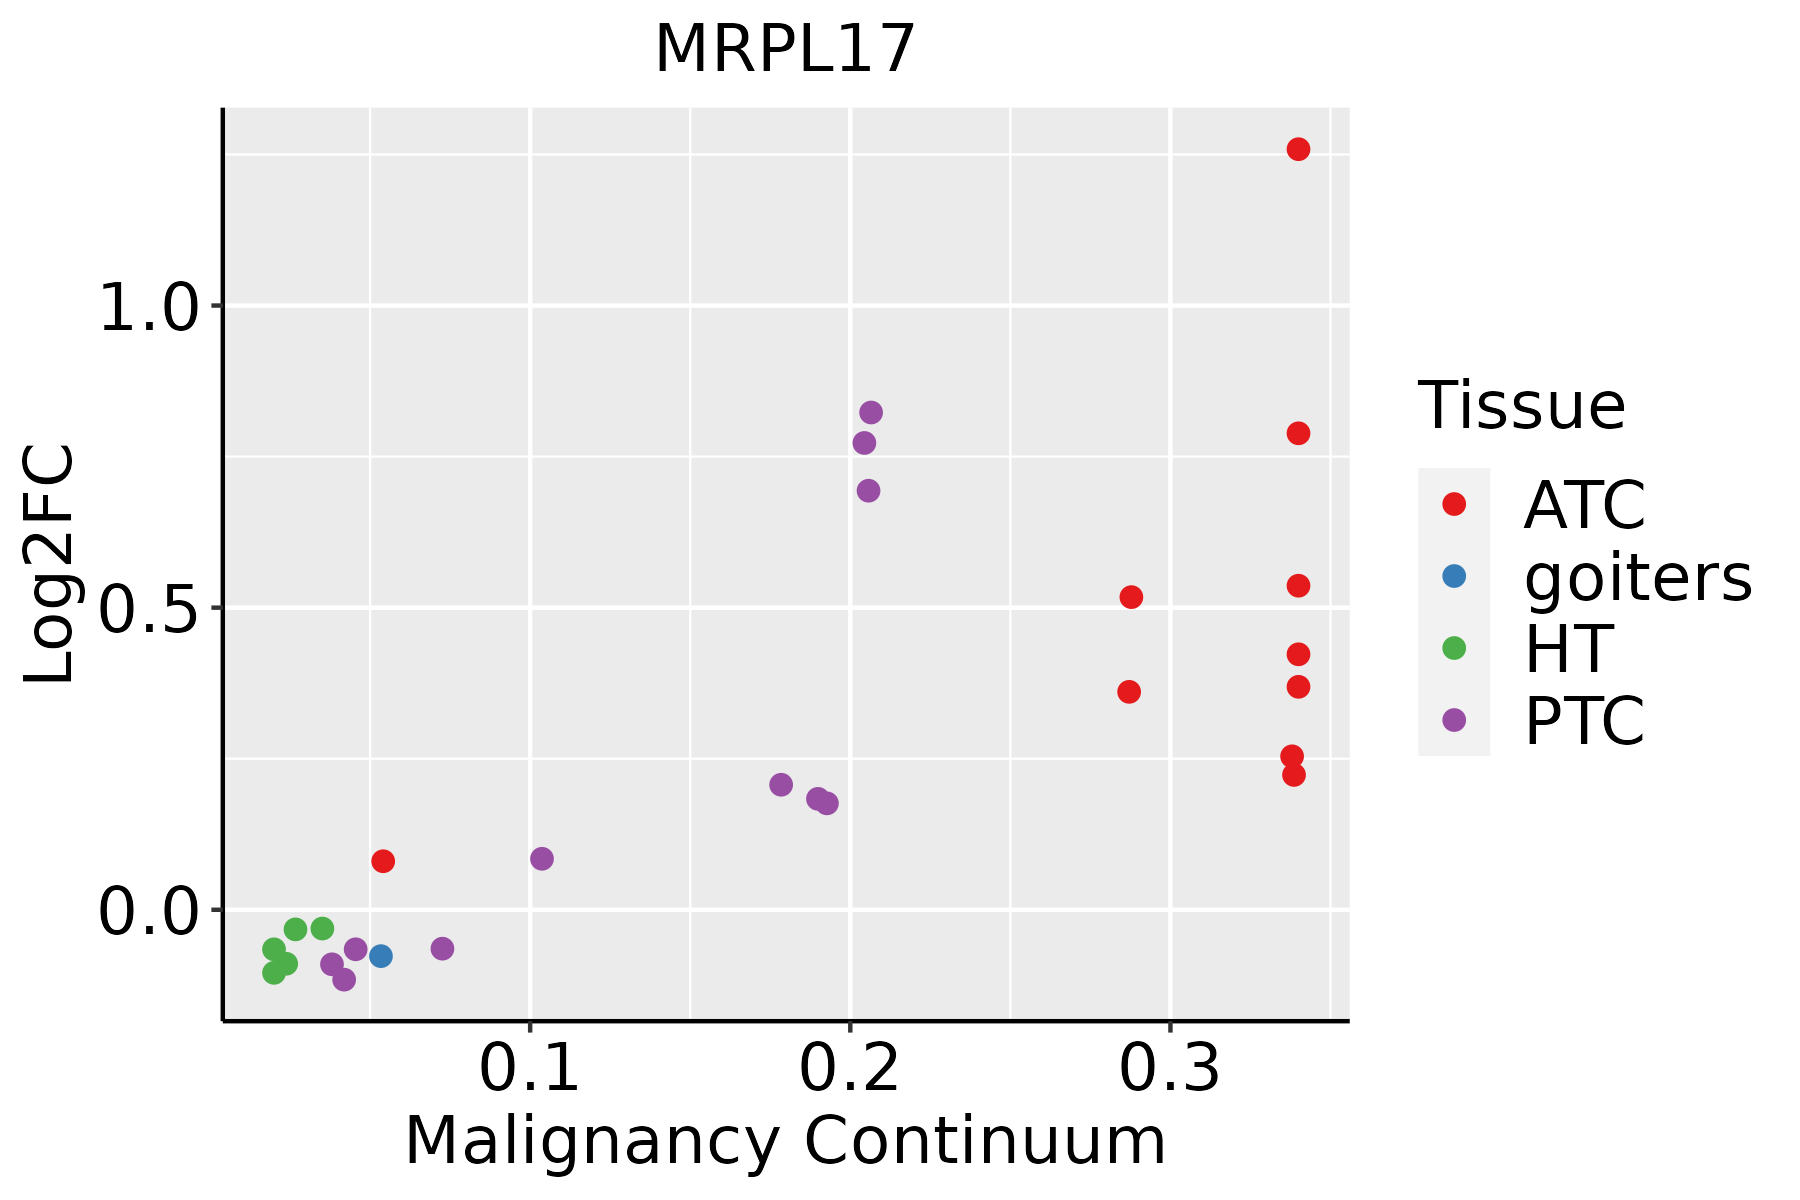 | ATC: Anaplastic thyroid cancer |
| HT: Hashimoto's thyroiditis | ||
| PTC: Papillary thyroid cancer |
| ∗log2FC in expression of this searched gene in stem-like cells from each diseased tissue sample relative to stem-like cells in normal samples in each tissue plotted against the malignancy continuum. Samples are colored based on if they are from different disease stage. |
Top |
Malignant transformation related pathway analysis |
| Find out the enriched GO biological processes and KEGG pathways involved in transition from healthy to precancer to cancer |
| Tissue | Disease Stage | Enriched GO biological Processes |
| Colorectum | AD |  |
| Colorectum | SER |  |
| Colorectum | MSS |  |
| Colorectum | MSI-H |  |
| Colorectum | FAP |  |
| ∗Top 15 enriched GO BP terms are showed in the bar plot of each disease state in each tissue. Each row represents a significant GO biological process which is colored according to the -log10(p.adjust). |
| Page: 1 2 3 4 5 6 7 8 9 |
| GO ID | Tissue | Disease Stage | Description | Gene Ratio | Bg Ratio | pvalue | p.adjust | Count |
| Page: 1 |
| Pathway ID | Tissue | Disease Stage | Description | Gene Ratio | Bg Ratio | pvalue | p.adjust | qvalue | Count |
| hsa03010 | Colorectum | AD | Ribosome | 96/2092 | 167/8465 | 8.28e-20 | 5.54e-18 | 3.54e-18 | 96 |
| hsa030101 | Colorectum | AD | Ribosome | 96/2092 | 167/8465 | 8.28e-20 | 5.54e-18 | 3.54e-18 | 96 |
| hsa030102 | Colorectum | SER | Ribosome | 92/1580 | 167/8465 | 2.21e-26 | 3.66e-24 | 2.66e-24 | 92 |
| hsa030103 | Colorectum | SER | Ribosome | 92/1580 | 167/8465 | 2.21e-26 | 3.66e-24 | 2.66e-24 | 92 |
| hsa030104 | Colorectum | MSS | Ribosome | 96/1875 | 167/8465 | 1.82e-23 | 2.03e-21 | 1.24e-21 | 96 |
| hsa030105 | Colorectum | MSS | Ribosome | 96/1875 | 167/8465 | 1.82e-23 | 2.03e-21 | 1.24e-21 | 96 |
| hsa030106 | Colorectum | MSI-H | Ribosome | 87/797 | 167/8465 | 5.55e-46 | 1.80e-43 | 1.51e-43 | 87 |
| hsa030107 | Colorectum | MSI-H | Ribosome | 87/797 | 167/8465 | 5.55e-46 | 1.80e-43 | 1.51e-43 | 87 |
| hsa03010211 | Esophagus | ESCC | Ribosome | 129/4205 | 167/8465 | 1.43e-13 | 3.43e-12 | 1.75e-12 | 129 |
| hsa03010310 | Esophagus | ESCC | Ribosome | 129/4205 | 167/8465 | 1.43e-13 | 3.43e-12 | 1.75e-12 | 129 |
| hsa0301022 | Liver | Cirrhotic | Ribosome | 127/2530 | 167/8465 | 2.12e-35 | 7.06e-33 | 4.35e-33 | 127 |
| hsa0301032 | Liver | Cirrhotic | Ribosome | 127/2530 | 167/8465 | 2.12e-35 | 7.06e-33 | 4.35e-33 | 127 |
| hsa0301042 | Liver | HCC | Ribosome | 128/4020 | 167/8465 | 7.32e-15 | 2.23e-13 | 1.24e-13 | 128 |
| hsa0301052 | Liver | HCC | Ribosome | 128/4020 | 167/8465 | 7.32e-15 | 2.23e-13 | 1.24e-13 | 128 |
| hsa0301030 | Oral cavity | OSCC | Ribosome | 128/3704 | 167/8465 | 2.42e-18 | 1.62e-16 | 8.25e-17 | 128 |
| hsa03010114 | Oral cavity | OSCC | Ribosome | 128/3704 | 167/8465 | 2.42e-18 | 1.62e-16 | 8.25e-17 | 128 |
| hsa03010210 | Oral cavity | LP | Ribosome | 127/2418 | 167/8465 | 1.22e-37 | 4.05e-35 | 2.61e-35 | 127 |
| hsa0301038 | Oral cavity | LP | Ribosome | 127/2418 | 167/8465 | 1.22e-37 | 4.05e-35 | 2.61e-35 | 127 |
| Page: 1 |
Top |
Cell-cell communication analysis |
| Identification of potential cell-cell interactions between two cell types and their ligand-receptor pairs for different disease states |
| Ligand | Receptor | LRpair | Pathway | Tissue | Disease Stage |
| Page: 1 |
Top |
Single-cell gene regulatory network inference analysis |
| Find out the significant the regulons (TFs) and the target genes of each regulon across cell types for different disease states |
| TF | Cell Type | Tissue | Disease Stage | Target Gene | RSS | Regulon Activity |
| ∗The dot plots of a searched regulon are shown for all cell subpopulations in each disease state of each tissue based on the regulon specific score inferred using pySCENIC and by calculating the average expression. |
| Page: 1 |
Top |
Somatic mutation of malignant transformation related genes |
| Annotation of somatic variants for genes involved in malignant transformation |
| Hugo Symbol | Variant Class | Variant Classification | dbSNP RS | HGVSc | HGVSp | HGVSp Short | SWISSPROT | BIOTYPE | SIFT | PolyPhen | Tumor Sample Barcode | Tissue | Histology | Sex | Age | Stage | Therapy Types | Drugs | Outcome |
| MRPL17 | SNV | Missense_Mutation | novel | c.49C>A | p.Arg17Ser | p.R17S | Q9NRX2 | protein_coding | deleterious(0.03) | benign(0.366) | TCGA-AC-A2BM-01 | Breast | breast invasive carcinoma | Female | <65 | I/II | Unknown | Unknown | SD |
| MRPL17 | SNV | Missense_Mutation | rs774823017 | c.138G>T | p.Trp46Cys | p.W46C | Q9NRX2 | protein_coding | deleterious(0.01) | probably_damaging(0.932) | TCGA-AZ-4615-01 | Colorectum | colon adenocarcinoma | Male | >=65 | III/IV | Chemotherapy | xeloda | PD |
| MRPL17 | SNV | Missense_Mutation | c.496N>C | p.Ser166Arg | p.S166R | Q9NRX2 | protein_coding | tolerated(0.29) | benign(0) | TCGA-WS-AB45-01 | Colorectum | colon adenocarcinoma | Female | <65 | I/II | Unknown | Unknown | SD | |
| MRPL17 | SNV | Missense_Mutation | novel | c.457N>T | p.Arg153Trp | p.R153W | Q9NRX2 | protein_coding | deleterious(0.03) | benign(0.001) | TCGA-A5-A0G2-01 | Endometrium | uterine corpus endometrioid carcinoma | Female | <65 | III/IV | Unknown | Unknown | SD |
| MRPL17 | SNV | Missense_Mutation | c.207N>G | p.Asn69Lys | p.N69K | Q9NRX2 | protein_coding | deleterious(0.04) | possibly_damaging(0.738) | TCGA-55-1592-01 | Lung | lung adenocarcinoma | Male | >=65 | I/II | Unknown | Unknown | PD | |
| MRPL17 | SNV | Missense_Mutation | novel | c.220N>T | p.Arg74Cys | p.R74C | Q9NRX2 | protein_coding | deleterious(0) | probably_damaging(0.935) | TCGA-CN-5369-01 | Oral cavity | head & neck squamous cell carcinoma | Female | >=65 | I/II | Unknown | Unknown | SD |
| MRPL17 | SNV | Missense_Mutation | novel | c.40G>A | p.Val14Ile | p.V14I | Q9NRX2 | protein_coding | deleterious(0.04) | benign(0.081) | TCGA-CV-5979-01 | Oral cavity | head & neck squamous cell carcinoma | Male | <65 | I/II | Unknown | Unknown | SD |
| MRPL17 | SNV | Missense_Mutation | novel | c.364G>T | p.Val122Leu | p.V122L | Q9NRX2 | protein_coding | deleterious(0.04) | probably_damaging(0.928) | TCGA-D7-A6EY-01 | Stomach | stomach adenocarcinoma | Female | >=65 | III/IV | Unknown | Unknown | PD |
| MRPL17 | SNV | Missense_Mutation | c.413N>C | p.Arg138Thr | p.R138T | Q9NRX2 | protein_coding | tolerated(0.32) | benign(0.023) | TCGA-HU-8608-01 | Stomach | stomach adenocarcinoma | Male | >=65 | III/IV | Chemotherapy | doxifluridine | PD | |
| MRPL17 | insertion | Frame_Shift_Ins | novel | c.369_370insCAGTTCTTCTCAGA | p.Glu124GlnfsTer27 | p.E124Qfs*27 | Q9NRX2 | protein_coding | TCGA-FY-A4B0-01 | Thyroid | thyroid carcinoma | Male | >=65 | I/II | Hormone Therapy | synthroid | SD |
| Page: 1 |
Top |
Related drugs of malignant transformation related genes |
| Identification of chemicals and drugs interact with genes involved in malignant transfromation |
| (DGIdb 4.0) |
| Entrez ID | Symbol | Category | Interaction Types | Drug Claim Name | Drug Name | PMIDs |
| Page: 1 |

Copyright 2023-Present -The University of Texas Health Science Center at Houston |