
|
|||||
|
 | |
| |
| |
| |
| |
| |
|
Gene: MRPL16 |
Gene summary for MRPL16 |
| Gene information | Species | Human | Gene symbol | MRPL16 | Gene ID | 54948 |
| Gene name | mitochondrial ribosomal protein L16 | |
| Gene Alias | L16mt | |
| Cytomap | 11q12.1 | |
| Gene Type | protein-coding | GO ID | GO:0006412 | UniProtAcc | Q9NX20 |
Top |
Malignant transformation analysis |
| Identification of the aberrant gene expression in precancerous and cancerous lesions by comparing the gene expression of stem-like cells in diseased tissues with normal stem cells |
| Entrez ID | Symbol | Replicates | Species | Organ | Tissue | Adj P-value | Log2FC | Malignancy |
| 54948 | MRPL16 | HTA11_347_2000001011 | Human | Colorectum | AD | 2.68e-02 | 2.47e-01 | -0.1954 |
| 54948 | MRPL16 | HTA11_1391_2000001011 | Human | Colorectum | AD | 2.91e-06 | 4.35e-01 | -0.059 |
| 54948 | MRPL16 | HTA11_546_2000001011 | Human | Colorectum | AD | 2.47e-03 | 2.86e-01 | -0.0842 |
| 54948 | MRPL16 | HTA11_866_3004761011 | Human | Colorectum | AD | 1.63e-03 | 2.66e-01 | 0.096 |
| 54948 | MRPL16 | HTA11_7696_3000711011 | Human | Colorectum | AD | 9.67e-03 | 2.30e-01 | 0.0674 |
| 54948 | MRPL16 | HTA11_99999970781_79442 | Human | Colorectum | MSS | 3.60e-05 | 3.61e-01 | 0.294 |
| 54948 | MRPL16 | HTA11_99999971662_82457 | Human | Colorectum | MSS | 3.70e-13 | 5.16e-01 | 0.3859 |
| 54948 | MRPL16 | LZE2T | Human | Esophagus | ESCC | 3.89e-03 | 4.98e-01 | 0.082 |
| 54948 | MRPL16 | LZE4T | Human | Esophagus | ESCC | 7.25e-15 | 2.88e-01 | 0.0811 |
| 54948 | MRPL16 | LZE7T | Human | Esophagus | ESCC | 5.71e-11 | 6.76e-01 | 0.0667 |
| 54948 | MRPL16 | LZE8T | Human | Esophagus | ESCC | 5.06e-08 | 3.52e-01 | 0.067 |
| 54948 | MRPL16 | LZE20T | Human | Esophagus | ESCC | 1.16e-03 | 1.71e-01 | 0.0662 |
| 54948 | MRPL16 | LZE22T | Human | Esophagus | ESCC | 1.68e-05 | 4.52e-01 | 0.068 |
| 54948 | MRPL16 | LZE24T | Human | Esophagus | ESCC | 1.85e-18 | 5.74e-01 | 0.0596 |
| 54948 | MRPL16 | LZE6T | Human | Esophagus | ESCC | 1.90e-15 | 8.53e-01 | 0.0845 |
| 54948 | MRPL16 | P1T-E | Human | Esophagus | ESCC | 3.89e-09 | 2.88e-01 | 0.0875 |
| 54948 | MRPL16 | P2T-E | Human | Esophagus | ESCC | 2.77e-38 | 6.36e-01 | 0.1177 |
| 54948 | MRPL16 | P4T-E | Human | Esophagus | ESCC | 4.14e-57 | 1.53e+00 | 0.1323 |
| 54948 | MRPL16 | P5T-E | Human | Esophagus | ESCC | 1.75e-38 | 7.53e-01 | 0.1327 |
| 54948 | MRPL16 | P8T-E | Human | Esophagus | ESCC | 4.80e-48 | 9.14e-01 | 0.0889 |
| Page: 1 2 3 4 5 6 |
| Tissue | Expression Dynamics | Abbreviation |
| Colorectum (GSE201348) |  | FAP: Familial adenomatous polyposis |
| CRC: Colorectal cancer | ||
| Colorectum (HTA11) |  | AD: Adenomas |
| SER: Sessile serrated lesions | ||
| MSI-H: Microsatellite-high colorectal cancer | ||
| MSS: Microsatellite stable colorectal cancer | ||
| Esophagus | 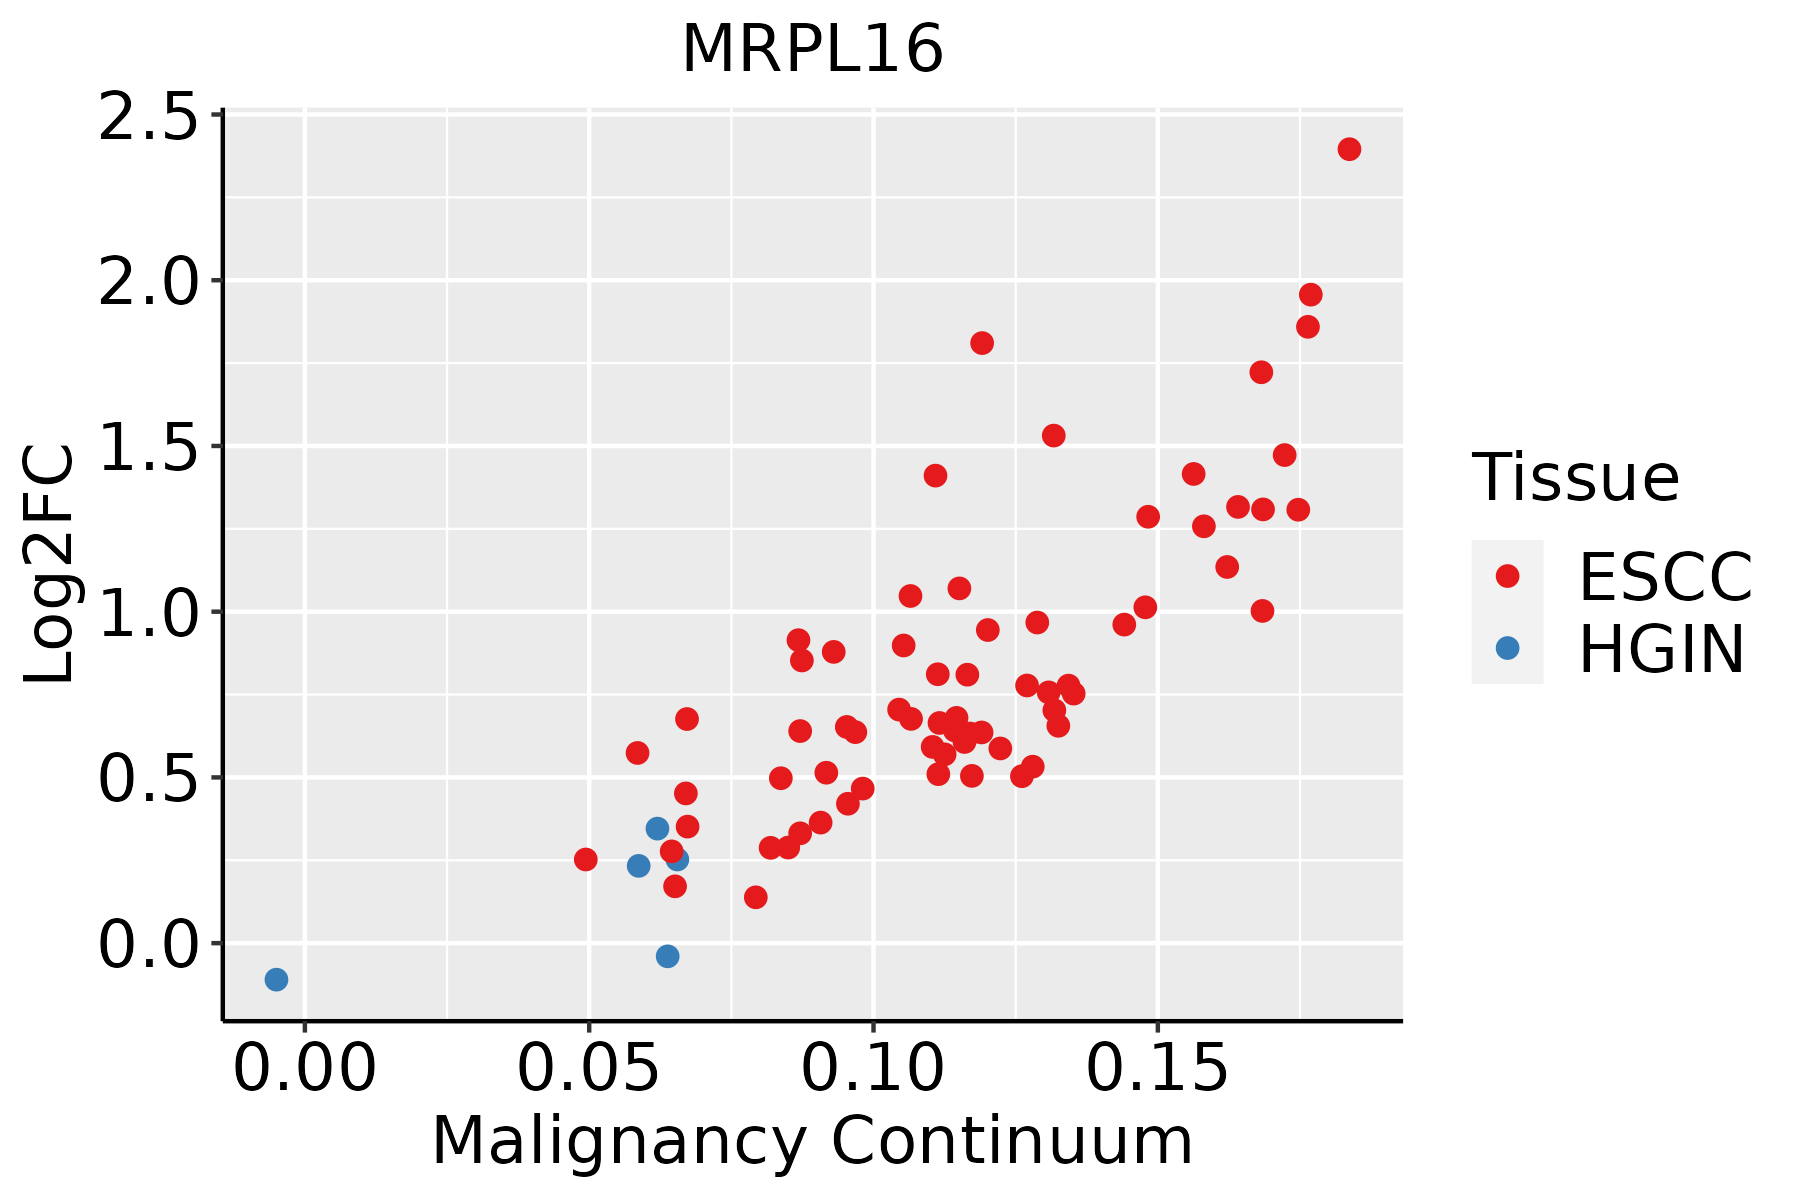 | ESCC: Esophageal squamous cell carcinoma |
| HGIN: High-grade intraepithelial neoplasias | ||
| LGIN: Low-grade intraepithelial neoplasias | ||
| Liver | 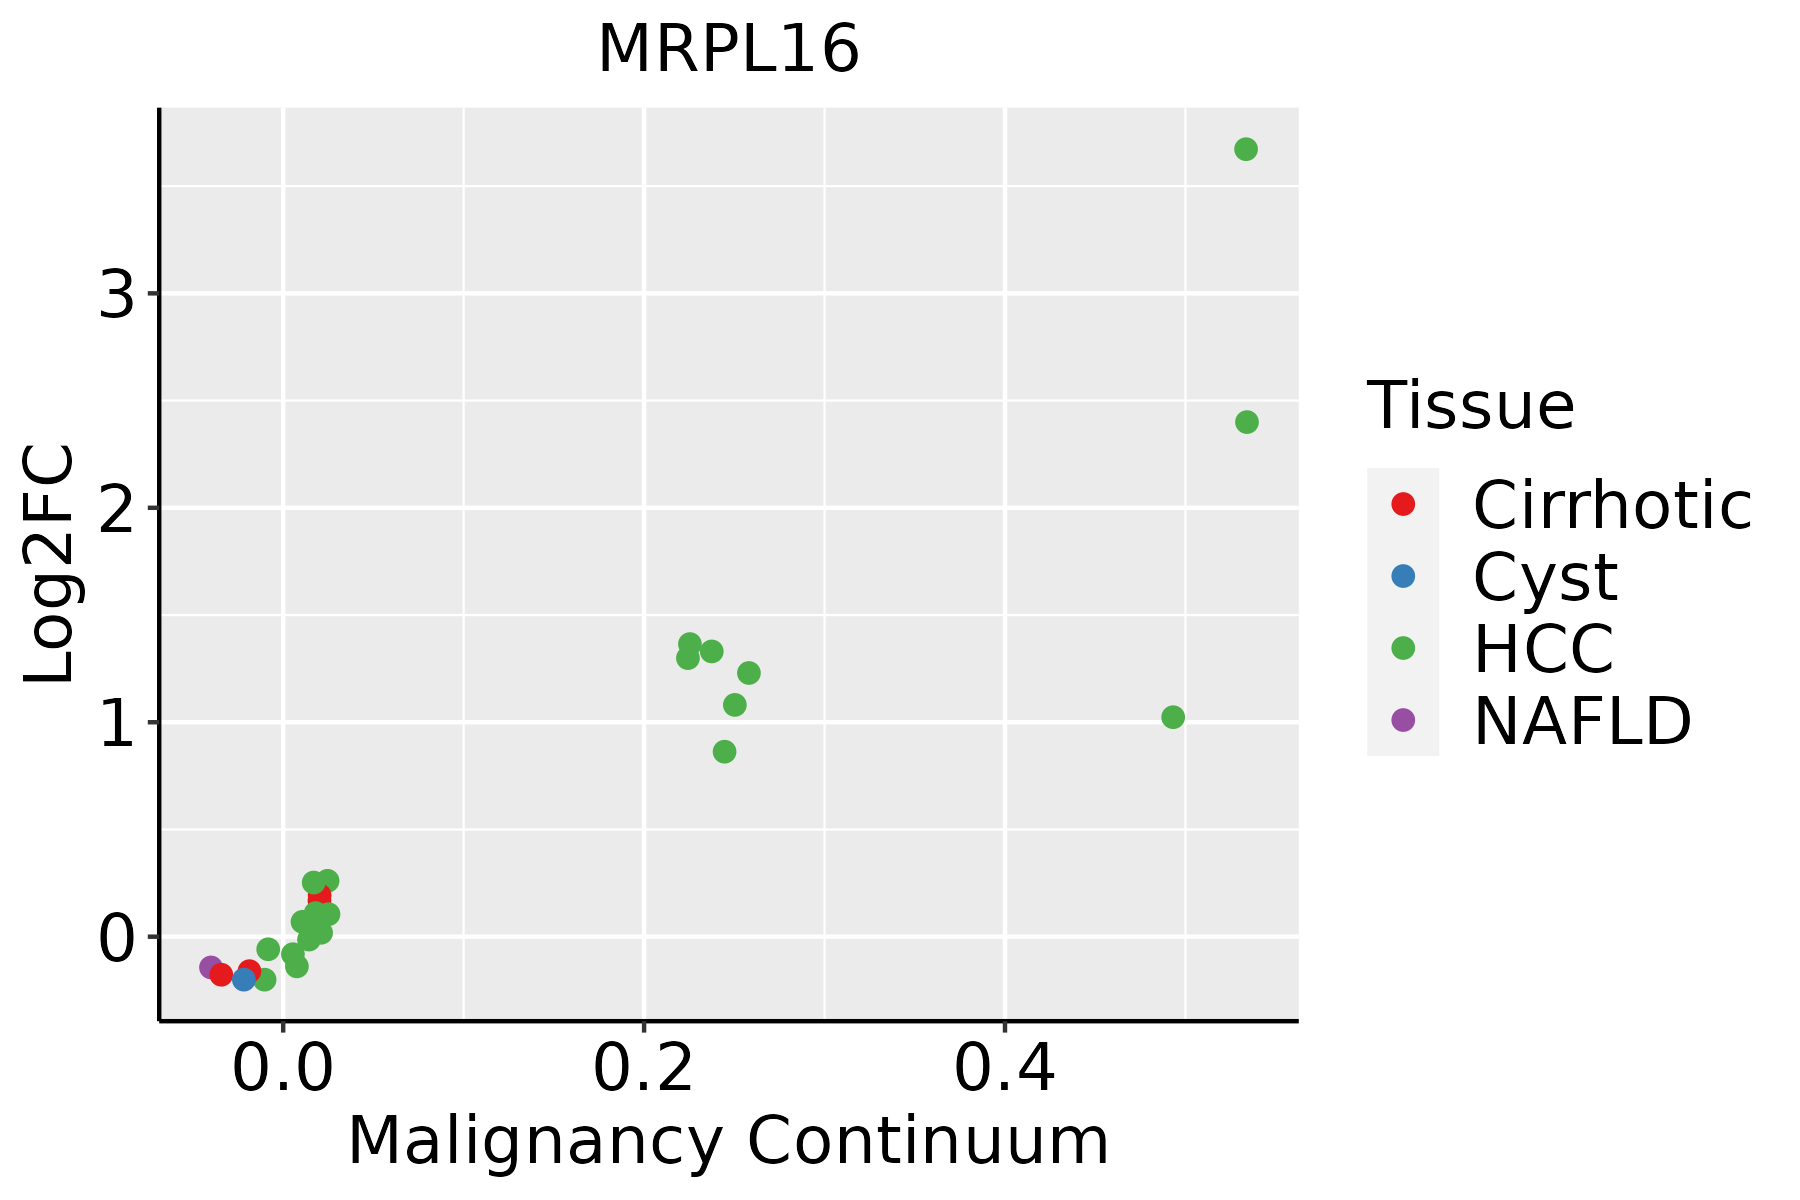 | HCC: Hepatocellular carcinoma |
| NAFLD: Non-alcoholic fatty liver disease | ||
| Oral Cavity |  | EOLP: Erosive Oral lichen planus |
| LP: leukoplakia | ||
| NEOLP: Non-erosive oral lichen planus | ||
| OSCC: Oral squamous cell carcinoma | ||
| Skin |  | AK: Actinic keratosis |
| cSCC: Cutaneous squamous cell carcinoma | ||
| SCCIS:squamous cell carcinoma in situ |
| ∗log2FC in expression of this searched gene in stem-like cells from each diseased tissue sample relative to stem-like cells in normal samples in each tissue plotted against the malignancy continuum. Samples are colored based on if they are from different disease stage. |
Top |
Malignant transformation related pathway analysis |
| Find out the enriched GO biological processes and KEGG pathways involved in transition from healthy to precancer to cancer |
| Tissue | Disease Stage | Enriched GO biological Processes |
| Colorectum | AD |  |
| Colorectum | SER |  |
| Colorectum | MSS |  |
| Colorectum | MSI-H |  |
| Colorectum | FAP |  |
| ∗Top 15 enriched GO BP terms are showed in the bar plot of each disease state in each tissue. Each row represents a significant GO biological process which is colored according to the -log10(p.adjust). |
| Page: 1 2 3 4 5 6 7 8 9 |
| GO ID | Tissue | Disease Stage | Description | Gene Ratio | Bg Ratio | pvalue | p.adjust | Count |
| GO:014005313 | Esophagus | ESCC | mitochondrial gene expression | 93/8552 | 108/18723 | 1.96e-18 | 2.03e-16 | 93 |
| GO:003254314 | Esophagus | ESCC | mitochondrial translation | 68/8552 | 76/18723 | 1.02e-15 | 6.86e-14 | 68 |
| GO:0032543 | Liver | Cirrhotic | mitochondrial translation | 40/4634 | 76/18723 | 1.61e-07 | 4.29e-06 | 40 |
| GO:0140053 | Liver | Cirrhotic | mitochondrial gene expression | 49/4634 | 108/18723 | 2.35e-06 | 4.31e-05 | 49 |
| GO:01400531 | Liver | HCC | mitochondrial gene expression | 82/7958 | 108/18723 | 1.49e-12 | 7.20e-11 | 82 |
| GO:00325431 | Liver | HCC | mitochondrial translation | 62/7958 | 76/18723 | 2.95e-12 | 1.34e-10 | 62 |
| GO:01400533 | Oral cavity | OSCC | mitochondrial gene expression | 78/7305 | 108/18723 | 2.37e-12 | 9.86e-11 | 78 |
| GO:00325434 | Oral cavity | OSCC | mitochondrial translation | 59/7305 | 76/18723 | 7.21e-12 | 2.70e-10 | 59 |
| GO:003254313 | Oral cavity | LP | mitochondrial translation | 43/4623 | 76/18723 | 2.85e-09 | 1.26e-07 | 43 |
| GO:014005312 | Oral cavity | LP | mitochondrial gene expression | 53/4623 | 108/18723 | 3.54e-08 | 1.27e-06 | 53 |
| GO:00325436 | Skin | cSCC | mitochondrial translation | 47/4864 | 76/18723 | 4.70e-11 | 2.22e-09 | 47 |
| GO:01400535 | Skin | cSCC | mitochondrial gene expression | 56/4864 | 108/18723 | 8.06e-09 | 2.56e-07 | 56 |
| Page: 1 |
| Pathway ID | Tissue | Disease Stage | Description | Gene Ratio | Bg Ratio | pvalue | p.adjust | qvalue | Count |
| hsa03010 | Colorectum | AD | Ribosome | 96/2092 | 167/8465 | 8.28e-20 | 5.54e-18 | 3.54e-18 | 96 |
| hsa030101 | Colorectum | AD | Ribosome | 96/2092 | 167/8465 | 8.28e-20 | 5.54e-18 | 3.54e-18 | 96 |
| hsa030104 | Colorectum | MSS | Ribosome | 96/1875 | 167/8465 | 1.82e-23 | 2.03e-21 | 1.24e-21 | 96 |
| hsa030105 | Colorectum | MSS | Ribosome | 96/1875 | 167/8465 | 1.82e-23 | 2.03e-21 | 1.24e-21 | 96 |
| hsa03010211 | Esophagus | ESCC | Ribosome | 129/4205 | 167/8465 | 1.43e-13 | 3.43e-12 | 1.75e-12 | 129 |
| hsa03010310 | Esophagus | ESCC | Ribosome | 129/4205 | 167/8465 | 1.43e-13 | 3.43e-12 | 1.75e-12 | 129 |
| hsa0301022 | Liver | Cirrhotic | Ribosome | 127/2530 | 167/8465 | 2.12e-35 | 7.06e-33 | 4.35e-33 | 127 |
| hsa0301032 | Liver | Cirrhotic | Ribosome | 127/2530 | 167/8465 | 2.12e-35 | 7.06e-33 | 4.35e-33 | 127 |
| hsa0301042 | Liver | HCC | Ribosome | 128/4020 | 167/8465 | 7.32e-15 | 2.23e-13 | 1.24e-13 | 128 |
| hsa0301052 | Liver | HCC | Ribosome | 128/4020 | 167/8465 | 7.32e-15 | 2.23e-13 | 1.24e-13 | 128 |
| hsa0301030 | Oral cavity | OSCC | Ribosome | 128/3704 | 167/8465 | 2.42e-18 | 1.62e-16 | 8.25e-17 | 128 |
| hsa03010114 | Oral cavity | OSCC | Ribosome | 128/3704 | 167/8465 | 2.42e-18 | 1.62e-16 | 8.25e-17 | 128 |
| hsa03010210 | Oral cavity | LP | Ribosome | 127/2418 | 167/8465 | 1.22e-37 | 4.05e-35 | 2.61e-35 | 127 |
| hsa0301038 | Oral cavity | LP | Ribosome | 127/2418 | 167/8465 | 1.22e-37 | 4.05e-35 | 2.61e-35 | 127 |
| Page: 1 |
Top |
Cell-cell communication analysis |
| Identification of potential cell-cell interactions between two cell types and their ligand-receptor pairs for different disease states |
| Ligand | Receptor | LRpair | Pathway | Tissue | Disease Stage |
| Page: 1 |
Top |
Single-cell gene regulatory network inference analysis |
| Find out the significant the regulons (TFs) and the target genes of each regulon across cell types for different disease states |
| TF | Cell Type | Tissue | Disease Stage | Target Gene | RSS | Regulon Activity |
| ∗The dot plots of a searched regulon are shown for all cell subpopulations in each disease state of each tissue based on the regulon specific score inferred using pySCENIC and by calculating the average expression. |
| Page: 1 |
Top |
Somatic mutation of malignant transformation related genes |
| Annotation of somatic variants for genes involved in malignant transformation |
| Hugo Symbol | Variant Class | Variant Classification | dbSNP RS | HGVSc | HGVSp | HGVSp Short | SWISSPROT | BIOTYPE | SIFT | PolyPhen | Tumor Sample Barcode | Tissue | Histology | Sex | Age | Stage | Therapy Types | Drugs | Outcome |
| MRPL16 | SNV | Missense_Mutation | novel | c.359N>G | p.Ala120Gly | p.A120G | Q9NX20 | protein_coding | deleterious(0.02) | benign(0.09) | TCGA-EW-A3U0-01 | Breast | breast invasive carcinoma | Female | <65 | III/IV | Chemotherapy | cisplatin | CR |
| MRPL16 | insertion | Nonsense_Mutation | novel | c.39_40insAAAAAGCTTTAATTTGTTAAATTTAAGCCACAATATCGTA | p.Arg14LysfsTer4 | p.R14Kfs*4 | Q9NX20 | protein_coding | TCGA-AN-A04D-01 | Breast | breast invasive carcinoma | Female | <65 | I/II | Unknown | Unknown | SD | ||
| MRPL16 | SNV | Missense_Mutation | rs370390298 | c.191N>A | p.Arg64Lys | p.R64K | Q9NX20 | protein_coding | tolerated(0.75) | benign(0.007) | TCGA-VS-A8QA-01 | Cervix | cervical & endocervical cancer | Female | <65 | I/II | Unknown | Unknown | SD |
| MRPL16 | SNV | Missense_Mutation | novel | c.751N>A | p.Val251Met | p.V251M | Q9NX20 | protein_coding | deleterious_low_confidence(0) | probably_damaging(0.999) | TCGA-AA-3877-01 | Colorectum | colon adenocarcinoma | Female | >=65 | I/II | Unknown | Unknown | SD |
| MRPL16 | SNV | Missense_Mutation | novel | c.214N>G | p.Ile72Val | p.I72V | Q9NX20 | protein_coding | deleterious(0.01) | probably_damaging(0.938) | TCGA-AA-3950-01 | Colorectum | colon adenocarcinoma | Female | >=65 | I/II | Unknown | Unknown | SD |
| MRPL16 | SNV | Missense_Mutation | c.673N>A | p.Gly225Ser | p.G225S | Q9NX20 | protein_coding | deleterious(0.02) | probably_damaging(1) | TCGA-AU-6004-01 | Colorectum | colon adenocarcinoma | Female | >=65 | I/II | Unknown | Unknown | SD | |
| MRPL16 | SNV | Missense_Mutation | c.592N>G | p.Met198Val | p.M198V | Q9NX20 | protein_coding | tolerated(0.13) | benign(0.003) | TCGA-AU-6004-01 | Colorectum | colon adenocarcinoma | Female | >=65 | I/II | Unknown | Unknown | SD | |
| MRPL16 | SNV | Missense_Mutation | rs370177555 | c.497G>A | p.Arg166His | p.R166H | Q9NX20 | protein_coding | tolerated(0.42) | benign(0.027) | TCGA-CK-4951-01 | Colorectum | colon adenocarcinoma | Female | >=65 | I/II | Unknown | Unknown | PD |
| MRPL16 | SNV | Missense_Mutation | novel | c.580N>G | p.Thr194Ala | p.T194A | Q9NX20 | protein_coding | tolerated(0.55) | benign(0.018) | TCGA-AG-3726-01 | Colorectum | rectum adenocarcinoma | Female | <65 | I/II | Unknown | Unknown | SD |
| MRPL16 | SNV | Missense_Mutation | novel | c.415N>T | p.Arg139Cys | p.R139C | Q9NX20 | protein_coding | deleterious(0) | probably_damaging(0.985) | TCGA-A5-A0G2-01 | Endometrium | uterine corpus endometrioid carcinoma | Female | <65 | III/IV | Unknown | Unknown | SD |
| Page: 1 2 3 |
Top |
Related drugs of malignant transformation related genes |
| Identification of chemicals and drugs interact with genes involved in malignant transfromation |
| (DGIdb 4.0) |
| Entrez ID | Symbol | Category | Interaction Types | Drug Claim Name | Drug Name | PMIDs |
| Page: 1 |

Copyright 2023-Present -The University of Texas Health Science Center at Houston |