
|
|||||
|
 | |
| |
| |
| |
| |
| |
|
Gene: MRPL15 |
Gene summary for MRPL15 |
| Gene information | Species | Human | Gene symbol | MRPL15 | Gene ID | 29088 |
| Gene name | mitochondrial ribosomal protein L15 | |
| Gene Alias | HSPC145 | |
| Cytomap | 8q11.23 | |
| Gene Type | protein-coding | GO ID | GO:0006412 | UniProtAcc | Q9P015 |
Top |
Malignant transformation analysis |
| Identification of the aberrant gene expression in precancerous and cancerous lesions by comparing the gene expression of stem-like cells in diseased tissues with normal stem cells |
| Entrez ID | Symbol | Replicates | Species | Organ | Tissue | Adj P-value | Log2FC | Malignancy |
| 29088 | MRPL15 | GSM4909281 | Human | Breast | IDC | 4.88e-07 | 2.80e-01 | 0.21 |
| 29088 | MRPL15 | GSM4909285 | Human | Breast | IDC | 2.18e-05 | 1.91e-01 | 0.21 |
| 29088 | MRPL15 | GSM4909293 | Human | Breast | IDC | 2.43e-04 | 1.49e-01 | 0.1581 |
| 29088 | MRPL15 | GSM4909311 | Human | Breast | IDC | 2.26e-04 | -7.36e-02 | 0.1534 |
| 29088 | MRPL15 | GSM4909317 | Human | Breast | IDC | 5.32e-55 | 1.13e+00 | 0.1355 |
| 29088 | MRPL15 | GSM4909318 | Human | Breast | IDC | 5.43e-26 | 1.38e+00 | 0.2031 |
| 29088 | MRPL15 | GSM4909319 | Human | Breast | IDC | 9.71e-07 | -5.94e-02 | 0.1563 |
| 29088 | MRPL15 | brca1 | Human | Breast | Precancer | 1.13e-13 | 3.88e-01 | -0.0338 |
| 29088 | MRPL15 | brca2 | Human | Breast | Precancer | 5.21e-08 | 2.01e-01 | -0.024 |
| 29088 | MRPL15 | brca3 | Human | Breast | Precancer | 1.15e-04 | 1.99e-01 | -0.0263 |
| 29088 | MRPL15 | P1 | Human | Breast | IDC | 6.77e-03 | -7.84e-02 | 0.1527 |
| 29088 | MRPL15 | DCIS2 | Human | Breast | DCIS | 1.53e-32 | 1.06e-01 | 0.0085 |
| 29088 | MRPL15 | HTA11_1938_2000001011 | Human | Colorectum | AD | 5.15e-04 | 3.27e-01 | -0.0811 |
| 29088 | MRPL15 | HTA11_78_2000001011 | Human | Colorectum | AD | 8.80e-05 | 3.54e-01 | -0.1088 |
| 29088 | MRPL15 | HTA11_347_2000001011 | Human | Colorectum | AD | 1.11e-05 | 2.70e-01 | -0.1954 |
| 29088 | MRPL15 | HTA11_1391_2000001011 | Human | Colorectum | AD | 7.34e-05 | 3.15e-01 | -0.059 |
| 29088 | MRPL15 | HTA11_866_3004761011 | Human | Colorectum | AD | 4.12e-03 | 2.51e-01 | 0.096 |
| 29088 | MRPL15 | HTA11_7696_3000711011 | Human | Colorectum | AD | 4.96e-02 | 1.57e-01 | 0.0674 |
| 29088 | MRPL15 | HTA11_6818_2000001021 | Human | Colorectum | AD | 2.07e-03 | 3.34e-01 | 0.0588 |
| 29088 | MRPL15 | HTA11_99999970781_79442 | Human | Colorectum | MSS | 8.10e-03 | 2.75e-01 | 0.294 |
| Page: 1 2 3 4 5 6 7 8 |
| Tissue | Expression Dynamics | Abbreviation |
| Breast | 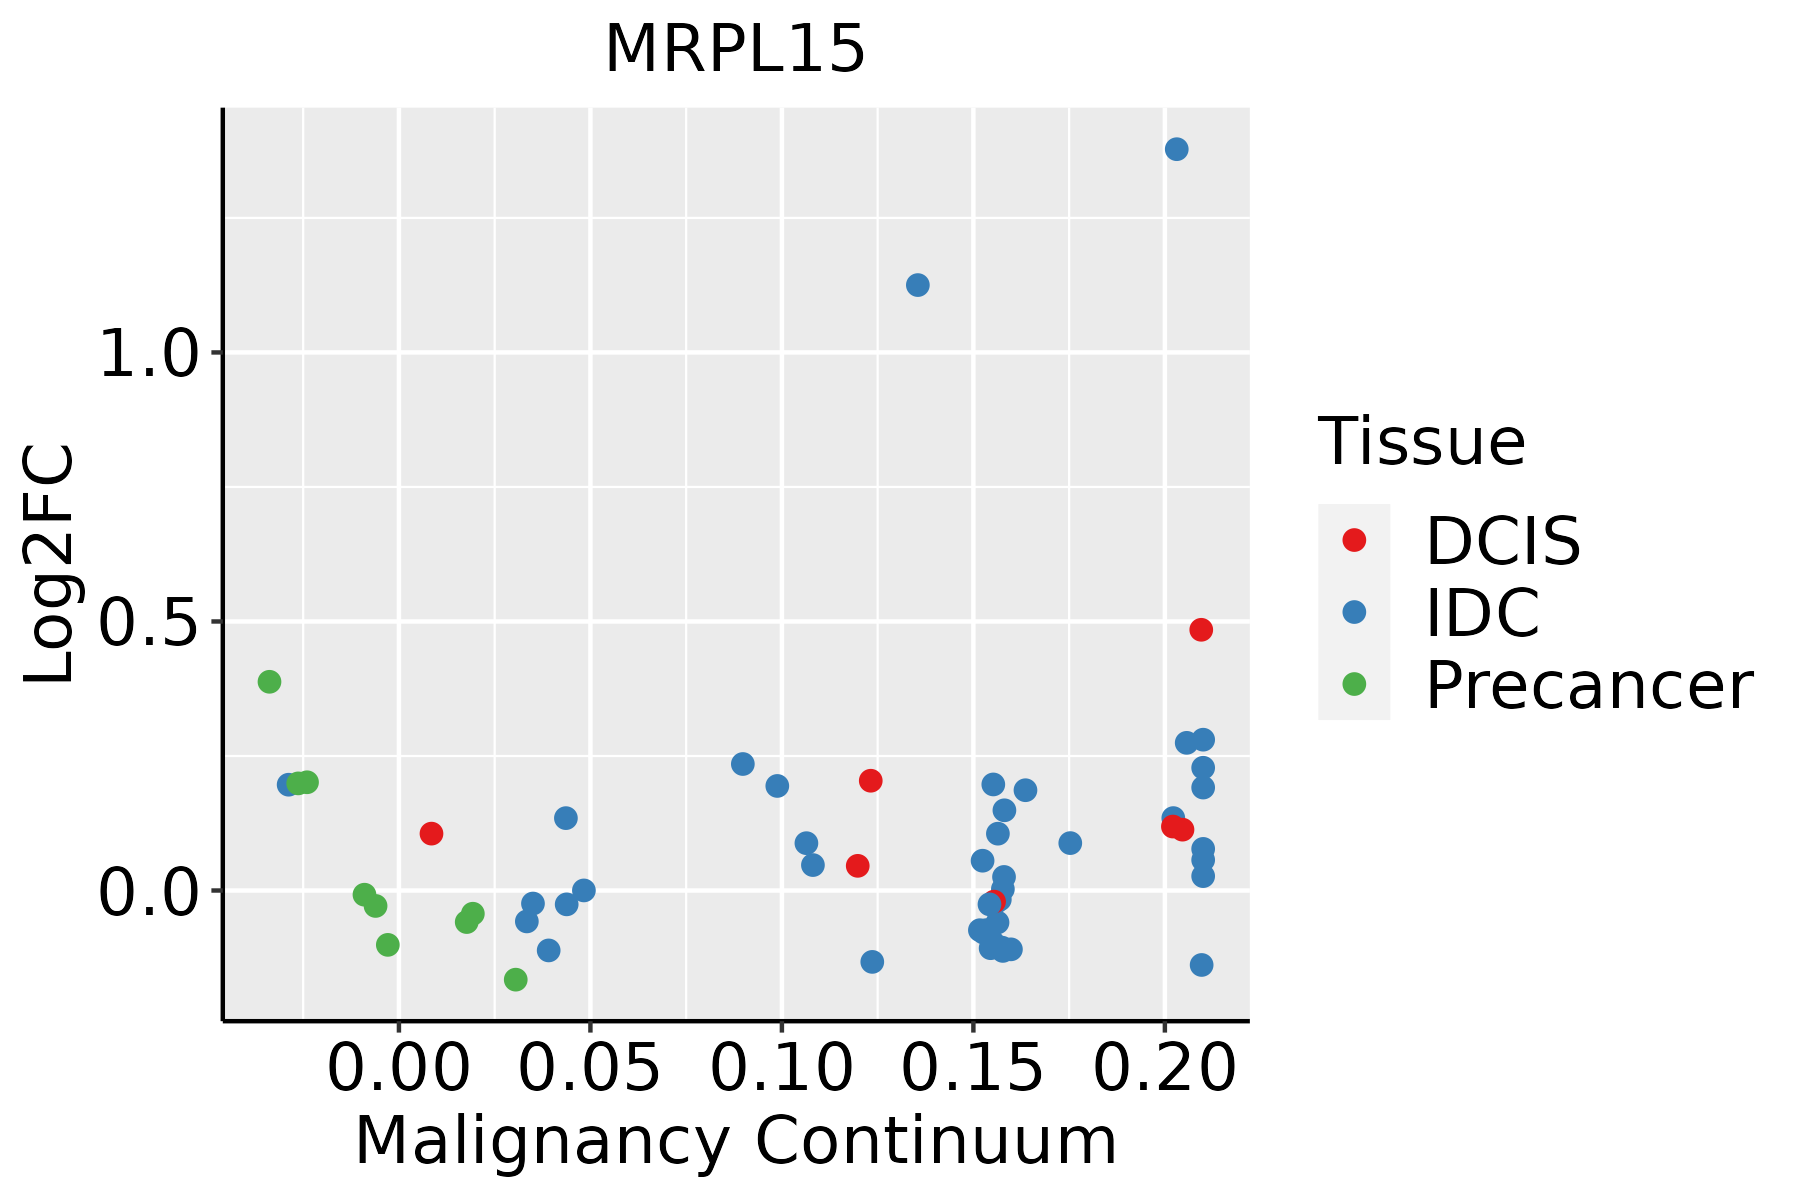 | IDC: Invasive ductal carcinoma |
| DCIS: Ductal carcinoma in situ | ||
| Precancer(BRCA1-mut): Precancerous lesion from BRCA1 mutation carriers | ||
| Colorectum (GSE201348) |  | FAP: Familial adenomatous polyposis |
| CRC: Colorectal cancer | ||
| Colorectum (HTA11) |  | AD: Adenomas |
| SER: Sessile serrated lesions | ||
| MSI-H: Microsatellite-high colorectal cancer | ||
| MSS: Microsatellite stable colorectal cancer | ||
| Esophagus | 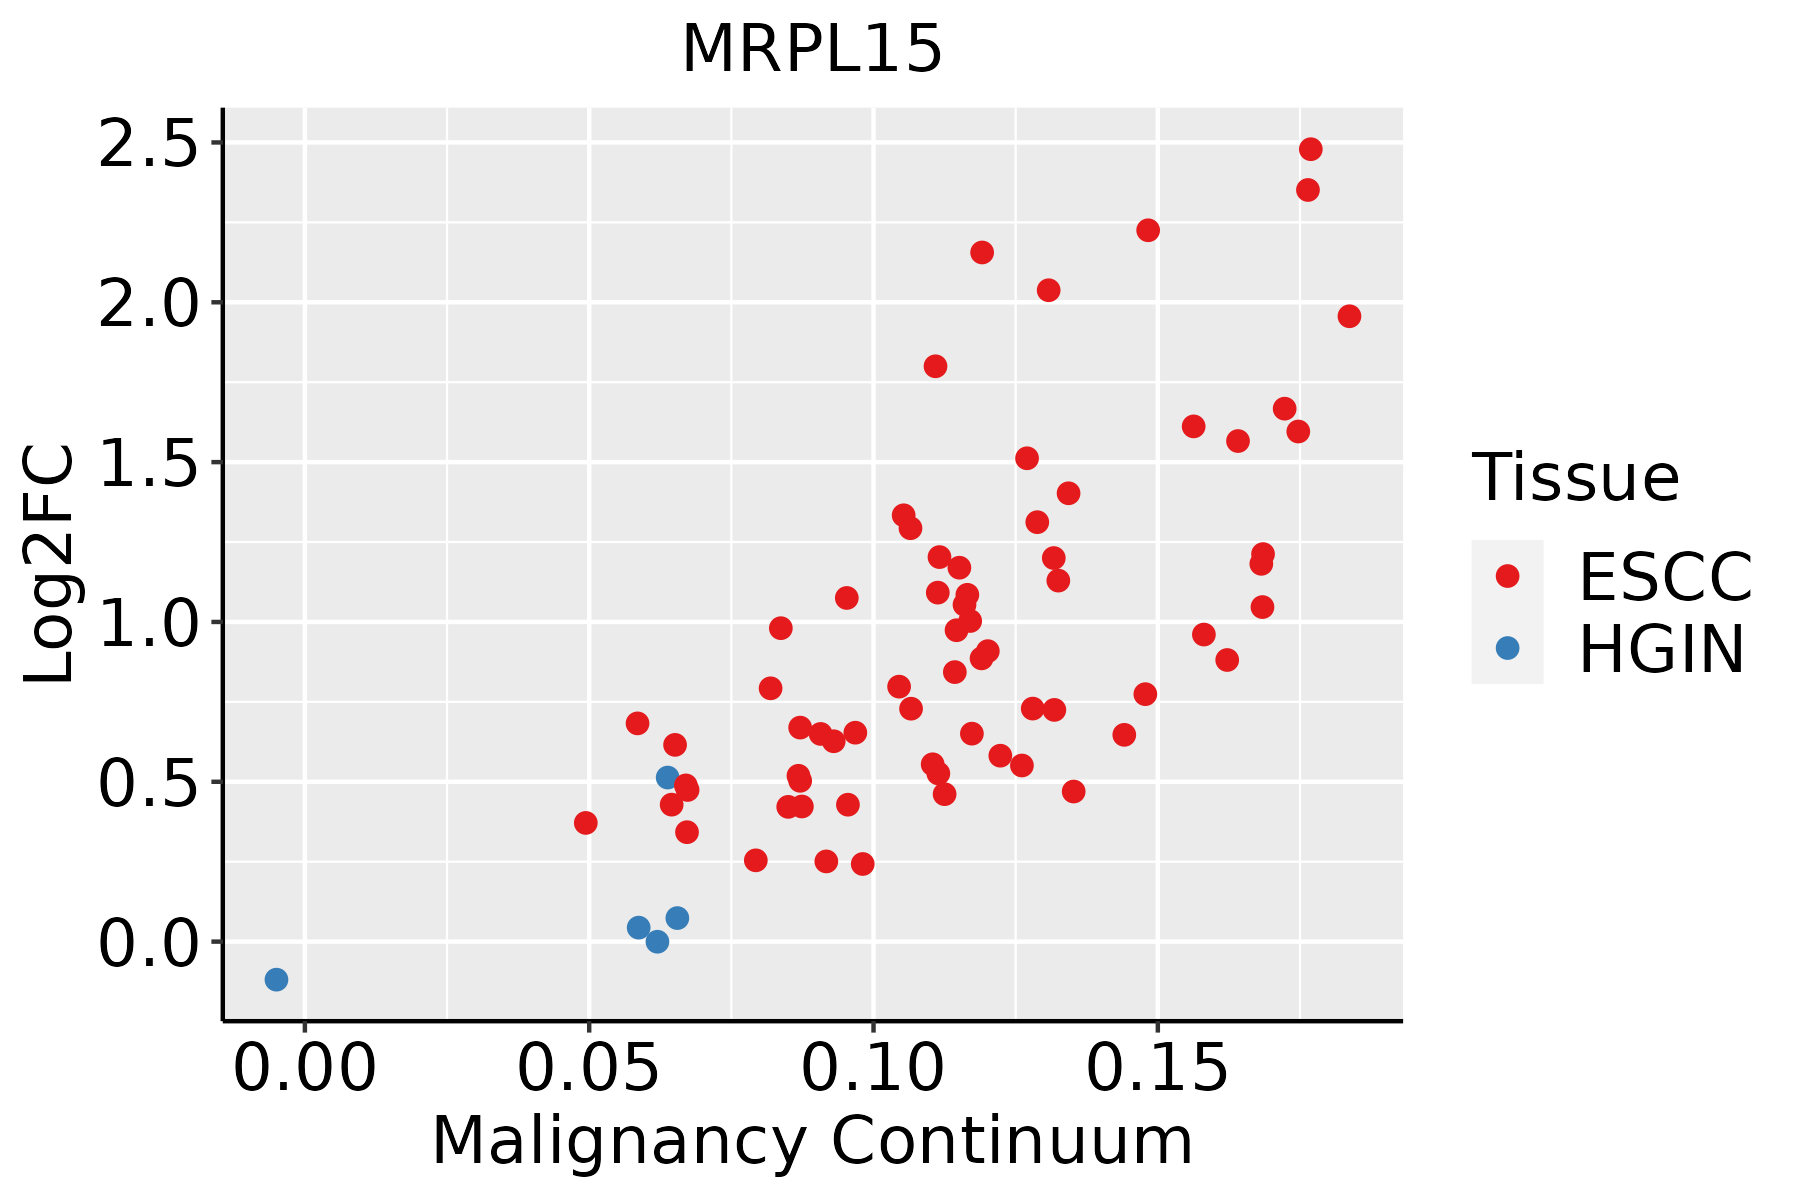 | ESCC: Esophageal squamous cell carcinoma |
| HGIN: High-grade intraepithelial neoplasias | ||
| LGIN: Low-grade intraepithelial neoplasias | ||
| Liver | 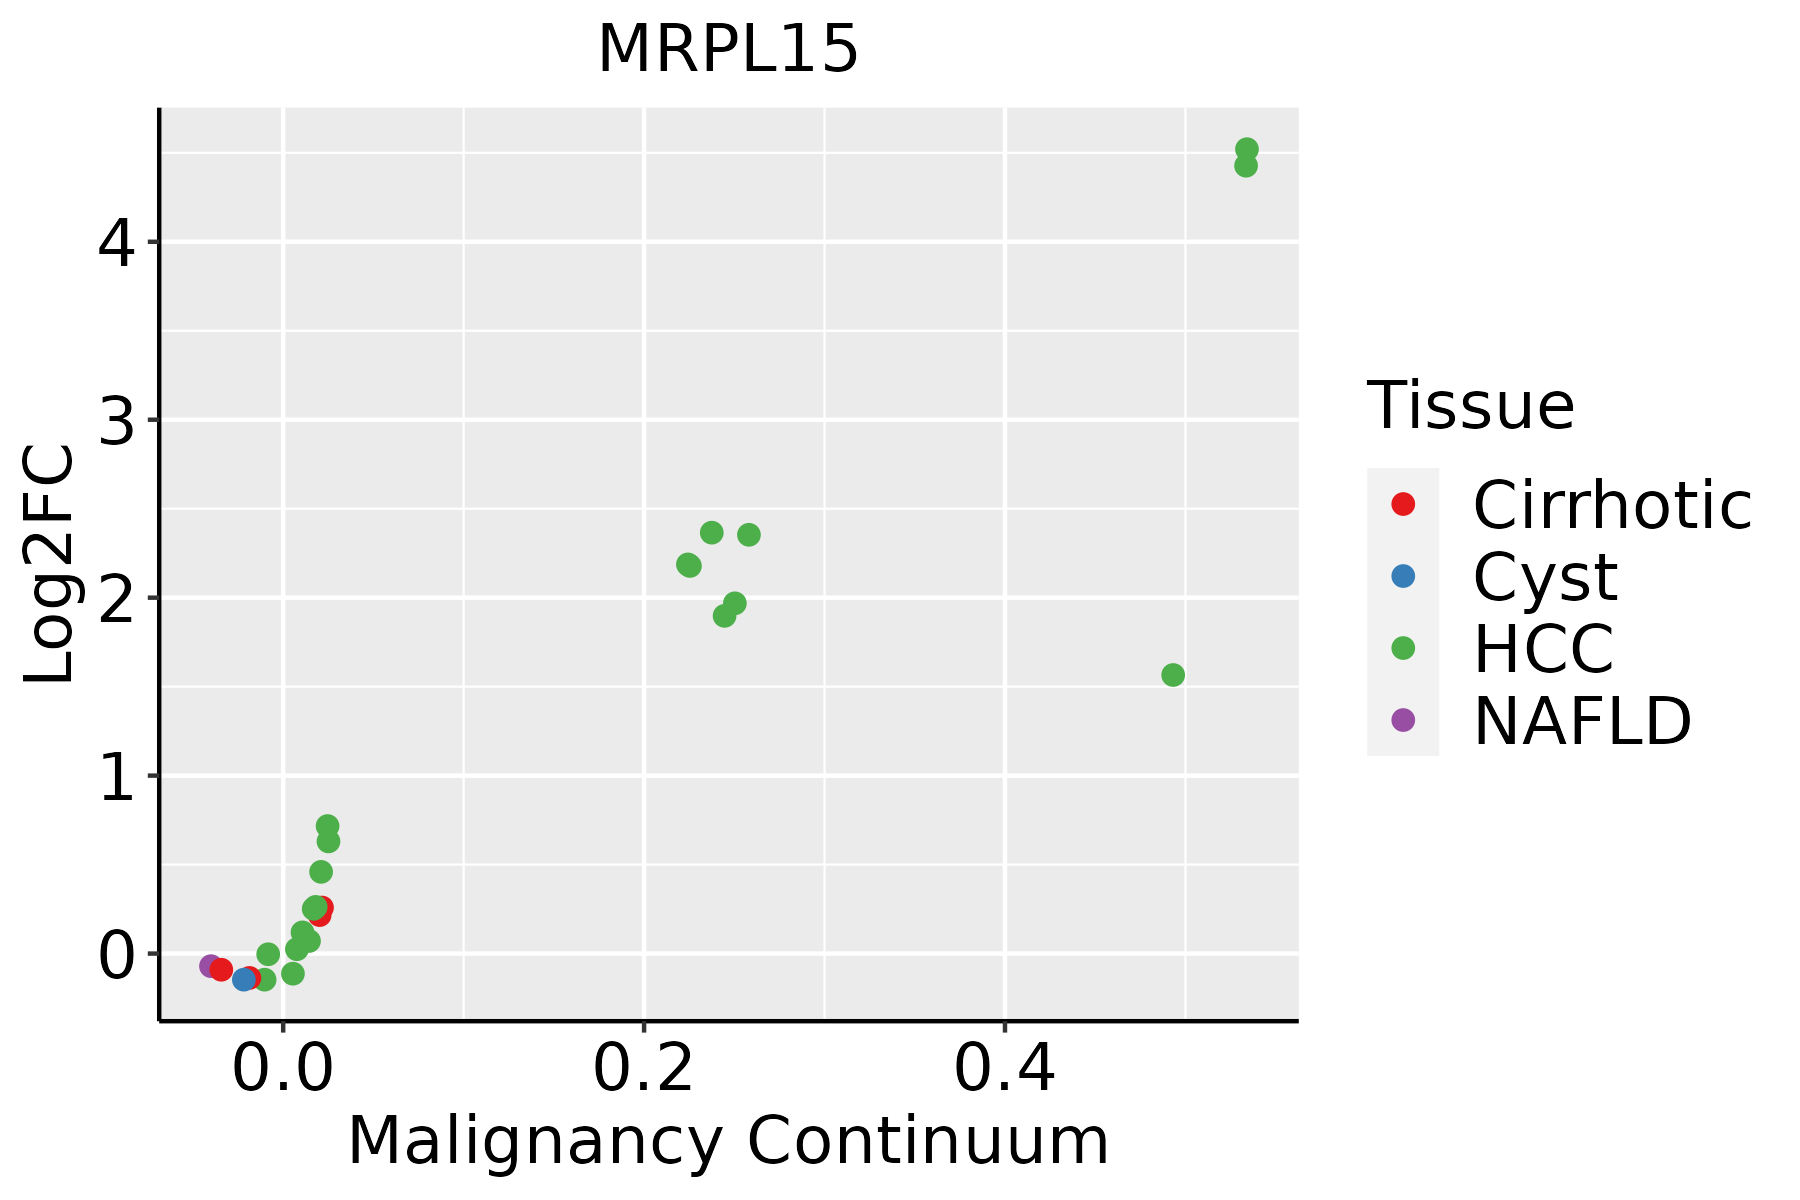 | HCC: Hepatocellular carcinoma |
| NAFLD: Non-alcoholic fatty liver disease | ||
| Oral Cavity |  | EOLP: Erosive Oral lichen planus |
| LP: leukoplakia | ||
| NEOLP: Non-erosive oral lichen planus | ||
| OSCC: Oral squamous cell carcinoma | ||
| Skin |  | AK: Actinic keratosis |
| cSCC: Cutaneous squamous cell carcinoma | ||
| SCCIS:squamous cell carcinoma in situ | ||
| Thyroid |  | ATC: Anaplastic thyroid cancer |
| HT: Hashimoto's thyroiditis | ||
| PTC: Papillary thyroid cancer |
| ∗log2FC in expression of this searched gene in stem-like cells from each diseased tissue sample relative to stem-like cells in normal samples in each tissue plotted against the malignancy continuum. Samples are colored based on if they are from different disease stage. |
Top |
Malignant transformation related pathway analysis |
| Find out the enriched GO biological processes and KEGG pathways involved in transition from healthy to precancer to cancer |
| Tissue | Disease Stage | Enriched GO biological Processes |
| Colorectum | AD |  |
| Colorectum | SER |  |
| Colorectum | MSS |  |
| Colorectum | MSI-H |  |
| Colorectum | FAP |  |
| ∗Top 15 enriched GO BP terms are showed in the bar plot of each disease state in each tissue. Each row represents a significant GO biological process which is colored according to the -log10(p.adjust). |
| Page: 1 2 3 4 5 6 7 8 9 |
| GO ID | Tissue | Disease Stage | Description | Gene Ratio | Bg Ratio | pvalue | p.adjust | Count |
| GO:19908303 | Breast | Precancer | cellular response to leukemia inhibitory factor | 13/1080 | 94/18723 | 2.83e-03 | 2.49e-02 | 13 |
| GO:19908233 | Breast | Precancer | response to leukemia inhibitory factor | 13/1080 | 95/18723 | 3.11e-03 | 2.64e-02 | 13 |
| GO:19908301 | Breast | IDC | cellular response to leukemia inhibitory factor | 15/1434 | 94/18723 | 5.06e-03 | 3.79e-02 | 15 |
| GO:199082311 | Breast | IDC | response to leukemia inhibitory factor | 15/1434 | 95/18723 | 5.59e-03 | 4.07e-02 | 15 |
| GO:19908302 | Breast | DCIS | cellular response to leukemia inhibitory factor | 15/1390 | 94/18723 | 3.79e-03 | 3.03e-02 | 15 |
| GO:19908232 | Breast | DCIS | response to leukemia inhibitory factor | 15/1390 | 95/18723 | 4.20e-03 | 3.31e-02 | 15 |
| GO:1990823 | Colorectum | FAP | response to leukemia inhibitory factor | 23/2622 | 95/18723 | 5.32e-03 | 3.49e-02 | 23 |
| GO:199082316 | Esophagus | ESCC | response to leukemia inhibitory factor | 60/8552 | 95/18723 | 4.41e-04 | 2.48e-03 | 60 |
| GO:199083015 | Esophagus | ESCC | cellular response to leukemia inhibitory factor | 59/8552 | 94/18723 | 6.19e-04 | 3.32e-03 | 59 |
| GO:19908237 | Oral cavity | OSCC | response to leukemia inhibitory factor | 58/7305 | 95/18723 | 1.10e-05 | 1.14e-04 | 58 |
| GO:19908307 | Oral cavity | OSCC | cellular response to leukemia inhibitory factor | 57/7305 | 94/18723 | 1.75e-05 | 1.71e-04 | 57 |
| GO:199082317 | Skin | cSCC | response to leukemia inhibitory factor | 42/4864 | 95/18723 | 8.79e-05 | 8.27e-04 | 42 |
| GO:199083016 | Skin | cSCC | cellular response to leukemia inhibitory factor | 41/4864 | 94/18723 | 1.53e-04 | 1.35e-03 | 41 |
| GO:199082310 | Thyroid | PTC | response to leukemia inhibitory factor | 42/5968 | 95/18723 | 7.69e-03 | 3.27e-02 | 42 |
| GO:199083010 | Thyroid | PTC | cellular response to leukemia inhibitory factor | 41/5968 | 94/18723 | 1.10e-02 | 4.38e-02 | 41 |
| GO:199082318 | Thyroid | ATC | response to leukemia inhibitory factor | 44/6293 | 95/18723 | 6.74e-03 | 2.68e-02 | 44 |
| GO:199083017 | Thyroid | ATC | cellular response to leukemia inhibitory factor | 43/6293 | 94/18723 | 9.54e-03 | 3.50e-02 | 43 |
| Page: 1 |
| Pathway ID | Tissue | Disease Stage | Description | Gene Ratio | Bg Ratio | pvalue | p.adjust | qvalue | Count |
| hsa0301018 | Breast | Precancer | Ribosome | 80/684 | 167/8465 | 7.33e-44 | 2.32e-41 | 1.77e-41 | 80 |
| hsa0301019 | Breast | Precancer | Ribosome | 80/684 | 167/8465 | 7.33e-44 | 2.32e-41 | 1.77e-41 | 80 |
| hsa0301024 | Breast | IDC | Ribosome | 83/867 | 167/8465 | 6.07e-39 | 9.87e-37 | 7.38e-37 | 83 |
| hsa0301034 | Breast | IDC | Ribosome | 83/867 | 167/8465 | 6.07e-39 | 9.87e-37 | 7.38e-37 | 83 |
| hsa0301044 | Breast | DCIS | Ribosome | 82/846 | 167/8465 | 8.69e-39 | 1.40e-36 | 1.03e-36 | 82 |
| hsa0301054 | Breast | DCIS | Ribosome | 82/846 | 167/8465 | 8.69e-39 | 1.40e-36 | 1.03e-36 | 82 |
| hsa03010 | Colorectum | AD | Ribosome | 96/2092 | 167/8465 | 8.28e-20 | 5.54e-18 | 3.54e-18 | 96 |
| hsa030101 | Colorectum | AD | Ribosome | 96/2092 | 167/8465 | 8.28e-20 | 5.54e-18 | 3.54e-18 | 96 |
| hsa030104 | Colorectum | MSS | Ribosome | 96/1875 | 167/8465 | 1.82e-23 | 2.03e-21 | 1.24e-21 | 96 |
| hsa030105 | Colorectum | MSS | Ribosome | 96/1875 | 167/8465 | 1.82e-23 | 2.03e-21 | 1.24e-21 | 96 |
| hsa030108 | Colorectum | FAP | Ribosome | 59/1404 | 167/8465 | 2.38e-09 | 1.32e-07 | 8.05e-08 | 59 |
| hsa030109 | Colorectum | FAP | Ribosome | 59/1404 | 167/8465 | 2.38e-09 | 1.32e-07 | 8.05e-08 | 59 |
| hsa03010211 | Esophagus | ESCC | Ribosome | 129/4205 | 167/8465 | 1.43e-13 | 3.43e-12 | 1.75e-12 | 129 |
| hsa03010310 | Esophagus | ESCC | Ribosome | 129/4205 | 167/8465 | 1.43e-13 | 3.43e-12 | 1.75e-12 | 129 |
| hsa0301022 | Liver | Cirrhotic | Ribosome | 127/2530 | 167/8465 | 2.12e-35 | 7.06e-33 | 4.35e-33 | 127 |
| hsa0301032 | Liver | Cirrhotic | Ribosome | 127/2530 | 167/8465 | 2.12e-35 | 7.06e-33 | 4.35e-33 | 127 |
| hsa0301042 | Liver | HCC | Ribosome | 128/4020 | 167/8465 | 7.32e-15 | 2.23e-13 | 1.24e-13 | 128 |
| hsa0301052 | Liver | HCC | Ribosome | 128/4020 | 167/8465 | 7.32e-15 | 2.23e-13 | 1.24e-13 | 128 |
| hsa0301030 | Oral cavity | OSCC | Ribosome | 128/3704 | 167/8465 | 2.42e-18 | 1.62e-16 | 8.25e-17 | 128 |
| hsa03010114 | Oral cavity | OSCC | Ribosome | 128/3704 | 167/8465 | 2.42e-18 | 1.62e-16 | 8.25e-17 | 128 |
| Page: 1 2 |
Top |
Cell-cell communication analysis |
| Identification of potential cell-cell interactions between two cell types and their ligand-receptor pairs for different disease states |
| Ligand | Receptor | LRpair | Pathway | Tissue | Disease Stage |
| Page: 1 |
Top |
Single-cell gene regulatory network inference analysis |
| Find out the significant the regulons (TFs) and the target genes of each regulon across cell types for different disease states |
| TF | Cell Type | Tissue | Disease Stage | Target Gene | RSS | Regulon Activity |
| ∗The dot plots of a searched regulon are shown for all cell subpopulations in each disease state of each tissue based on the regulon specific score inferred using pySCENIC and by calculating the average expression. |
| Page: 1 |
Top |
Somatic mutation of malignant transformation related genes |
| Annotation of somatic variants for genes involved in malignant transformation |
| Hugo Symbol | Variant Class | Variant Classification | dbSNP RS | HGVSc | HGVSp | HGVSp Short | SWISSPROT | BIOTYPE | SIFT | PolyPhen | Tumor Sample Barcode | Tissue | Histology | Sex | Age | Stage | Therapy Types | Drugs | Outcome |
| MRPL15 | SNV | Missense_Mutation | c.146G>A | p.Cys49Tyr | p.C49Y | Q9P015 | protein_coding | tolerated(0.34) | benign(0.381) | TCGA-A8-A07F-01 | Breast | breast invasive carcinoma | Female | >=65 | I/II | Hormone Therapy | tamoxiphen | SD | |
| MRPL15 | SNV | Missense_Mutation | c.790C>G | p.Gln264Glu | p.Q264E | Q9P015 | protein_coding | deleterious(0.03) | possibly_damaging(0.885) | TCGA-AQ-A04H-01 | Breast | breast invasive carcinoma | Female | <65 | III/IV | Chemotherapy | taxotere | SD | |
| MRPL15 | insertion | Nonsense_Mutation | novel | c.878_879insGCCGAGATCATGCCACTGTACTCTAGCCTGGGCGACAGAGCGAGAC | p.Tyr293Ter | p.Y293* | Q9P015 | protein_coding | TCGA-A8-A08H-01 | Breast | breast invasive carcinoma | Female | >=65 | I/II | Unknown | Unknown | SD | ||
| MRPL15 | insertion | Frame_Shift_Ins | novel | c.244_245insCCAACACT | p.Gly82AlafsTer18 | p.G82Afs*18 | Q9P015 | protein_coding | TCGA-B6-A0I6-01 | Breast | breast invasive carcinoma | Female | <65 | I/II | Unknown | Unknown | PD | ||
| MRPL15 | insertion | In_Frame_Ins | novel | c.245_246insACTCAAAAAAGATCCTTTATTTAACGCAGT | p.Gly82_Phe83insLeuLysLysAspProLeuPheAsnAlaVal | p.G82_F83insLKKDPLFNAV | Q9P015 | protein_coding | TCGA-B6-A0I6-01 | Breast | breast invasive carcinoma | Female | <65 | I/II | Unknown | Unknown | PD | ||
| MRPL15 | insertion | Frame_Shift_Ins | novel | c.645_646insTATAATTCTTGGTCTC | p.Asp216TyrfsTer21 | p.D216Yfs*21 | Q9P015 | protein_coding | TCGA-BH-A0HF-01 | Breast | breast invasive carcinoma | Female | >=65 | I/II | Hormone Therapy | arimidex | SD | ||
| MRPL15 | insertion | Nonsense_Mutation | novel | c.647_648insCCCTTAGCAGATAGCTTCCAGTTC | p.Asp216_Ala217insProTerGlnIleAlaSerSerSer | p.D216_A217insP*QIASSS | Q9P015 | protein_coding | TCGA-BH-A0HF-01 | Breast | breast invasive carcinoma | Female | >=65 | I/II | Hormone Therapy | arimidex | SD | ||
| MRPL15 | SNV | Missense_Mutation | c.773N>G | p.Thr258Ser | p.T258S | Q9P015 | protein_coding | tolerated(0.72) | benign(0) | TCGA-IR-A3LI-01 | Cervix | cervical & endocervical cancer | Female | <65 | I/II | Chemotherapy | cisplatin | CR | |
| MRPL15 | SNV | Missense_Mutation | novel | c.102N>T | p.Lys34Asn | p.K34N | Q9P015 | protein_coding | tolerated(0.29) | benign(0.001) | TCGA-CA-6717-01 | Colorectum | colon adenocarcinoma | Male | <65 | I/II | Chemotherapy | oxaliplatin | CR |
| MRPL15 | SNV | Missense_Mutation | c.460N>G | p.Ile154Val | p.I154V | Q9P015 | protein_coding | deleterious(0.02) | possibly_damaging(0.681) | TCGA-F5-6864-01 | Colorectum | rectum adenocarcinoma | Female | >=65 | III/IV | Chemotherapy | 5-fluorouracil | CR |
| Page: 1 2 3 4 |
Top |
Related drugs of malignant transformation related genes |
| Identification of chemicals and drugs interact with genes involved in malignant transfromation |
| (DGIdb 4.0) |
| Entrez ID | Symbol | Category | Interaction Types | Drug Claim Name | Drug Name | PMIDs |
| Page: 1 |

Copyright 2023-Present -The University of Texas Health Science Center at Houston |