
|
|||||
|
 | |
| |
| |
| |
| |
| |
|
Gene: MRPL13 |
Gene summary for MRPL13 |
| Gene information | Species | Human | Gene symbol | MRPL13 | Gene ID | 28998 |
| Gene name | mitochondrial ribosomal protein L13 | |
| Gene Alias | L13 | |
| Cytomap | 8q24.12 | |
| Gene Type | protein-coding | GO ID | GO:0006412 | UniProtAcc | Q9BYD1 |
Top |
Malignant transformation analysis |
| Identification of the aberrant gene expression in precancerous and cancerous lesions by comparing the gene expression of stem-like cells in diseased tissues with normal stem cells |
| Entrez ID | Symbol | Replicates | Species | Organ | Tissue | Adj P-value | Log2FC | Malignancy |
| 28998 | MRPL13 | GSM4909281 | Human | Breast | IDC | 7.56e-38 | 8.26e-01 | 0.21 |
| 28998 | MRPL13 | GSM4909282 | Human | Breast | IDC | 3.90e-07 | 4.11e-01 | -0.0288 |
| 28998 | MRPL13 | GSM4909285 | Human | Breast | IDC | 8.15e-04 | 2.15e-01 | 0.21 |
| 28998 | MRPL13 | GSM4909286 | Human | Breast | IDC | 2.22e-03 | 1.27e-01 | 0.1081 |
| 28998 | MRPL13 | GSM4909287 | Human | Breast | IDC | 4.47e-07 | 3.73e-01 | 0.2057 |
| 28998 | MRPL13 | GSM4909288 | Human | Breast | IDC | 1.14e-02 | 2.74e-01 | 0.0988 |
| 28998 | MRPL13 | GSM4909290 | Human | Breast | IDC | 3.68e-11 | 4.84e-01 | 0.2096 |
| 28998 | MRPL13 | GSM4909291 | Human | Breast | IDC | 1.84e-21 | 7.24e-01 | 0.1753 |
| 28998 | MRPL13 | GSM4909293 | Human | Breast | IDC | 1.14e-02 | 1.94e-01 | 0.1581 |
| 28998 | MRPL13 | GSM4909294 | Human | Breast | IDC | 9.09e-07 | 3.97e-01 | 0.2022 |
| 28998 | MRPL13 | GSM4909296 | Human | Breast | IDC | 6.76e-03 | 1.58e-01 | 0.1524 |
| 28998 | MRPL13 | GSM4909304 | Human | Breast | IDC | 8.80e-13 | 5.03e-01 | 0.1636 |
| 28998 | MRPL13 | GSM4909306 | Human | Breast | IDC | 2.15e-10 | 4.85e-01 | 0.1564 |
| 28998 | MRPL13 | GSM4909308 | Human | Breast | IDC | 3.47e-04 | 2.72e-01 | 0.158 |
| 28998 | MRPL13 | GSM4909311 | Human | Breast | IDC | 1.05e-11 | -7.53e-02 | 0.1534 |
| 28998 | MRPL13 | GSM4909312 | Human | Breast | IDC | 8.07e-04 | 1.73e-01 | 0.1552 |
| 28998 | MRPL13 | GSM4909317 | Human | Breast | IDC | 1.44e-03 | 2.61e-01 | 0.1355 |
| 28998 | MRPL13 | GSM4909319 | Human | Breast | IDC | 1.18e-14 | -1.83e-02 | 0.1563 |
| 28998 | MRPL13 | GSM4909320 | Human | Breast | IDC | 3.19e-04 | 2.01e-02 | 0.1575 |
| 28998 | MRPL13 | GSM4909321 | Human | Breast | IDC | 5.71e-04 | 2.17e-02 | 0.1559 |
| Page: 1 2 3 4 5 6 7 8 |
| Tissue | Expression Dynamics | Abbreviation |
| Breast |  | IDC: Invasive ductal carcinoma |
| DCIS: Ductal carcinoma in situ | ||
| Precancer(BRCA1-mut): Precancerous lesion from BRCA1 mutation carriers | ||
| Esophagus | 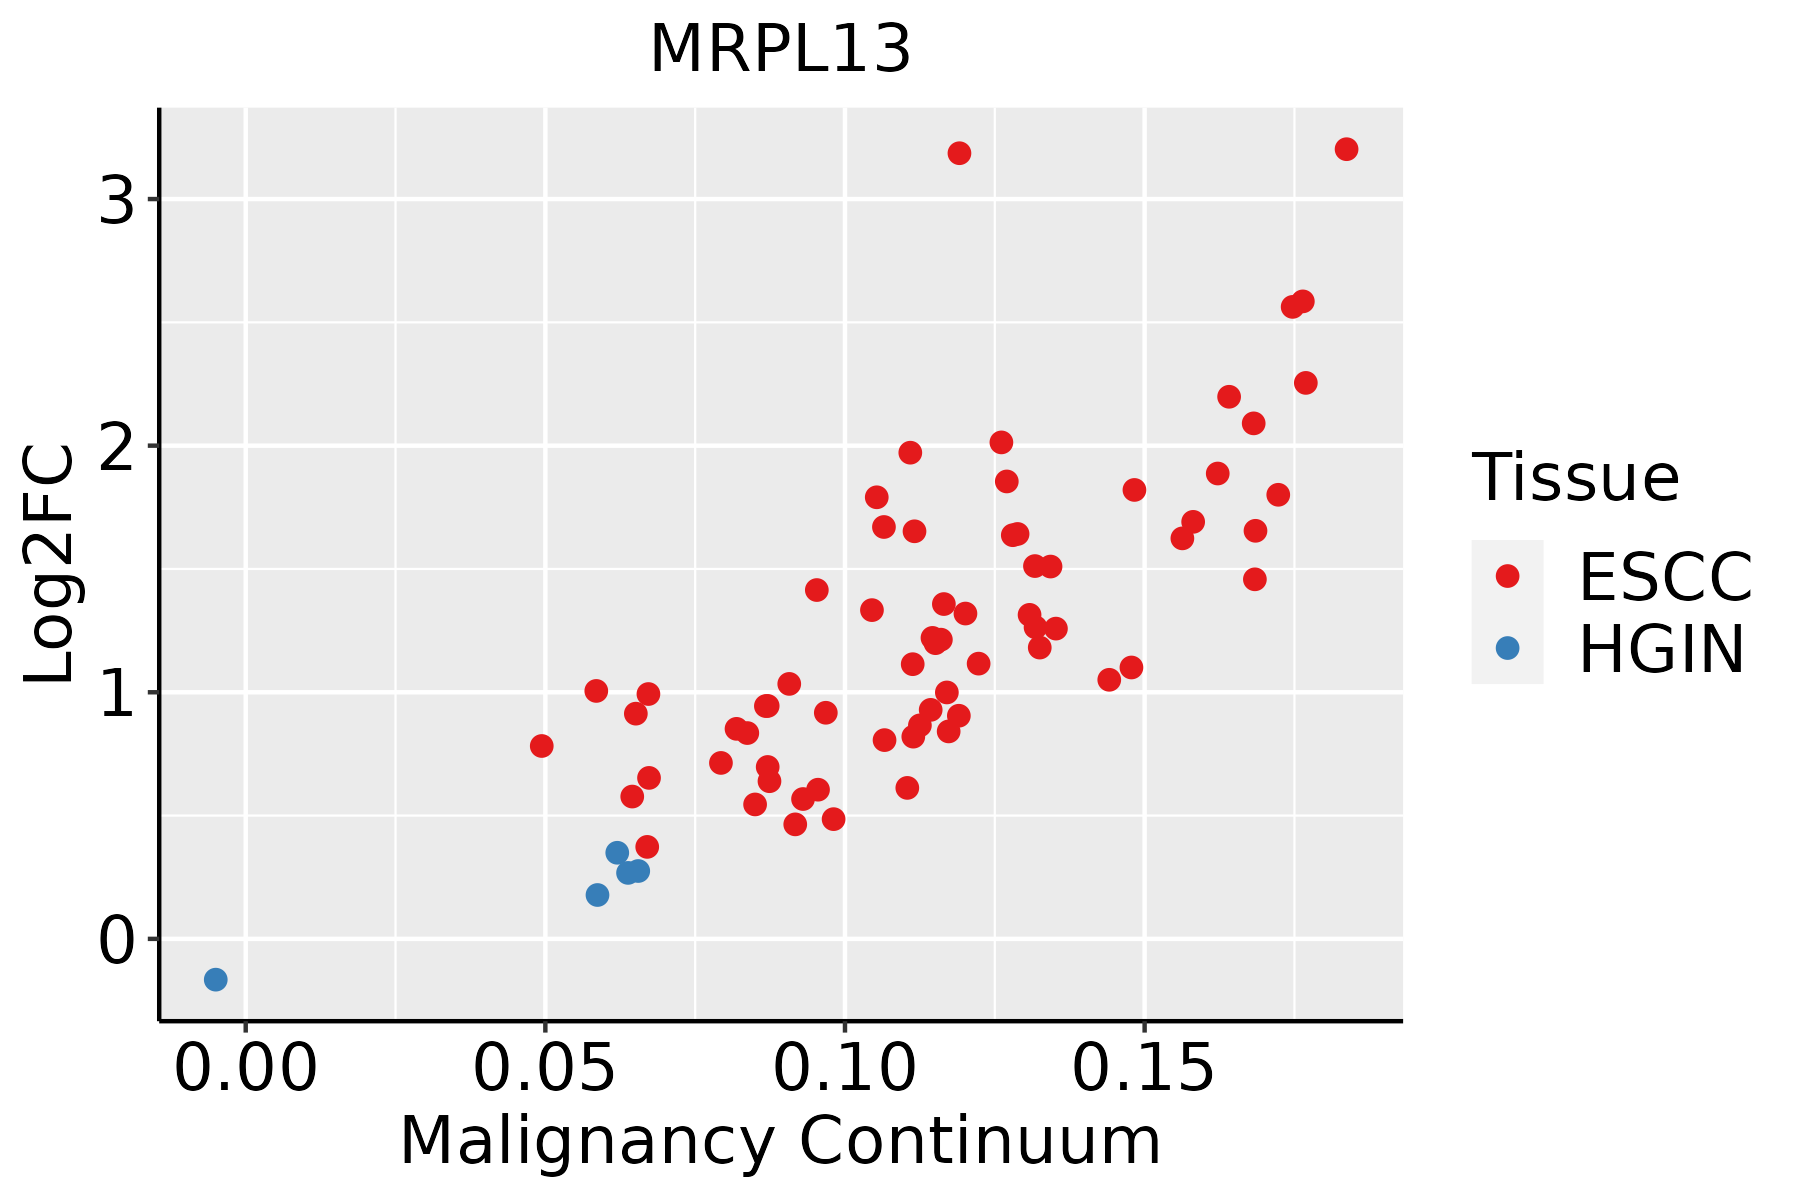 | ESCC: Esophageal squamous cell carcinoma |
| HGIN: High-grade intraepithelial neoplasias | ||
| LGIN: Low-grade intraepithelial neoplasias | ||
| Liver |  | HCC: Hepatocellular carcinoma |
| NAFLD: Non-alcoholic fatty liver disease | ||
| Oral Cavity | 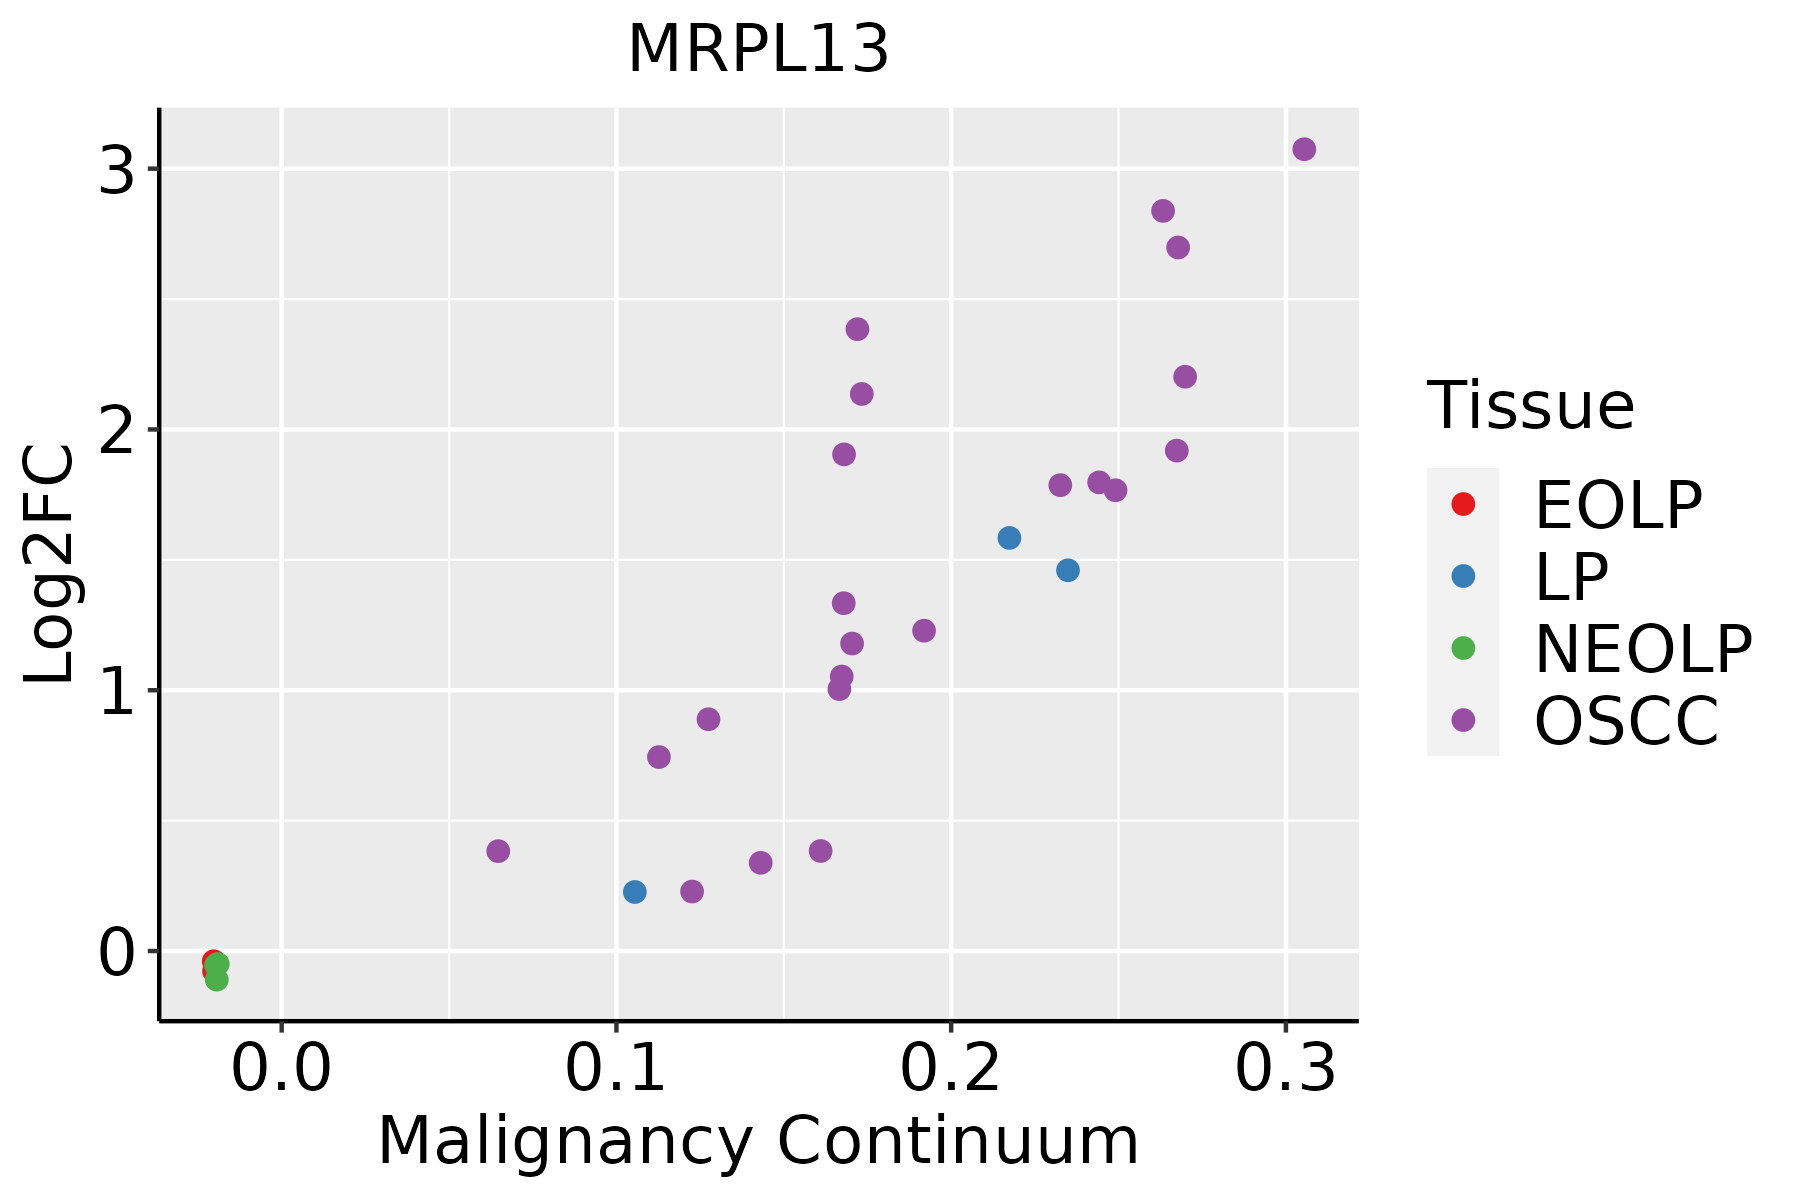 | EOLP: Erosive Oral lichen planus |
| LP: leukoplakia | ||
| NEOLP: Non-erosive oral lichen planus | ||
| OSCC: Oral squamous cell carcinoma | ||
| Skin | 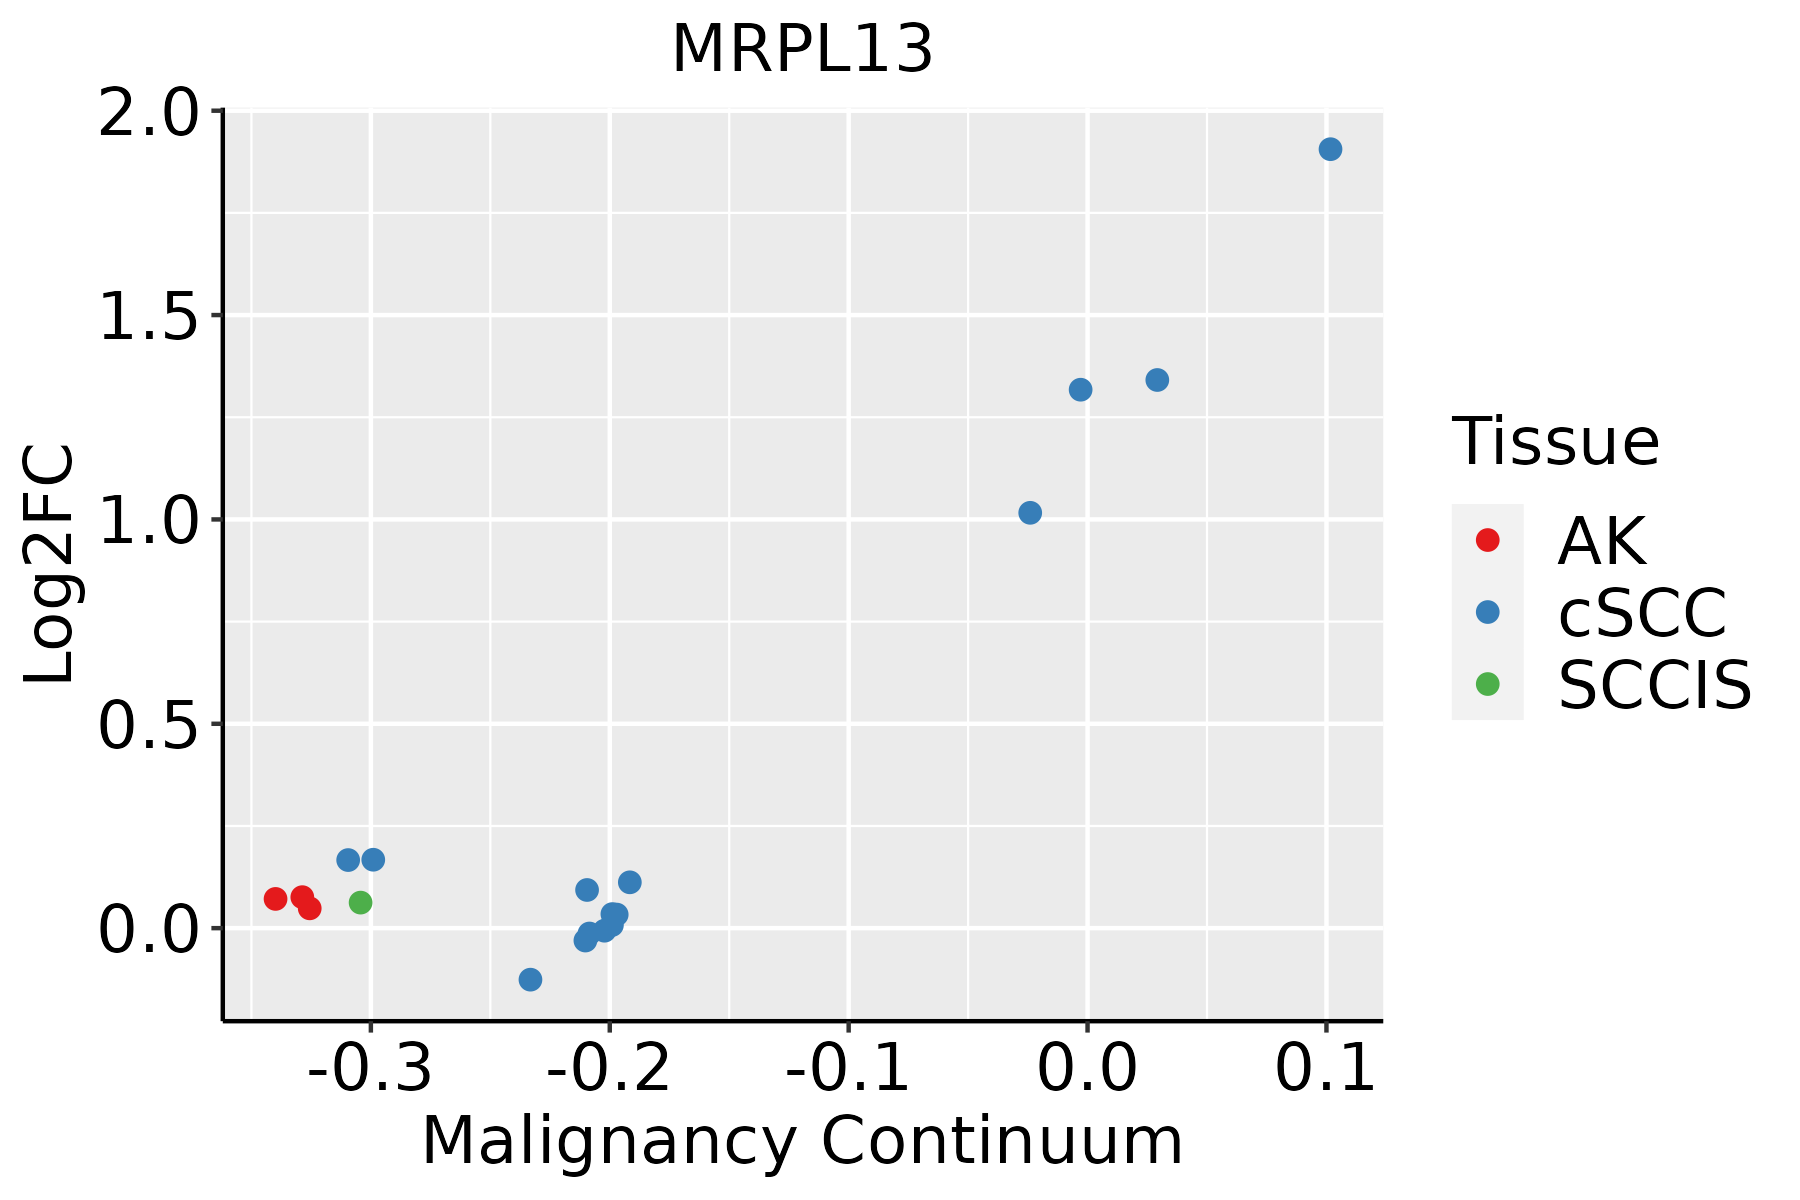 | AK: Actinic keratosis |
| cSCC: Cutaneous squamous cell carcinoma | ||
| SCCIS:squamous cell carcinoma in situ | ||
| Thyroid |  | ATC: Anaplastic thyroid cancer |
| HT: Hashimoto's thyroiditis | ||
| PTC: Papillary thyroid cancer |
| ∗log2FC in expression of this searched gene in stem-like cells from each diseased tissue sample relative to stem-like cells in normal samples in each tissue plotted against the malignancy continuum. Samples are colored based on if they are from different disease stage. |
Top |
Malignant transformation related pathway analysis |
| Find out the enriched GO biological processes and KEGG pathways involved in transition from healthy to precancer to cancer |
| Tissue | Disease Stage | Enriched GO biological Processes |
| Colorectum | AD |  |
| Colorectum | SER |  |
| Colorectum | MSS |  |
| Colorectum | MSI-H |  |
| Colorectum | FAP |  |
| ∗Top 15 enriched GO BP terms are showed in the bar plot of each disease state in each tissue. Each row represents a significant GO biological process which is colored according to the -log10(p.adjust). |
| Page: 1 2 3 4 5 6 7 8 9 |
| GO ID | Tissue | Disease Stage | Description | Gene Ratio | Bg Ratio | pvalue | p.adjust | Count |
| GO:00064179 | Breast | Precancer | regulation of translation | 67/1080 | 468/18723 | 4.71e-12 | 7.64e-10 | 67 |
| GO:000641714 | Breast | IDC | regulation of translation | 74/1434 | 468/18723 | 1.67e-09 | 1.53e-07 | 74 |
| GO:000641724 | Breast | DCIS | regulation of translation | 72/1390 | 468/18723 | 2.46e-09 | 2.17e-07 | 72 |
| GO:000641727 | Esophagus | HGIN | regulation of translation | 139/2587 | 468/18723 | 1.46e-19 | 7.98e-17 | 139 |
| GO:00342496 | Esophagus | HGIN | negative regulation of cellular amide metabolic process | 66/2587 | 273/18723 | 2.74e-06 | 9.60e-05 | 66 |
| GO:00171486 | Esophagus | HGIN | negative regulation of translation | 59/2587 | 245/18723 | 1.03e-05 | 2.96e-04 | 59 |
| GO:0006417111 | Esophagus | ESCC | regulation of translation | 304/8552 | 468/18723 | 1.53e-17 | 1.33e-15 | 304 |
| GO:003424914 | Esophagus | ESCC | negative regulation of cellular amide metabolic process | 144/8552 | 273/18723 | 1.08e-02 | 3.67e-02 | 144 |
| GO:000641712 | Liver | Cirrhotic | regulation of translation | 194/4634 | 468/18723 | 7.28e-16 | 8.79e-14 | 194 |
| GO:003424911 | Liver | Cirrhotic | negative regulation of cellular amide metabolic process | 100/4634 | 273/18723 | 7.34e-06 | 1.13e-04 | 100 |
| GO:001714811 | Liver | Cirrhotic | negative regulation of translation | 87/4634 | 245/18723 | 1.01e-04 | 1.05e-03 | 87 |
| GO:000641722 | Liver | HCC | regulation of translation | 287/7958 | 468/18723 | 8.79e-17 | 8.08e-15 | 287 |
| GO:003424921 | Liver | HCC | negative regulation of cellular amide metabolic process | 144/7958 | 273/18723 | 3.80e-04 | 2.61e-03 | 144 |
| GO:001714821 | Liver | HCC | negative regulation of translation | 129/7958 | 245/18723 | 8.14e-04 | 4.87e-03 | 129 |
| GO:000641720 | Oral cavity | OSCC | regulation of translation | 274/7305 | 468/18723 | 4.39e-18 | 4.63e-16 | 274 |
| GO:00342495 | Oral cavity | OSCC | negative regulation of cellular amide metabolic process | 130/7305 | 273/18723 | 2.20e-03 | 1.00e-02 | 130 |
| GO:00171485 | Oral cavity | OSCC | negative regulation of translation | 113/7305 | 245/18723 | 1.34e-02 | 4.45e-02 | 113 |
| GO:0006417110 | Oral cavity | LP | regulation of translation | 175/4623 | 468/18723 | 4.49e-10 | 2.22e-08 | 175 |
| GO:000641729 | Skin | cSCC | regulation of translation | 226/4864 | 468/18723 | 8.78e-26 | 2.62e-23 | 226 |
| GO:003424915 | Skin | cSCC | negative regulation of cellular amide metabolic process | 104/4864 | 273/18723 | 6.44e-06 | 9.00e-05 | 104 |
| Page: 1 2 |
| Pathway ID | Tissue | Disease Stage | Description | Gene Ratio | Bg Ratio | pvalue | p.adjust | qvalue | Count |
| hsa0301018 | Breast | Precancer | Ribosome | 80/684 | 167/8465 | 7.33e-44 | 2.32e-41 | 1.77e-41 | 80 |
| hsa0301019 | Breast | Precancer | Ribosome | 80/684 | 167/8465 | 7.33e-44 | 2.32e-41 | 1.77e-41 | 80 |
| hsa0301024 | Breast | IDC | Ribosome | 83/867 | 167/8465 | 6.07e-39 | 9.87e-37 | 7.38e-37 | 83 |
| hsa0301034 | Breast | IDC | Ribosome | 83/867 | 167/8465 | 6.07e-39 | 9.87e-37 | 7.38e-37 | 83 |
| hsa0301044 | Breast | DCIS | Ribosome | 82/846 | 167/8465 | 8.69e-39 | 1.40e-36 | 1.03e-36 | 82 |
| hsa0301054 | Breast | DCIS | Ribosome | 82/846 | 167/8465 | 8.69e-39 | 1.40e-36 | 1.03e-36 | 82 |
| hsa0301039 | Esophagus | HGIN | Ribosome | 108/1383 | 167/8465 | 1.44e-45 | 4.71e-43 | 3.74e-43 | 108 |
| hsa03010115 | Esophagus | HGIN | Ribosome | 108/1383 | 167/8465 | 1.44e-45 | 4.71e-43 | 3.74e-43 | 108 |
| hsa03010211 | Esophagus | ESCC | Ribosome | 129/4205 | 167/8465 | 1.43e-13 | 3.43e-12 | 1.75e-12 | 129 |
| hsa03010310 | Esophagus | ESCC | Ribosome | 129/4205 | 167/8465 | 1.43e-13 | 3.43e-12 | 1.75e-12 | 129 |
| hsa0301022 | Liver | Cirrhotic | Ribosome | 127/2530 | 167/8465 | 2.12e-35 | 7.06e-33 | 4.35e-33 | 127 |
| hsa0301032 | Liver | Cirrhotic | Ribosome | 127/2530 | 167/8465 | 2.12e-35 | 7.06e-33 | 4.35e-33 | 127 |
| hsa0301042 | Liver | HCC | Ribosome | 128/4020 | 167/8465 | 7.32e-15 | 2.23e-13 | 1.24e-13 | 128 |
| hsa0301052 | Liver | HCC | Ribosome | 128/4020 | 167/8465 | 7.32e-15 | 2.23e-13 | 1.24e-13 | 128 |
| hsa0301030 | Oral cavity | OSCC | Ribosome | 128/3704 | 167/8465 | 2.42e-18 | 1.62e-16 | 8.25e-17 | 128 |
| hsa03010114 | Oral cavity | OSCC | Ribosome | 128/3704 | 167/8465 | 2.42e-18 | 1.62e-16 | 8.25e-17 | 128 |
| hsa03010210 | Oral cavity | LP | Ribosome | 127/2418 | 167/8465 | 1.22e-37 | 4.05e-35 | 2.61e-35 | 127 |
| hsa0301038 | Oral cavity | LP | Ribosome | 127/2418 | 167/8465 | 1.22e-37 | 4.05e-35 | 2.61e-35 | 127 |
| Page: 1 |
Top |
Cell-cell communication analysis |
| Identification of potential cell-cell interactions between two cell types and their ligand-receptor pairs for different disease states |
| Ligand | Receptor | LRpair | Pathway | Tissue | Disease Stage |
| Page: 1 |
Top |
Single-cell gene regulatory network inference analysis |
| Find out the significant the regulons (TFs) and the target genes of each regulon across cell types for different disease states |
| TF | Cell Type | Tissue | Disease Stage | Target Gene | RSS | Regulon Activity |
| ∗The dot plots of a searched regulon are shown for all cell subpopulations in each disease state of each tissue based on the regulon specific score inferred using pySCENIC and by calculating the average expression. |
| Page: 1 |
Top |
Somatic mutation of malignant transformation related genes |
| Annotation of somatic variants for genes involved in malignant transformation |
| Hugo Symbol | Variant Class | Variant Classification | dbSNP RS | HGVSc | HGVSp | HGVSp Short | SWISSPROT | BIOTYPE | SIFT | PolyPhen | Tumor Sample Barcode | Tissue | Histology | Sex | Age | Stage | Therapy Types | Drugs | Outcome |
| MRPL13 | SNV | Missense_Mutation | c.370N>G | p.Arg124Gly | p.R124G | Q9BYD1 | protein_coding | deleterious(0) | probably_damaging(0.99) | TCGA-AN-A0FL-01 | Breast | breast invasive carcinoma | Female | <65 | I/II | Unknown | Unknown | SD | |
| MRPL13 | SNV | Missense_Mutation | c.118N>G | p.Gln40Glu | p.Q40E | Q9BYD1 | protein_coding | tolerated(0.41) | benign(0.011) | TCGA-D8-A1JA-01 | Breast | breast invasive carcinoma | Female | <65 | III/IV | Chemotherapy | adriamycin | PD | |
| MRPL13 | SNV | Missense_Mutation | novel | c.406N>A | p.Asp136Asn | p.D136N | Q9BYD1 | protein_coding | deleterious(0.03) | benign(0.015) | TCGA-AA-3950-01 | Colorectum | colon adenocarcinoma | Female | >=65 | I/II | Unknown | Unknown | SD |
| MRPL13 | SNV | Missense_Mutation | novel | c.233N>T | p.Ser78Phe | p.S78F | Q9BYD1 | protein_coding | tolerated(1) | benign(0.046) | TCGA-AZ-4315-01 | Colorectum | colon adenocarcinoma | Male | <65 | I/II | Unknown | Unknown | SD |
| MRPL13 | SNV | Missense_Mutation | novel | c.307N>G | p.Ile103Val | p.I103V | Q9BYD1 | protein_coding | tolerated(0.4) | benign(0.164) | TCGA-WS-AB45-01 | Colorectum | colon adenocarcinoma | Female | <65 | I/II | Unknown | Unknown | SD |
| MRPL13 | insertion | Frame_Shift_Ins | novel | c.421_422insGTAGG | p.Leu141CysfsTer3 | p.L141Cfs*3 | Q9BYD1 | protein_coding | TCGA-AM-5820-01 | Colorectum | colon adenocarcinoma | Female | <65 | I/II | Unknown | Unknown | SD | ||
| MRPL13 | SNV | Missense_Mutation | c.77N>G | p.Gln26Arg | p.Q26R | Q9BYD1 | protein_coding | deleterious(0) | probably_damaging(0.94) | TCGA-A5-A0G9-01 | Endometrium | uterine corpus endometrioid carcinoma | Female | >=65 | I/II | Unknown | Unknown | SD | |
| MRPL13 | SNV | Missense_Mutation | novel | c.78G>T | p.Gln26His | p.Q26H | Q9BYD1 | protein_coding | deleterious(0) | probably_damaging(0.985) | TCGA-EO-A3AS-01 | Endometrium | uterine corpus endometrioid carcinoma | Female | >=65 | I/II | Unknown | Unknown | SD |
| MRPL13 | SNV | Missense_Mutation | novel | c.182N>G | p.Asn61Ser | p.N61S | Q9BYD1 | protein_coding | deleterious(0) | benign(0.378) | TCGA-EY-A1G8-01 | Endometrium | uterine corpus endometrioid carcinoma | Female | >=65 | I/II | Unknown | Unknown | SD |
| MRPL13 | SNV | Missense_Mutation | novel | c.517N>T | p.Pro173Ser | p.P173S | Q9BYD1 | protein_coding | tolerated(0.15) | benign(0.003) | TCGA-EY-A215-01 | Endometrium | uterine corpus endometrioid carcinoma | Female | <65 | I/II | Unknown | Unknown | SD |
| Page: 1 2 |
Top |
Related drugs of malignant transformation related genes |
| Identification of chemicals and drugs interact with genes involved in malignant transfromation |
| (DGIdb 4.0) |
| Entrez ID | Symbol | Category | Interaction Types | Drug Claim Name | Drug Name | PMIDs |
| Page: 1 |

Copyright 2023-Present -The University of Texas Health Science Center at Houston |