
|
|||||
|
 | |
| |
| |
| |
| |
| |
|
Gene: MRPL12 |
Gene summary for MRPL12 |
| Gene information | Species | Human | Gene symbol | MRPL12 | Gene ID | 6182 |
| Gene name | mitochondrial ribosomal protein L12 | |
| Gene Alias | 5c5-2 | |
| Cytomap | 17q25.3 | |
| Gene Type | protein-coding | GO ID | GO:0000959 | UniProtAcc | P52815 |
Top |
Malignant transformation analysis |
| Identification of the aberrant gene expression in precancerous and cancerous lesions by comparing the gene expression of stem-like cells in diseased tissues with normal stem cells |
| Entrez ID | Symbol | Replicates | Species | Organ | Tissue | Adj P-value | Log2FC | Malignancy |
| 6182 | MRPL12 | GSM4909282 | Human | Breast | IDC | 2.65e-03 | 3.06e-01 | -0.0288 |
| 6182 | MRPL12 | GSM4909286 | Human | Breast | IDC | 7.70e-11 | 3.35e-01 | 0.1081 |
| 6182 | MRPL12 | GSM4909287 | Human | Breast | IDC | 1.67e-03 | 3.04e-01 | 0.2057 |
| 6182 | MRPL12 | GSM4909289 | Human | Breast | IDC | 2.81e-08 | 7.13e-01 | 0.1064 |
| 6182 | MRPL12 | GSM4909290 | Human | Breast | IDC | 3.88e-12 | 4.50e-01 | 0.2096 |
| 6182 | MRPL12 | GSM4909296 | Human | Breast | IDC | 1.41e-02 | -2.67e-02 | 0.1524 |
| 6182 | MRPL12 | GSM4909297 | Human | Breast | IDC | 7.54e-04 | -1.12e-01 | 0.1517 |
| 6182 | MRPL12 | GSM4909308 | Human | Breast | IDC | 3.04e-03 | 1.66e-01 | 0.158 |
| 6182 | MRPL12 | GSM4909311 | Human | Breast | IDC | 1.19e-19 | -7.23e-02 | 0.1534 |
| 6182 | MRPL12 | GSM4909312 | Human | Breast | IDC | 4.00e-05 | 3.17e-02 | 0.1552 |
| 6182 | MRPL12 | GSM4909317 | Human | Breast | IDC | 1.79e-04 | 2.06e-01 | 0.1355 |
| 6182 | MRPL12 | GSM4909319 | Human | Breast | IDC | 2.12e-30 | 2.17e-01 | 0.1563 |
| 6182 | MRPL12 | GSM4909320 | Human | Breast | IDC | 1.85e-19 | 7.88e-01 | 0.1575 |
| 6182 | MRPL12 | GSM4909321 | Human | Breast | IDC | 3.91e-16 | 2.64e-01 | 0.1559 |
| 6182 | MRPL12 | brca1 | Human | Breast | Precancer | 6.22e-05 | 3.52e-01 | -0.0338 |
| 6182 | MRPL12 | brca2 | Human | Breast | Precancer | 5.09e-03 | 2.54e-01 | -0.024 |
| 6182 | MRPL12 | P1 | Human | Breast | IDC | 1.16e-02 | -1.23e-01 | 0.1527 |
| 6182 | MRPL12 | P2 | Human | Breast | IDC | 1.39e-03 | 3.36e-01 | 0.21 |
| 6182 | MRPL12 | DCIS2 | Human | Breast | DCIS | 7.53e-40 | -2.62e-02 | 0.0085 |
| 6182 | MRPL12 | HTA11_2487_2000001011 | Human | Colorectum | SER | 1.03e-09 | 2.83e-01 | -0.1808 |
| Page: 1 2 3 4 5 6 7 8 9 10 |
| Tissue | Expression Dynamics | Abbreviation |
| Breast | 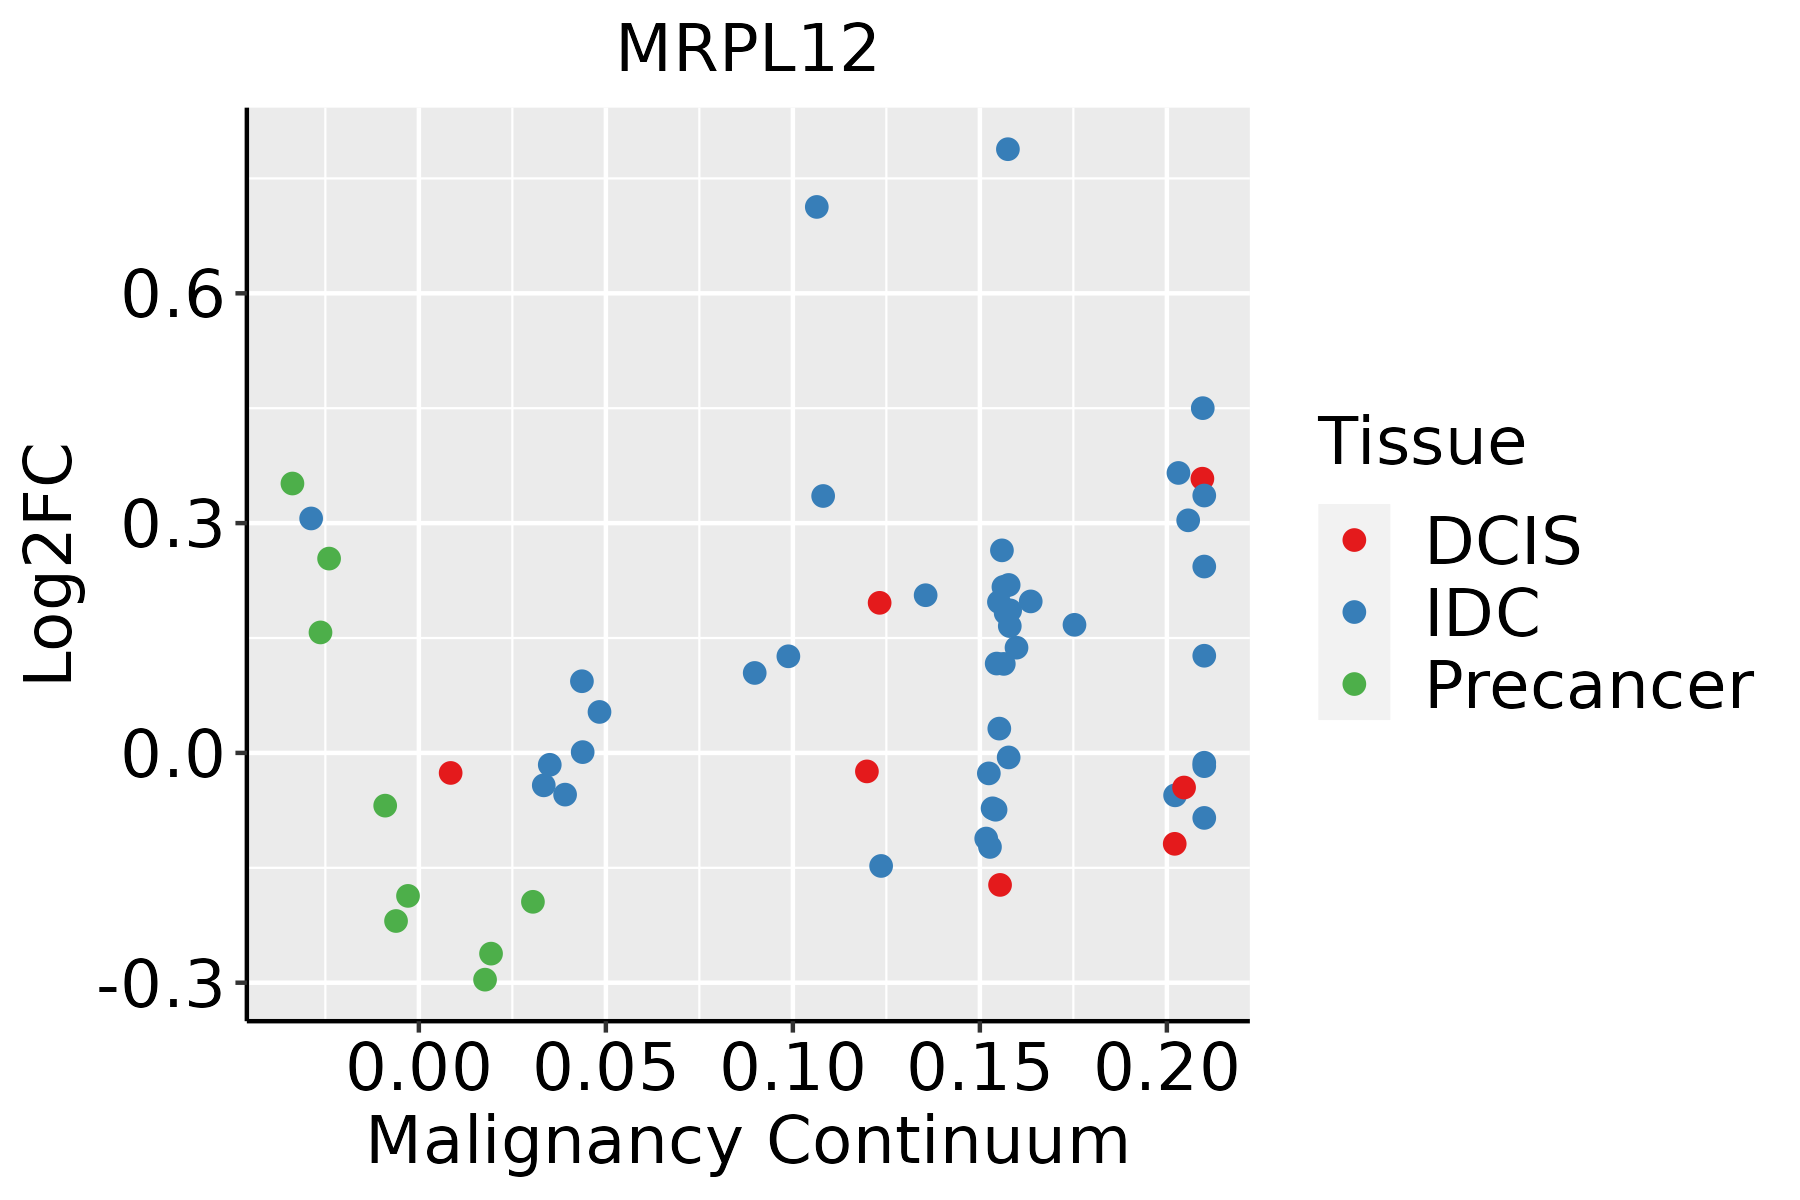 | IDC: Invasive ductal carcinoma |
| DCIS: Ductal carcinoma in situ | ||
| Precancer(BRCA1-mut): Precancerous lesion from BRCA1 mutation carriers | ||
| Colorectum (GSE201348) |  | FAP: Familial adenomatous polyposis |
| CRC: Colorectal cancer | ||
| Colorectum (HTA11) |  | AD: Adenomas |
| SER: Sessile serrated lesions | ||
| MSI-H: Microsatellite-high colorectal cancer | ||
| MSS: Microsatellite stable colorectal cancer | ||
| Esophagus |  | ESCC: Esophageal squamous cell carcinoma |
| HGIN: High-grade intraepithelial neoplasias | ||
| LGIN: Low-grade intraepithelial neoplasias | ||
| GC | 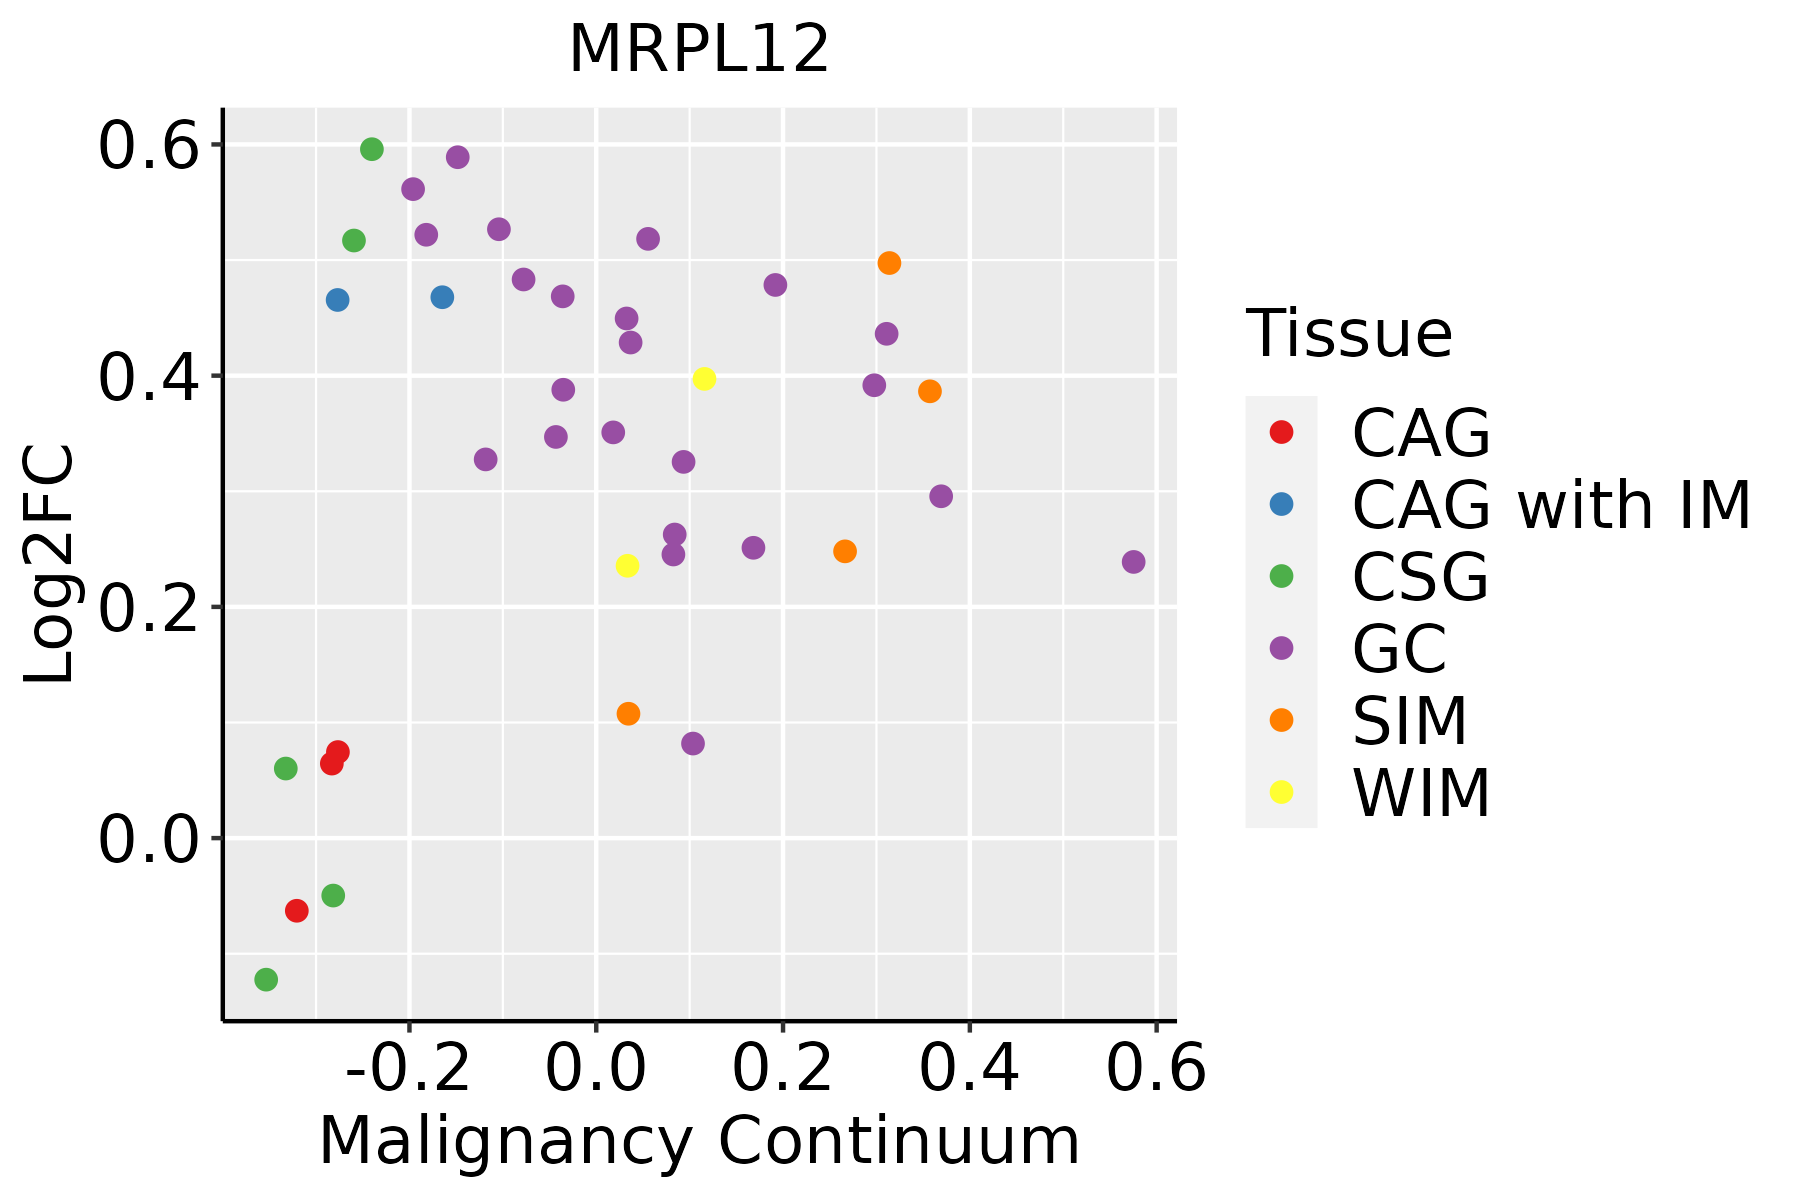 | CAG: Chronic atrophic gastritis |
| CAG with IM: Chronic atrophic gastritis with intestinal metaplasia | ||
| CSG: Chronic superficial gastritis | ||
| GC: Gastric cancer | ||
| SIM: Severe intestinal metaplasia | ||
| WIM: Wild intestinal metaplasia | ||
| Liver | 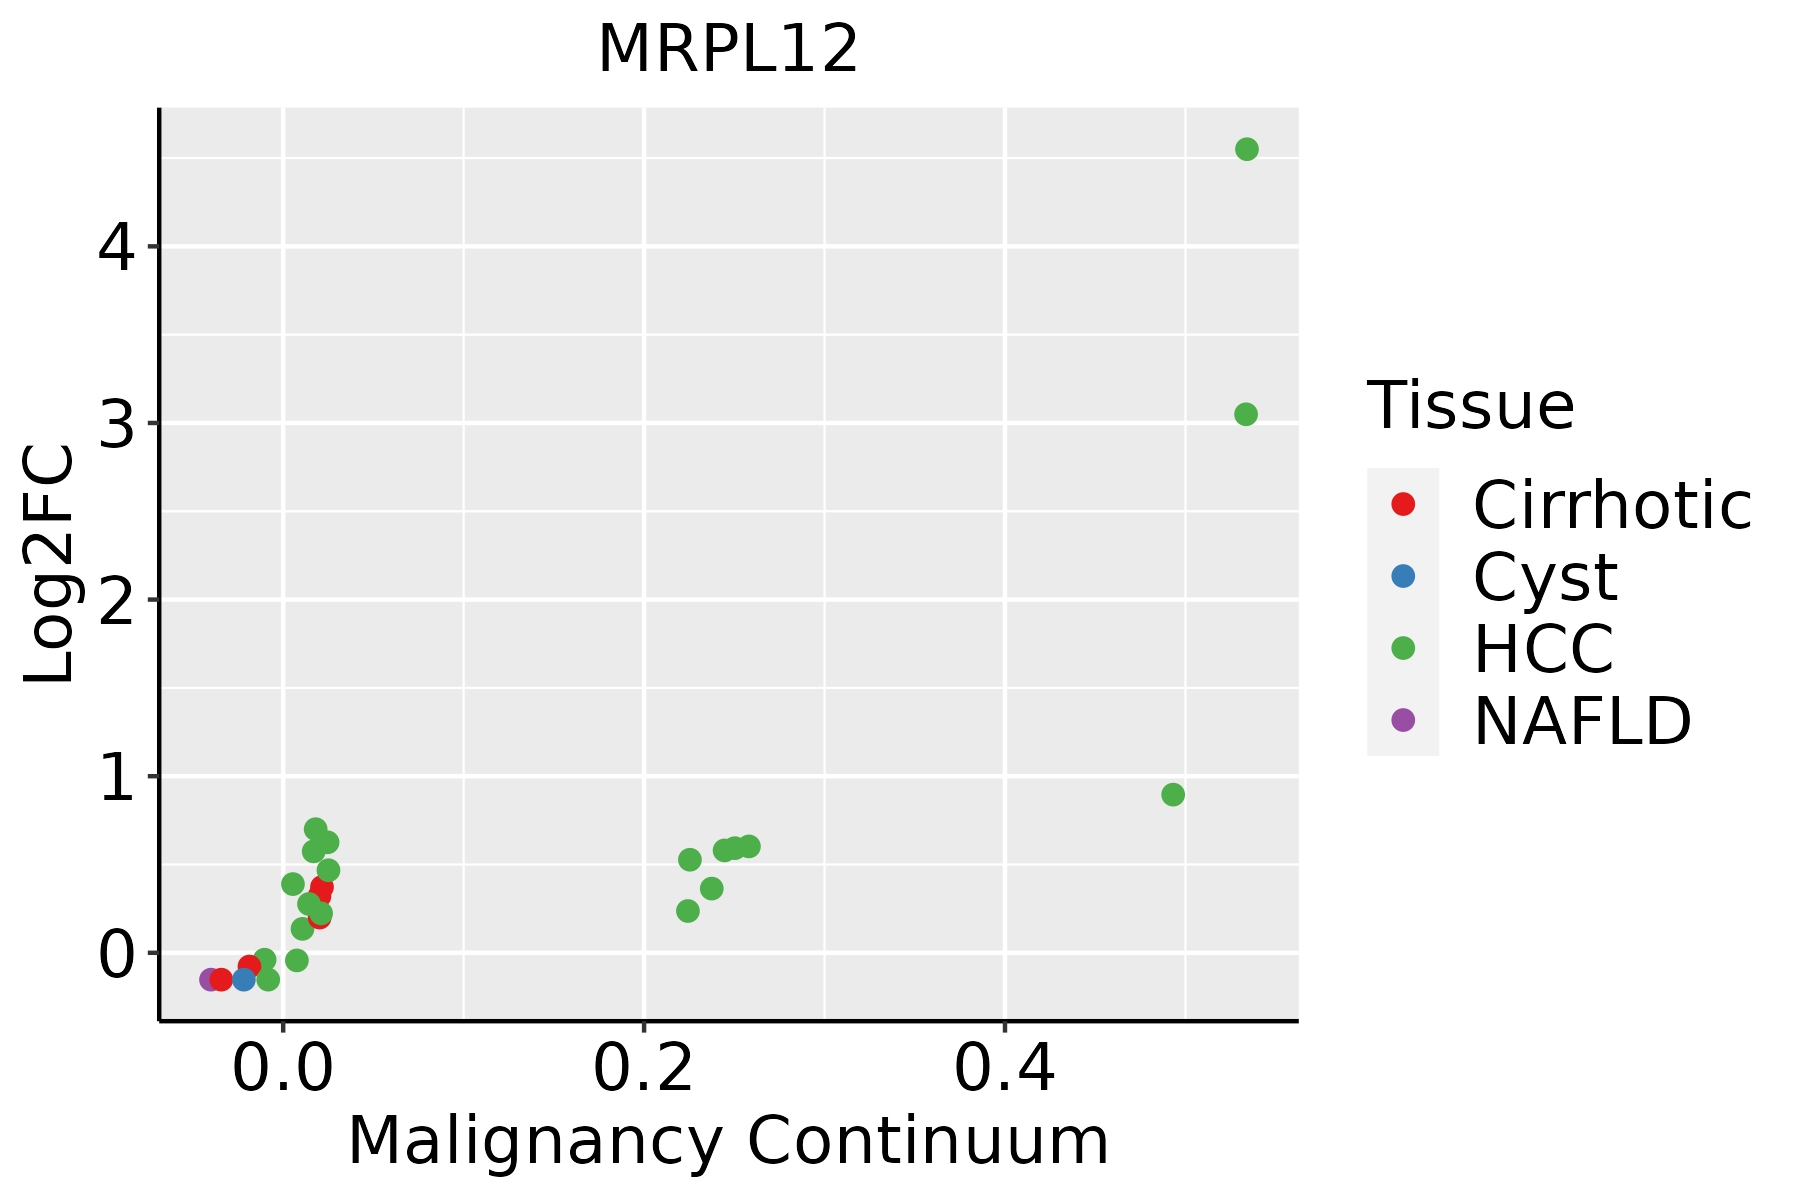 | HCC: Hepatocellular carcinoma |
| NAFLD: Non-alcoholic fatty liver disease | ||
| Oral Cavity |  | EOLP: Erosive Oral lichen planus |
| LP: leukoplakia | ||
| NEOLP: Non-erosive oral lichen planus | ||
| OSCC: Oral squamous cell carcinoma | ||
| Prostate | 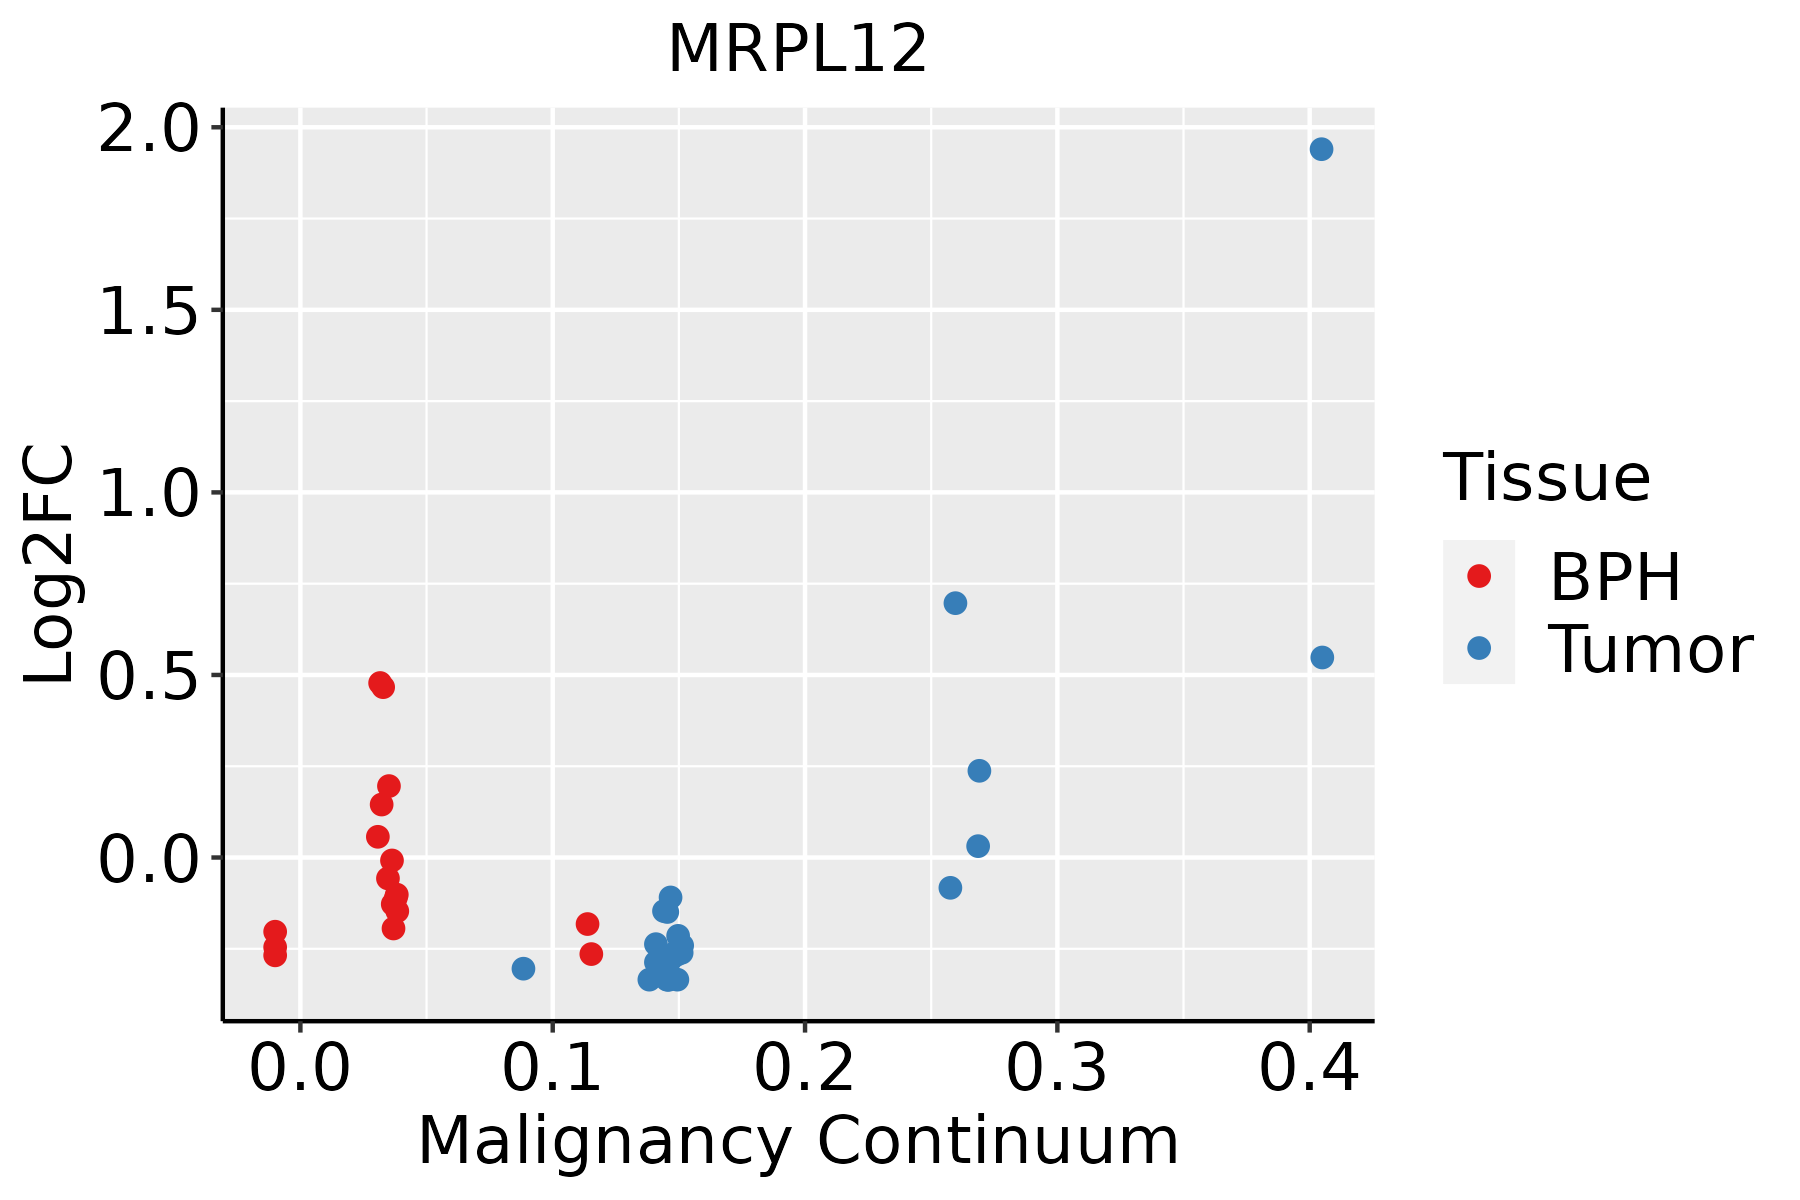 | BPH: Benign Prostatic Hyperplasia |
| Skin | 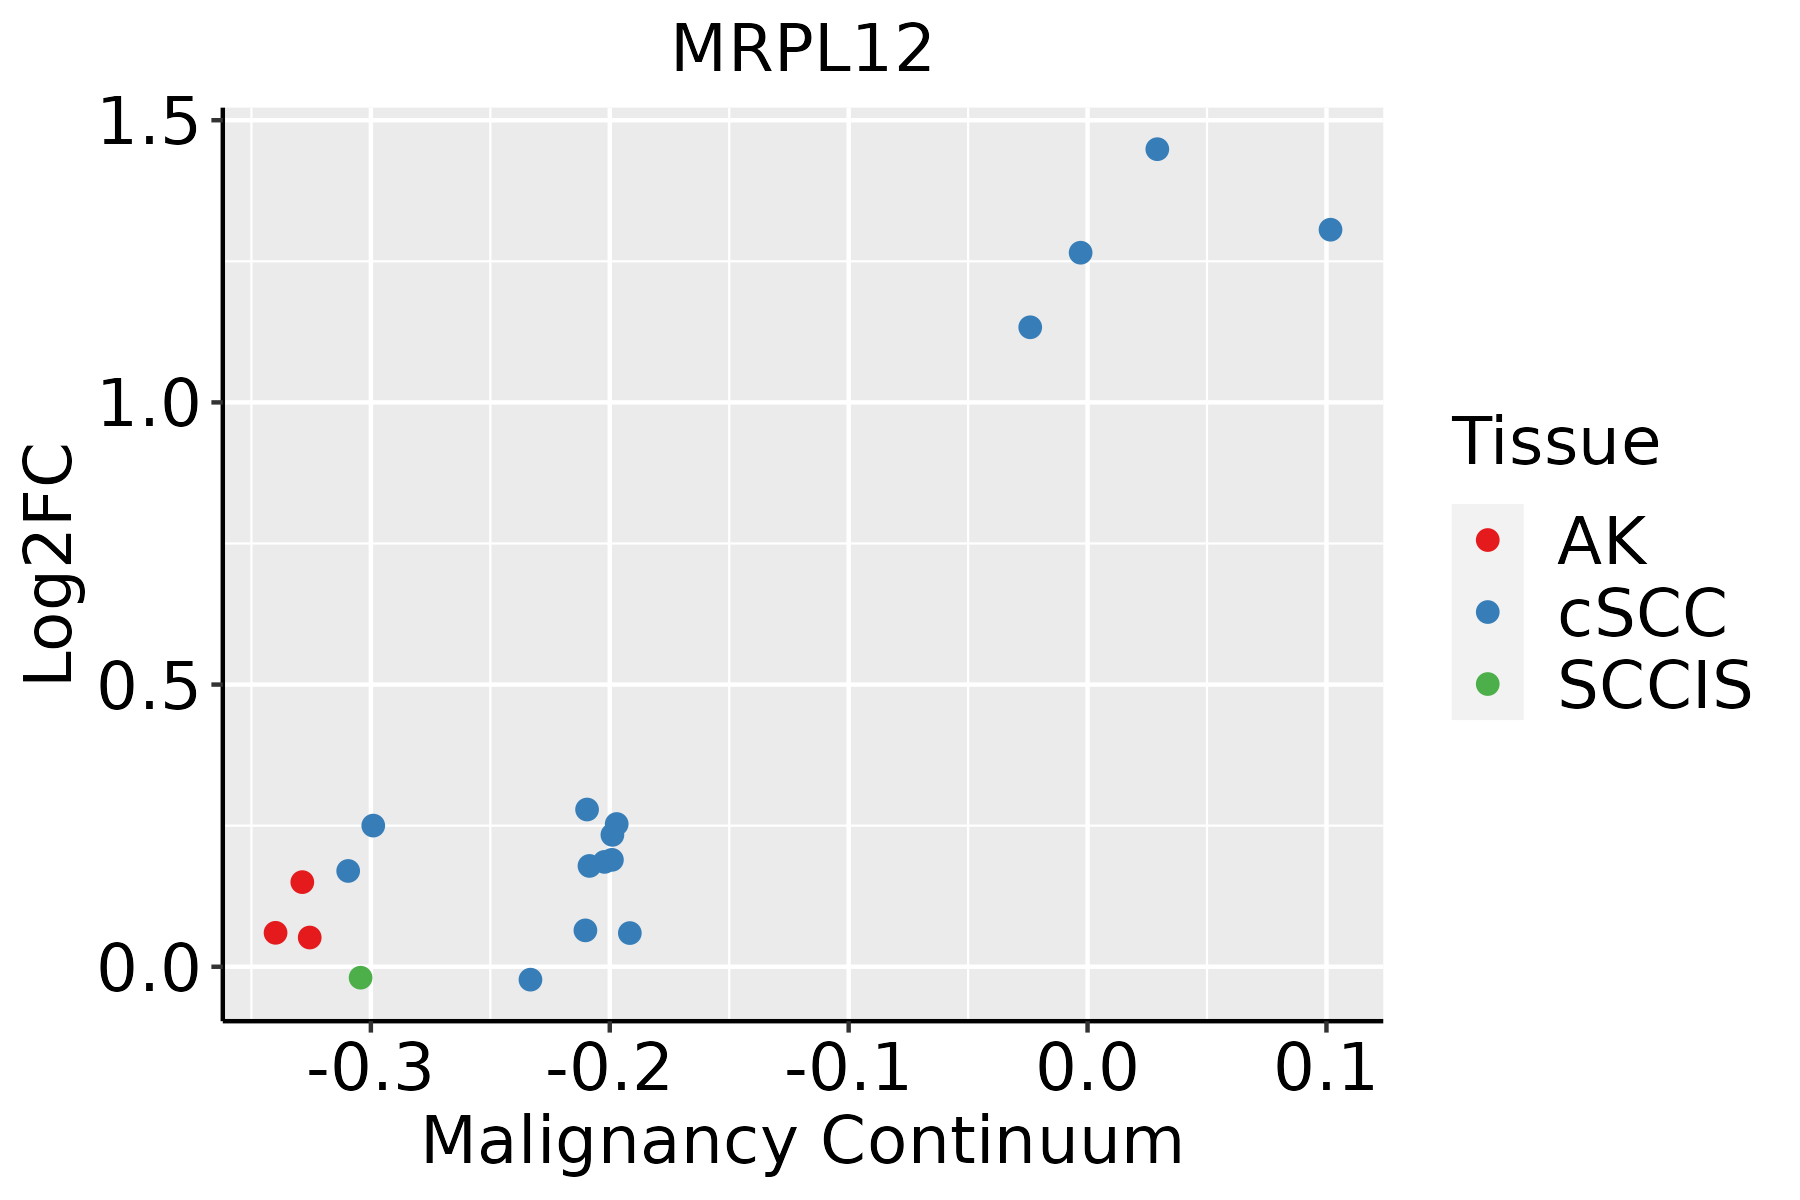 | AK: Actinic keratosis |
| cSCC: Cutaneous squamous cell carcinoma | ||
| SCCIS:squamous cell carcinoma in situ | ||
| Thyroid | 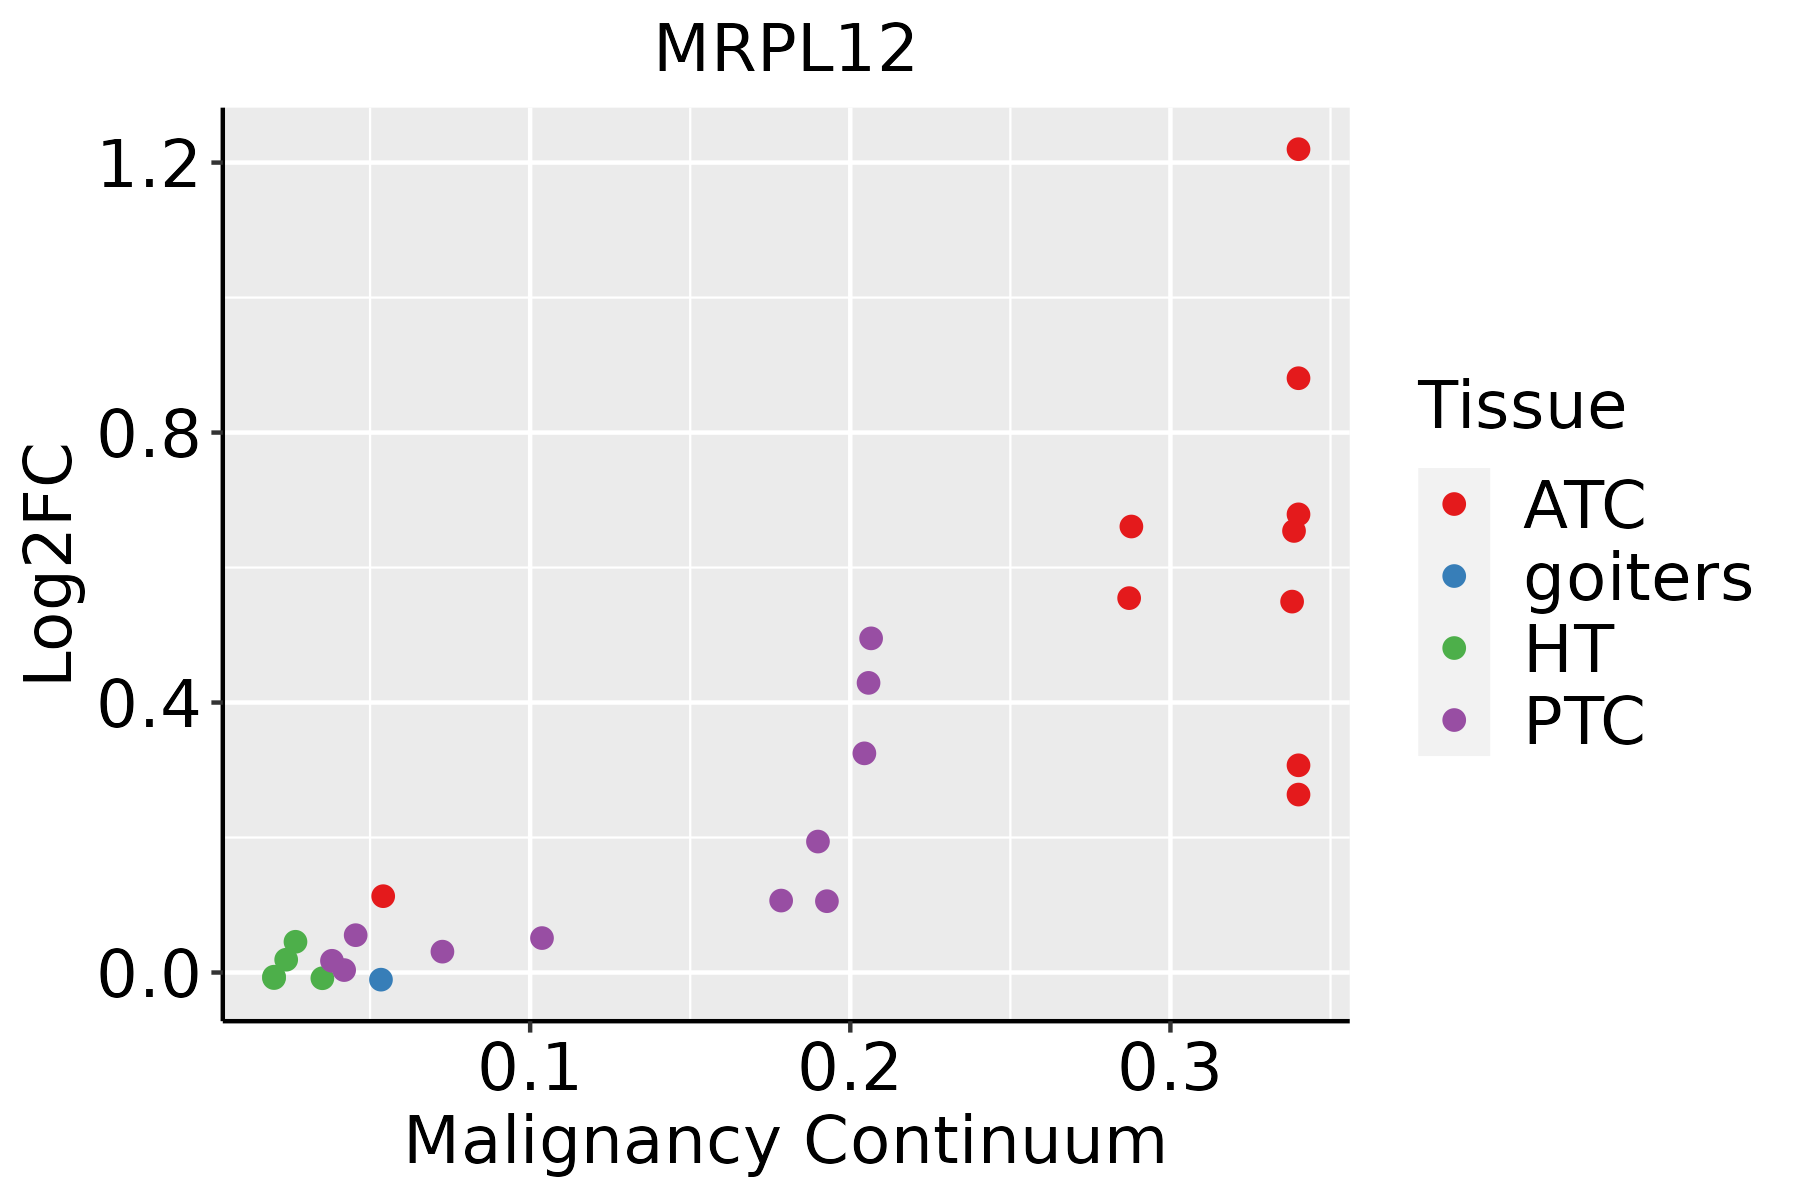 | ATC: Anaplastic thyroid cancer |
| HT: Hashimoto's thyroiditis | ||
| PTC: Papillary thyroid cancer |
| ∗log2FC in expression of this searched gene in stem-like cells from each diseased tissue sample relative to stem-like cells in normal samples in each tissue plotted against the malignancy continuum. Samples are colored based on if they are from different disease stage. |
Top |
Malignant transformation related pathway analysis |
| Find out the enriched GO biological processes and KEGG pathways involved in transition from healthy to precancer to cancer |
| Tissue | Disease Stage | Enriched GO biological Processes |
| Colorectum | AD |  |
| Colorectum | SER |  |
| Colorectum | MSS |  |
| Colorectum | MSI-H |  |
| Colorectum | FAP |  |
| ∗Top 15 enriched GO BP terms are showed in the bar plot of each disease state in each tissue. Each row represents a significant GO biological process which is colored according to the -log10(p.adjust). |
| Page: 1 2 3 4 5 6 7 8 9 |
| GO ID | Tissue | Disease Stage | Description | Gene Ratio | Bg Ratio | pvalue | p.adjust | Count |
| GO:01400534 | Esophagus | HGIN | mitochondrial gene expression | 27/2587 | 108/18723 | 1.34e-03 | 1.57e-02 | 27 |
| GO:014005313 | Esophagus | ESCC | mitochondrial gene expression | 93/8552 | 108/18723 | 1.96e-18 | 2.03e-16 | 93 |
| GO:00009592 | Esophagus | ESCC | mitochondrial RNA metabolic process | 39/8552 | 49/18723 | 1.20e-06 | 1.49e-05 | 39 |
| GO:0140053 | Liver | Cirrhotic | mitochondrial gene expression | 49/4634 | 108/18723 | 2.35e-06 | 4.31e-05 | 49 |
| GO:01400531 | Liver | HCC | mitochondrial gene expression | 82/7958 | 108/18723 | 1.49e-12 | 7.20e-11 | 82 |
| GO:0000959 | Liver | HCC | mitochondrial RNA metabolic process | 30/7958 | 49/18723 | 6.31e-03 | 2.57e-02 | 30 |
| GO:01400533 | Oral cavity | OSCC | mitochondrial gene expression | 78/7305 | 108/18723 | 2.37e-12 | 9.86e-11 | 78 |
| GO:00009591 | Oral cavity | OSCC | mitochondrial RNA metabolic process | 29/7305 | 49/18723 | 3.33e-03 | 1.42e-02 | 29 |
| GO:014005312 | Oral cavity | LP | mitochondrial gene expression | 53/4623 | 108/18723 | 3.54e-08 | 1.27e-06 | 53 |
| GO:01400532 | Prostate | BPH | mitochondrial gene expression | 29/3107 | 108/18723 | 4.68e-03 | 2.25e-02 | 29 |
| GO:014005311 | Prostate | Tumor | mitochondrial gene expression | 31/3246 | 108/18723 | 2.31e-03 | 1.30e-02 | 31 |
| GO:01400535 | Skin | cSCC | mitochondrial gene expression | 56/4864 | 108/18723 | 8.06e-09 | 2.56e-07 | 56 |
| GO:01400536 | Thyroid | PTC | mitochondrial gene expression | 51/5968 | 108/18723 | 6.04e-04 | 3.83e-03 | 51 |
| GO:014005314 | Thyroid | ATC | mitochondrial gene expression | 51/6293 | 108/18723 | 2.26e-03 | 1.06e-02 | 51 |
| Page: 1 |
| Pathway ID | Tissue | Disease Stage | Description | Gene Ratio | Bg Ratio | pvalue | p.adjust | qvalue | Count |
| hsa0301018 | Breast | Precancer | Ribosome | 80/684 | 167/8465 | 7.33e-44 | 2.32e-41 | 1.77e-41 | 80 |
| hsa0301019 | Breast | Precancer | Ribosome | 80/684 | 167/8465 | 7.33e-44 | 2.32e-41 | 1.77e-41 | 80 |
| hsa0301024 | Breast | IDC | Ribosome | 83/867 | 167/8465 | 6.07e-39 | 9.87e-37 | 7.38e-37 | 83 |
| hsa0301034 | Breast | IDC | Ribosome | 83/867 | 167/8465 | 6.07e-39 | 9.87e-37 | 7.38e-37 | 83 |
| hsa0301044 | Breast | DCIS | Ribosome | 82/846 | 167/8465 | 8.69e-39 | 1.40e-36 | 1.03e-36 | 82 |
| hsa0301054 | Breast | DCIS | Ribosome | 82/846 | 167/8465 | 8.69e-39 | 1.40e-36 | 1.03e-36 | 82 |
| hsa03010 | Colorectum | AD | Ribosome | 96/2092 | 167/8465 | 8.28e-20 | 5.54e-18 | 3.54e-18 | 96 |
| hsa030101 | Colorectum | AD | Ribosome | 96/2092 | 167/8465 | 8.28e-20 | 5.54e-18 | 3.54e-18 | 96 |
| hsa030102 | Colorectum | SER | Ribosome | 92/1580 | 167/8465 | 2.21e-26 | 3.66e-24 | 2.66e-24 | 92 |
| hsa030103 | Colorectum | SER | Ribosome | 92/1580 | 167/8465 | 2.21e-26 | 3.66e-24 | 2.66e-24 | 92 |
| hsa030104 | Colorectum | MSS | Ribosome | 96/1875 | 167/8465 | 1.82e-23 | 2.03e-21 | 1.24e-21 | 96 |
| hsa030105 | Colorectum | MSS | Ribosome | 96/1875 | 167/8465 | 1.82e-23 | 2.03e-21 | 1.24e-21 | 96 |
| hsa030106 | Colorectum | MSI-H | Ribosome | 87/797 | 167/8465 | 5.55e-46 | 1.80e-43 | 1.51e-43 | 87 |
| hsa030107 | Colorectum | MSI-H | Ribosome | 87/797 | 167/8465 | 5.55e-46 | 1.80e-43 | 1.51e-43 | 87 |
| hsa0301039 | Esophagus | HGIN | Ribosome | 108/1383 | 167/8465 | 1.44e-45 | 4.71e-43 | 3.74e-43 | 108 |
| hsa03010115 | Esophagus | HGIN | Ribosome | 108/1383 | 167/8465 | 1.44e-45 | 4.71e-43 | 3.74e-43 | 108 |
| hsa03010211 | Esophagus | ESCC | Ribosome | 129/4205 | 167/8465 | 1.43e-13 | 3.43e-12 | 1.75e-12 | 129 |
| hsa03010310 | Esophagus | ESCC | Ribosome | 129/4205 | 167/8465 | 1.43e-13 | 3.43e-12 | 1.75e-12 | 129 |
| hsa0301022 | Liver | Cirrhotic | Ribosome | 127/2530 | 167/8465 | 2.12e-35 | 7.06e-33 | 4.35e-33 | 127 |
| hsa0301032 | Liver | Cirrhotic | Ribosome | 127/2530 | 167/8465 | 2.12e-35 | 7.06e-33 | 4.35e-33 | 127 |
| Page: 1 2 |
Top |
Cell-cell communication analysis |
| Identification of potential cell-cell interactions between two cell types and their ligand-receptor pairs for different disease states |
| Ligand | Receptor | LRpair | Pathway | Tissue | Disease Stage |
| Page: 1 |
Top |
Single-cell gene regulatory network inference analysis |
| Find out the significant the regulons (TFs) and the target genes of each regulon across cell types for different disease states |
| TF | Cell Type | Tissue | Disease Stage | Target Gene | RSS | Regulon Activity |
| ∗The dot plots of a searched regulon are shown for all cell subpopulations in each disease state of each tissue based on the regulon specific score inferred using pySCENIC and by calculating the average expression. |
| Page: 1 |
Top |
Somatic mutation of malignant transformation related genes |
| Annotation of somatic variants for genes involved in malignant transformation |
| Hugo Symbol | Variant Class | Variant Classification | dbSNP RS | HGVSc | HGVSp | HGVSp Short | SWISSPROT | BIOTYPE | SIFT | PolyPhen | Tumor Sample Barcode | Tissue | Histology | Sex | Age | Stage | Therapy Types | Drugs | Outcome |
| MRPL12 | insertion | Frame_Shift_Ins | rs769882870 | c.179_180insC | p.Lys63GlnfsTer118 | p.K63Qfs*118 | P52815 | protein_coding | TCGA-A2-A0T0-01 | Breast | breast invasive carcinoma | Female | <65 | I/II | Chemotherapy | taxotere | SD | ||
| MRPL12 | insertion | Frame_Shift_Ins | novel | c.132_133insCTCCCTTGGCCTCAGCCTTTTCCGCAGCAAAGGCCCA | p.Cys45LeufsTer14 | p.C45Lfs*14 | P52815 | protein_coding | TCGA-BH-A0HF-01 | Breast | breast invasive carcinoma | Female | >=65 | I/II | Hormone Therapy | arimidex | SD | ||
| MRPL12 | SNV | Missense_Mutation | rs577290119 | c.542N>T | p.Ala181Val | p.A181V | P52815 | protein_coding | deleterious(0) | probably_damaging(0.991) | TCGA-2W-A8YY-01 | Cervix | cervical & endocervical cancer | Female | <65 | I/II | Chemotherapy | cisplatin | CR |
| MRPL12 | SNV | Missense_Mutation | rs765933080 | c.347C>T | p.Ala116Val | p.A116V | P52815 | protein_coding | tolerated(0.19) | benign(0) | TCGA-AZ-4313-01 | Colorectum | colon adenocarcinoma | Female | <65 | I/II | Unknown | Unknown | SD |
| MRPL12 | SNV | Missense_Mutation | c.83T>C | p.Val28Ala | p.V28A | P52815 | protein_coding | tolerated(0.56) | benign(0) | TCGA-G4-6588-01 | Colorectum | colon adenocarcinoma | Female | <65 | I/II | Unknown | Unknown | SD | |
| MRPL12 | SNV | Missense_Mutation | c.301N>T | p.Gly101Cys | p.G101C | P52815 | protein_coding | deleterious(0.01) | probably_damaging(0.982) | TCGA-NH-A5IV-01 | Colorectum | colon adenocarcinoma | Female | >=65 | I/II | Unknown | Unknown | SD | |
| MRPL12 | deletion | Frame_Shift_Del | c.167delN | p.Lys58ArgfsTer29 | p.K58Rfs*29 | P52815 | protein_coding | TCGA-G4-6628-01 | Colorectum | colon adenocarcinoma | Male | >=65 | I/II | Unknown | Unknown | SD | |||
| MRPL12 | insertion | Frame_Shift_Ins | novel | c.166_167insC | p.Lys58GlnfsTer123 | p.K58Qfs*123 | P52815 | protein_coding | TCGA-WS-AB45-01 | Colorectum | colon adenocarcinoma | Female | <65 | I/II | Unknown | Unknown | SD | ||
| MRPL12 | SNV | Missense_Mutation | novel | c.518N>C | p.Lys173Thr | p.K173T | P52815 | protein_coding | deleterious(0) | probably_damaging(0.961) | TCGA-AX-A3G9-01 | Endometrium | uterine corpus endometrioid carcinoma | Female | <65 | III/IV | Chemotherapy | carboplatin | SD |
| MRPL12 | SNV | Missense_Mutation | rs765933080 | c.347N>T | p.Ala116Val | p.A116V | P52815 | protein_coding | tolerated(0.19) | benign(0) | TCGA-FI-A2D0-01 | Endometrium | uterine corpus endometrioid carcinoma | Female | <65 | I/II | Unknown | Unknown | SD |
| Page: 1 2 3 |
Top |
Related drugs of malignant transformation related genes |
| Identification of chemicals and drugs interact with genes involved in malignant transfromation |
| (DGIdb 4.0) |
| Entrez ID | Symbol | Category | Interaction Types | Drug Claim Name | Drug Name | PMIDs |
| Page: 1 |

Copyright 2023-Present -The University of Texas Health Science Center at Houston |