
|
|||||
|
 | |
| |
| |
| |
| |
| |
|
Gene: MRPL11 |
Gene summary for MRPL11 |
| Gene information | Species | Human | Gene symbol | MRPL11 | Gene ID | 65003 |
| Gene name | mitochondrial ribosomal protein L11 | |
| Gene Alias | CGI-113 | |
| Cytomap | 11q13.2 | |
| Gene Type | protein-coding | GO ID | GO:0006412 | UniProtAcc | Q9Y3B7 |
Top |
Malignant transformation analysis |
| Identification of the aberrant gene expression in precancerous and cancerous lesions by comparing the gene expression of stem-like cells in diseased tissues with normal stem cells |
| Entrez ID | Symbol | Replicates | Species | Organ | Tissue | Adj P-value | Log2FC | Malignancy |
| 65003 | MRPL11 | HTA11_3410_2000001011 | Human | Colorectum | AD | 3.28e-05 | 1.74e-01 | 0.0155 |
| 65003 | MRPL11 | HTA11_2487_2000001011 | Human | Colorectum | SER | 6.82e-09 | 3.43e-01 | -0.1808 |
| 65003 | MRPL11 | HTA11_1938_2000001011 | Human | Colorectum | AD | 4.23e-06 | 2.47e-01 | -0.0811 |
| 65003 | MRPL11 | HTA11_78_2000001011 | Human | Colorectum | AD | 1.39e-05 | 2.55e-01 | -0.1088 |
| 65003 | MRPL11 | HTA11_347_2000001011 | Human | Colorectum | AD | 1.61e-08 | 1.98e-01 | -0.1954 |
| 65003 | MRPL11 | HTA11_411_2000001011 | Human | Colorectum | SER | 1.25e-03 | 5.41e-01 | -0.2602 |
| 65003 | MRPL11 | HTA11_3361_2000001011 | Human | Colorectum | AD | 9.90e-03 | 1.84e-01 | -0.1207 |
| 65003 | MRPL11 | HTA11_83_2000001011 | Human | Colorectum | SER | 3.47e-04 | 1.89e-01 | -0.1526 |
| 65003 | MRPL11 | HTA11_696_2000001011 | Human | Colorectum | AD | 2.42e-17 | 3.32e-01 | -0.1464 |
| 65003 | MRPL11 | HTA11_866_2000001011 | Human | Colorectum | AD | 1.72e-11 | 2.90e-01 | -0.1001 |
| 65003 | MRPL11 | HTA11_1391_2000001011 | Human | Colorectum | AD | 1.18e-10 | 3.92e-01 | -0.059 |
| 65003 | MRPL11 | HTA11_2992_2000001011 | Human | Colorectum | SER | 7.88e-04 | 3.27e-01 | -0.1706 |
| 65003 | MRPL11 | HTA11_546_2000001011 | Human | Colorectum | AD | 3.49e-07 | 3.32e-01 | -0.0842 |
| 65003 | MRPL11 | HTA11_866_3004761011 | Human | Colorectum | AD | 1.93e-13 | 3.67e-01 | 0.096 |
| 65003 | MRPL11 | HTA11_4255_2000001011 | Human | Colorectum | SER | 5.85e-03 | 3.07e-01 | 0.0446 |
| 65003 | MRPL11 | HTA11_8622_2000001021 | Human | Colorectum | SER | 1.79e-05 | 3.37e-01 | 0.0528 |
| 65003 | MRPL11 | HTA11_7663_2000001011 | Human | Colorectum | SER | 7.29e-07 | 4.48e-01 | 0.0131 |
| 65003 | MRPL11 | HTA11_10623_2000001011 | Human | Colorectum | AD | 3.53e-02 | 2.89e-01 | -0.0177 |
| 65003 | MRPL11 | HTA11_6801_2000001011 | Human | Colorectum | SER | 1.82e-03 | 6.40e-01 | 0.0171 |
| 65003 | MRPL11 | HTA11_10711_2000001011 | Human | Colorectum | AD | 1.34e-09 | 3.42e-01 | 0.0338 |
| Page: 1 2 3 4 5 6 7 8 |
| Tissue | Expression Dynamics | Abbreviation |
| Colorectum (GSE201348) |  | FAP: Familial adenomatous polyposis |
| CRC: Colorectal cancer | ||
| Colorectum (HTA11) |  | AD: Adenomas |
| SER: Sessile serrated lesions | ||
| MSI-H: Microsatellite-high colorectal cancer | ||
| MSS: Microsatellite stable colorectal cancer | ||
| Esophagus | 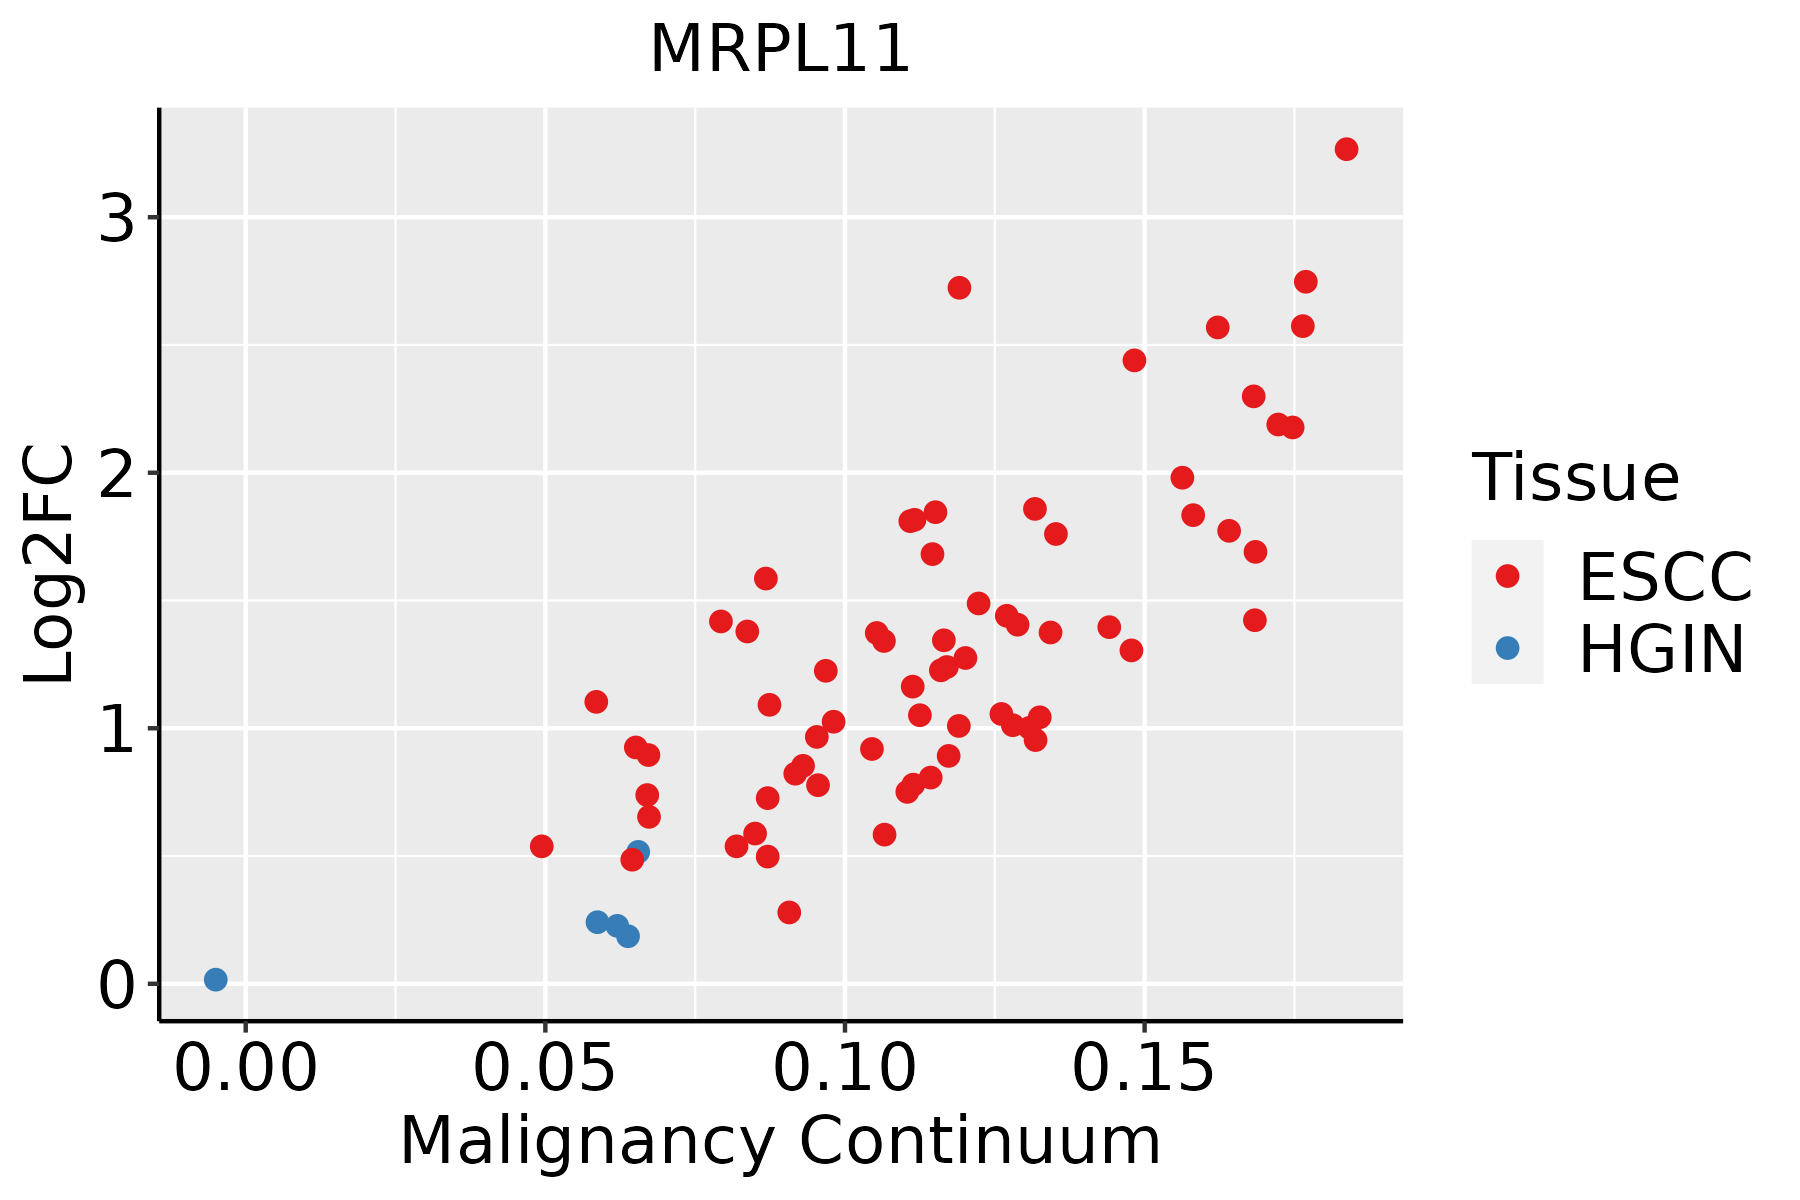 | ESCC: Esophageal squamous cell carcinoma |
| HGIN: High-grade intraepithelial neoplasias | ||
| LGIN: Low-grade intraepithelial neoplasias | ||
| Liver | 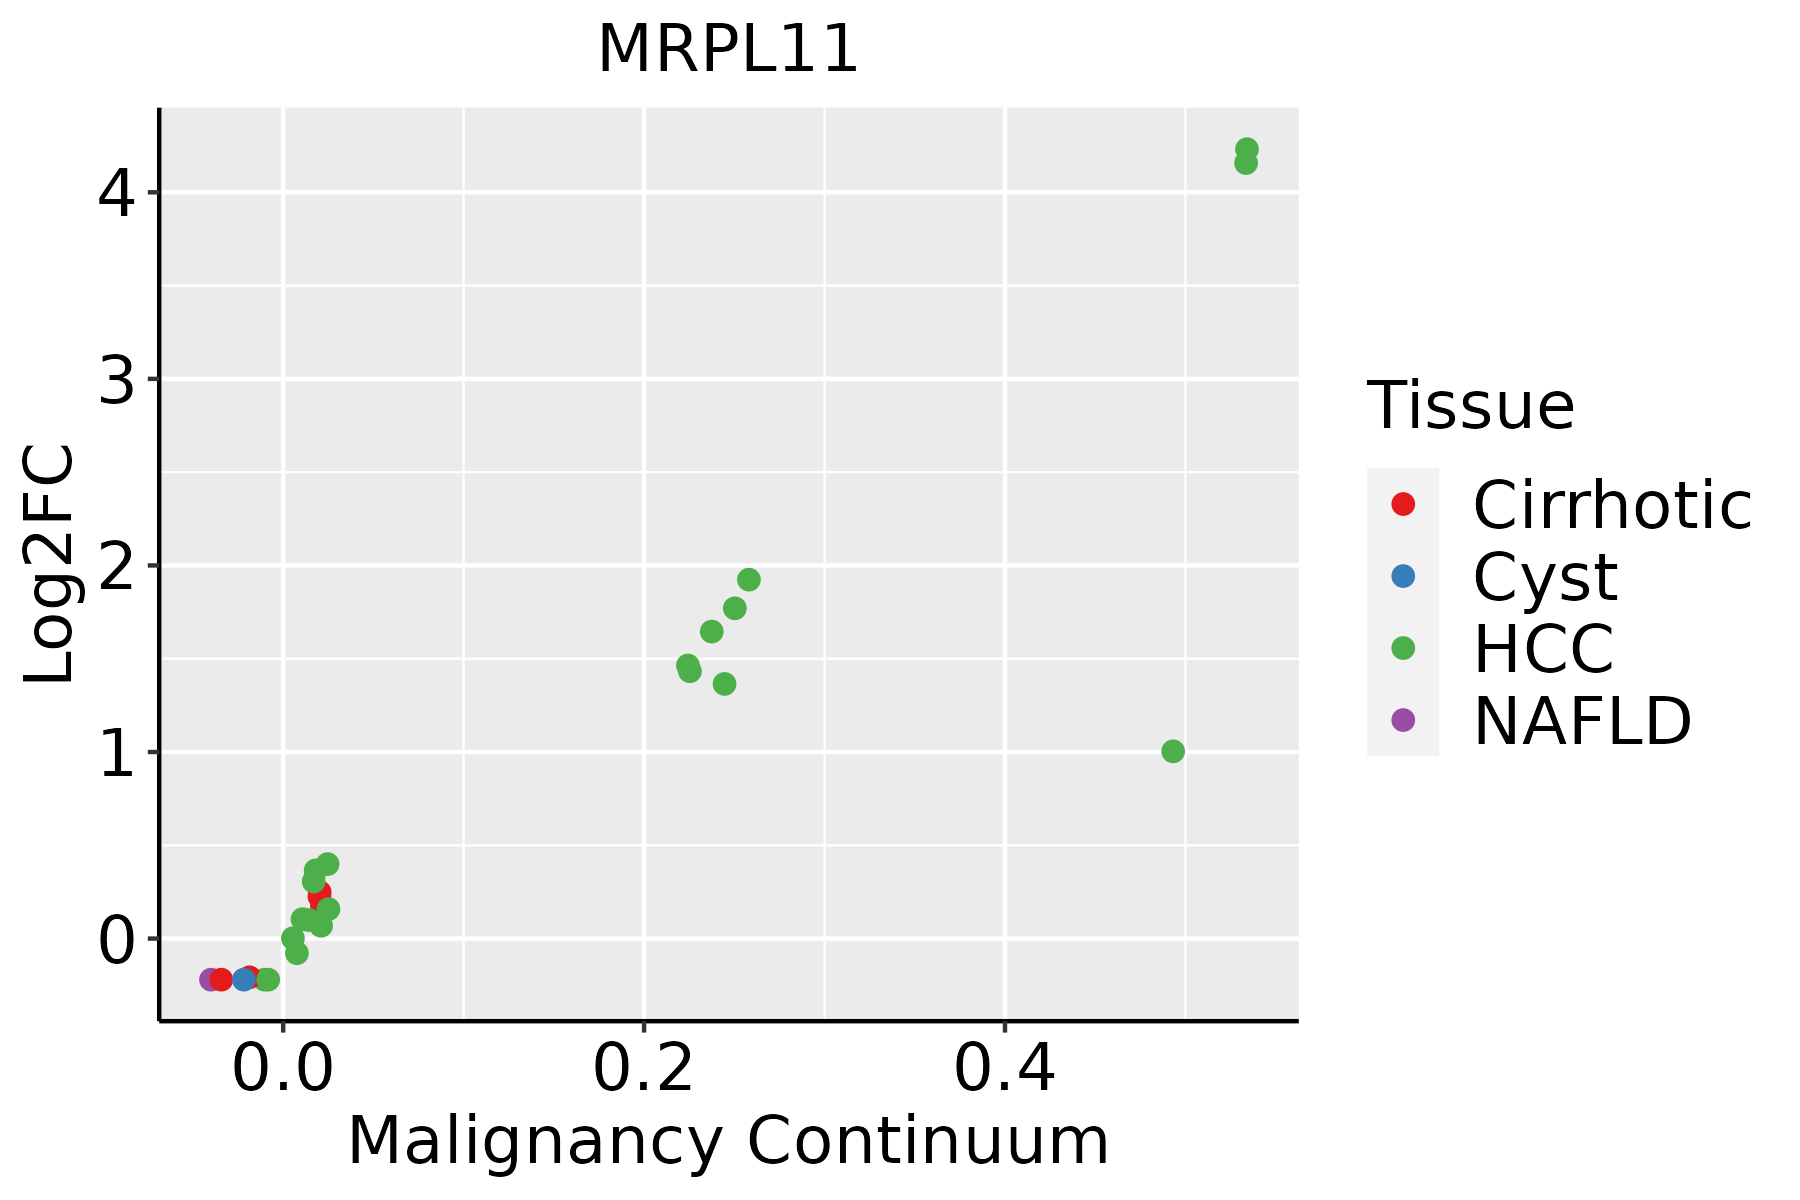 | HCC: Hepatocellular carcinoma |
| NAFLD: Non-alcoholic fatty liver disease | ||
| Oral Cavity |  | EOLP: Erosive Oral lichen planus |
| LP: leukoplakia | ||
| NEOLP: Non-erosive oral lichen planus | ||
| OSCC: Oral squamous cell carcinoma | ||
| Skin | 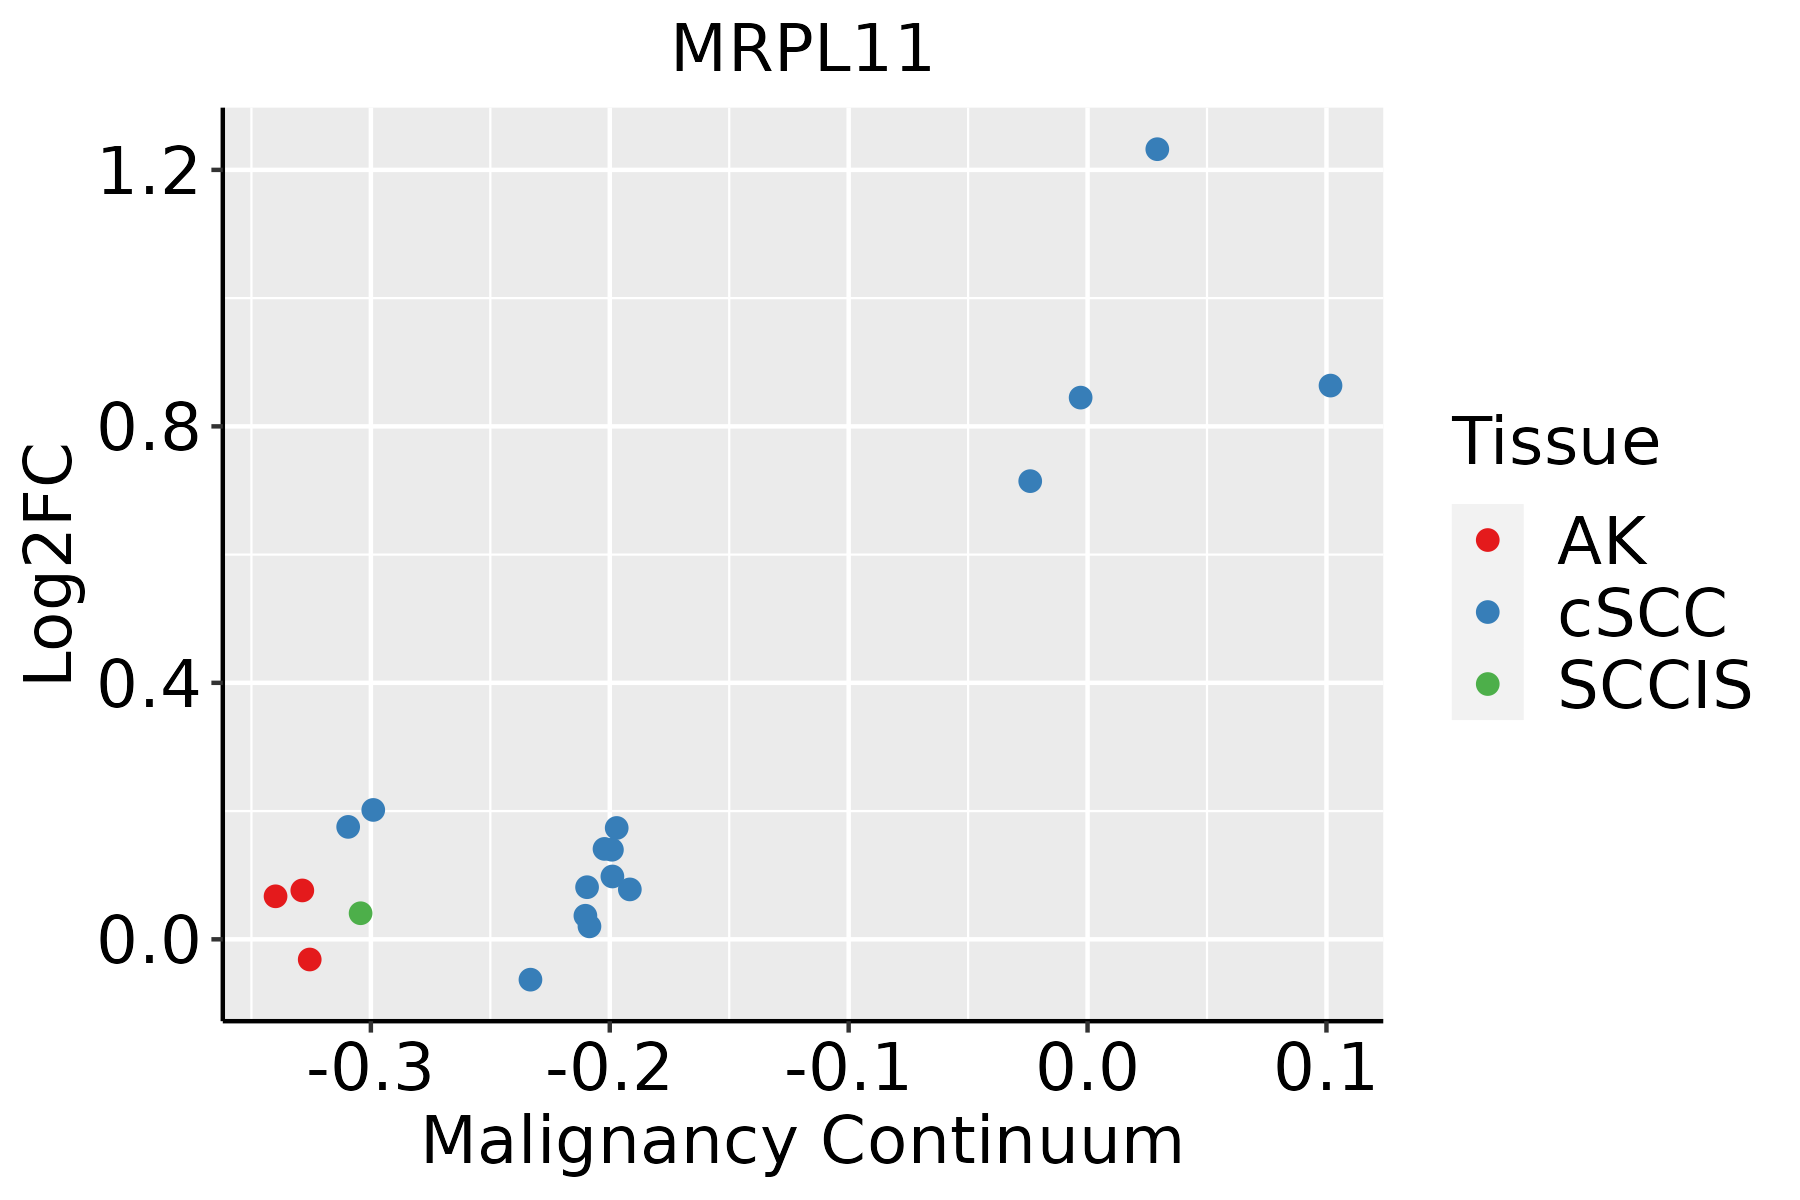 | AK: Actinic keratosis |
| cSCC: Cutaneous squamous cell carcinoma | ||
| SCCIS:squamous cell carcinoma in situ | ||
| Thyroid | 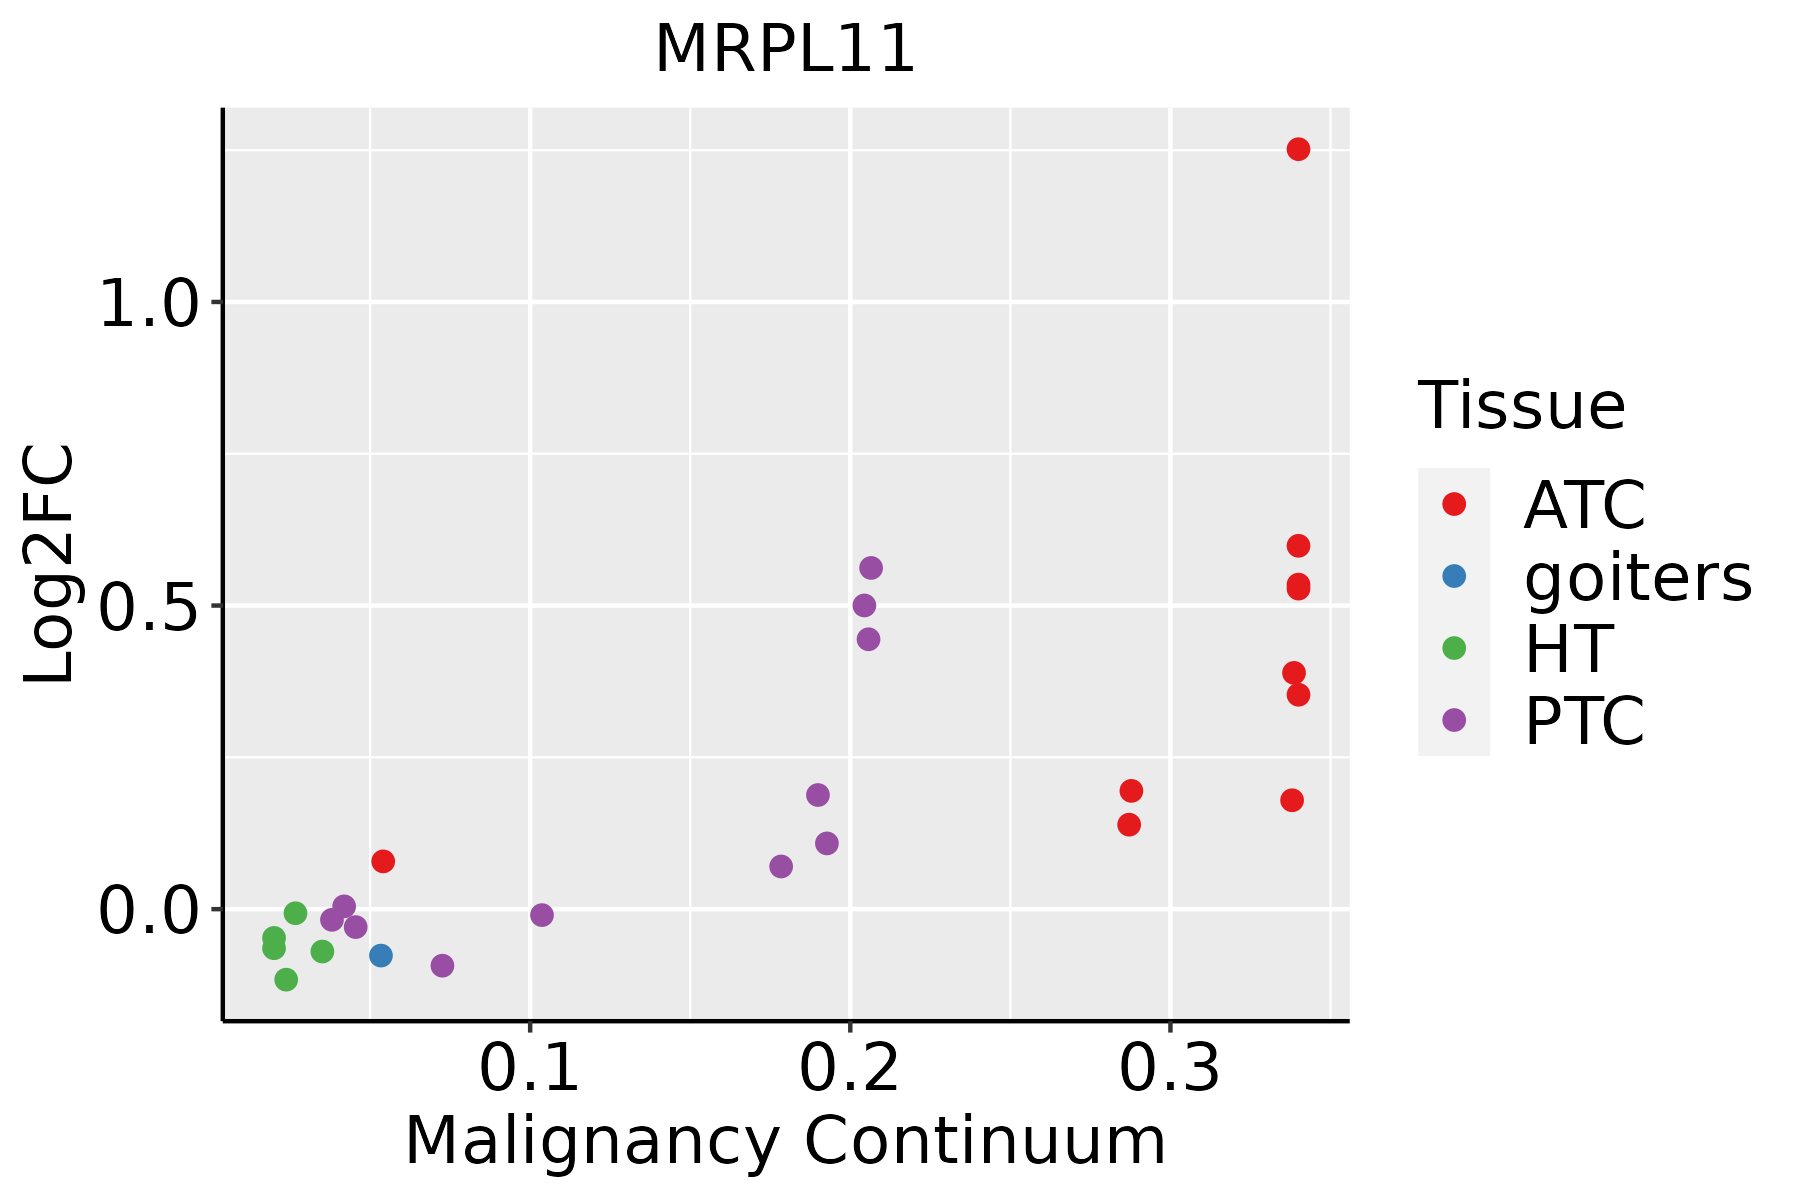 | ATC: Anaplastic thyroid cancer |
| HT: Hashimoto's thyroiditis | ||
| PTC: Papillary thyroid cancer |
| ∗log2FC in expression of this searched gene in stem-like cells from each diseased tissue sample relative to stem-like cells in normal samples in each tissue plotted against the malignancy continuum. Samples are colored based on if they are from different disease stage. |
Top |
Malignant transformation related pathway analysis |
| Find out the enriched GO biological processes and KEGG pathways involved in transition from healthy to precancer to cancer |
| Tissue | Disease Stage | Enriched GO biological Processes |
| Colorectum | AD |  |
| Colorectum | SER |  |
| Colorectum | MSS |  |
| Colorectum | MSI-H |  |
| Colorectum | FAP |  |
| ∗Top 15 enriched GO BP terms are showed in the bar plot of each disease state in each tissue. Each row represents a significant GO biological process which is colored according to the -log10(p.adjust). |
| Page: 1 2 3 4 5 6 7 8 9 |
| GO ID | Tissue | Disease Stage | Description | Gene Ratio | Bg Ratio | pvalue | p.adjust | Count |
| Page: 1 |
| Pathway ID | Tissue | Disease Stage | Description | Gene Ratio | Bg Ratio | pvalue | p.adjust | qvalue | Count |
| hsa03010 | Colorectum | AD | Ribosome | 96/2092 | 167/8465 | 8.28e-20 | 5.54e-18 | 3.54e-18 | 96 |
| hsa030101 | Colorectum | AD | Ribosome | 96/2092 | 167/8465 | 8.28e-20 | 5.54e-18 | 3.54e-18 | 96 |
| hsa030102 | Colorectum | SER | Ribosome | 92/1580 | 167/8465 | 2.21e-26 | 3.66e-24 | 2.66e-24 | 92 |
| hsa030103 | Colorectum | SER | Ribosome | 92/1580 | 167/8465 | 2.21e-26 | 3.66e-24 | 2.66e-24 | 92 |
| hsa030104 | Colorectum | MSS | Ribosome | 96/1875 | 167/8465 | 1.82e-23 | 2.03e-21 | 1.24e-21 | 96 |
| hsa030105 | Colorectum | MSS | Ribosome | 96/1875 | 167/8465 | 1.82e-23 | 2.03e-21 | 1.24e-21 | 96 |
| hsa030106 | Colorectum | MSI-H | Ribosome | 87/797 | 167/8465 | 5.55e-46 | 1.80e-43 | 1.51e-43 | 87 |
| hsa030107 | Colorectum | MSI-H | Ribosome | 87/797 | 167/8465 | 5.55e-46 | 1.80e-43 | 1.51e-43 | 87 |
| hsa0301039 | Esophagus | HGIN | Ribosome | 108/1383 | 167/8465 | 1.44e-45 | 4.71e-43 | 3.74e-43 | 108 |
| hsa03010115 | Esophagus | HGIN | Ribosome | 108/1383 | 167/8465 | 1.44e-45 | 4.71e-43 | 3.74e-43 | 108 |
| hsa03010211 | Esophagus | ESCC | Ribosome | 129/4205 | 167/8465 | 1.43e-13 | 3.43e-12 | 1.75e-12 | 129 |
| hsa03010310 | Esophagus | ESCC | Ribosome | 129/4205 | 167/8465 | 1.43e-13 | 3.43e-12 | 1.75e-12 | 129 |
| hsa0301022 | Liver | Cirrhotic | Ribosome | 127/2530 | 167/8465 | 2.12e-35 | 7.06e-33 | 4.35e-33 | 127 |
| hsa0301032 | Liver | Cirrhotic | Ribosome | 127/2530 | 167/8465 | 2.12e-35 | 7.06e-33 | 4.35e-33 | 127 |
| hsa0301042 | Liver | HCC | Ribosome | 128/4020 | 167/8465 | 7.32e-15 | 2.23e-13 | 1.24e-13 | 128 |
| hsa0301052 | Liver | HCC | Ribosome | 128/4020 | 167/8465 | 7.32e-15 | 2.23e-13 | 1.24e-13 | 128 |
| hsa0301030 | Oral cavity | OSCC | Ribosome | 128/3704 | 167/8465 | 2.42e-18 | 1.62e-16 | 8.25e-17 | 128 |
| hsa03010114 | Oral cavity | OSCC | Ribosome | 128/3704 | 167/8465 | 2.42e-18 | 1.62e-16 | 8.25e-17 | 128 |
| hsa03010210 | Oral cavity | LP | Ribosome | 127/2418 | 167/8465 | 1.22e-37 | 4.05e-35 | 2.61e-35 | 127 |
| hsa0301038 | Oral cavity | LP | Ribosome | 127/2418 | 167/8465 | 1.22e-37 | 4.05e-35 | 2.61e-35 | 127 |
| Page: 1 |
Top |
Cell-cell communication analysis |
| Identification of potential cell-cell interactions between two cell types and their ligand-receptor pairs for different disease states |
| Ligand | Receptor | LRpair | Pathway | Tissue | Disease Stage |
| Page: 1 |
Top |
Single-cell gene regulatory network inference analysis |
| Find out the significant the regulons (TFs) and the target genes of each regulon across cell types for different disease states |
| TF | Cell Type | Tissue | Disease Stage | Target Gene | RSS | Regulon Activity |
| ∗The dot plots of a searched regulon are shown for all cell subpopulations in each disease state of each tissue based on the regulon specific score inferred using pySCENIC and by calculating the average expression. |
| Page: 1 |
Top |
Somatic mutation of malignant transformation related genes |
| Annotation of somatic variants for genes involved in malignant transformation |
| Hugo Symbol | Variant Class | Variant Classification | dbSNP RS | HGVSc | HGVSp | HGVSp Short | SWISSPROT | BIOTYPE | SIFT | PolyPhen | Tumor Sample Barcode | Tissue | Histology | Sex | Age | Stage | Therapy Types | Drugs | Outcome |
| MRPL11 | SNV | Missense_Mutation | c.292N>C | p.Glu98Gln | p.E98Q | Q9Y3B7 | protein_coding | tolerated(0.74) | benign(0.406) | TCGA-A8-A08G-01 | Breast | breast invasive carcinoma | Female | <65 | I/II | Chemotherapy | 5-fluorouracil | CR | |
| MRPL11 | SNV | Missense_Mutation | novel | c.395N>C | p.Leu132Pro | p.L132P | Q9Y3B7 | protein_coding | deleterious(0) | possibly_damaging(0.87) | TCGA-2W-A8YY-01 | Cervix | cervical & endocervical cancer | Female | <65 | I/II | Chemotherapy | cisplatin | CR |
| MRPL11 | SNV | Missense_Mutation | c.490C>G | p.Leu164Val | p.L164V | Q9Y3B7 | protein_coding | deleterious(0.05) | benign(0.006) | TCGA-A6-6781-01 | Colorectum | colon adenocarcinoma | Male | <65 | III/IV | Chemotherapy | oxaliplatin | SD | |
| MRPL11 | SNV | Missense_Mutation | novel | c.251N>C | p.Gln84Pro | p.Q84P | Q9Y3B7 | protein_coding | tolerated(0.16) | benign(0.028) | TCGA-AJ-A3OJ-01 | Endometrium | uterine corpus endometrioid carcinoma | Female | <65 | I/II | Chemotherapy | carboplatin | CR |
| MRPL11 | SNV | Missense_Mutation | novel | c.14N>A | p.Gly5Asp | p.G5D | Q9Y3B7 | protein_coding | tolerated(0.38) | benign(0.007) | TCGA-AP-A1DK-01 | Endometrium | uterine corpus endometrioid carcinoma | Female | <65 | I/II | Unknown | Unknown | SD |
| MRPL11 | SNV | Missense_Mutation | rs775327537 | c.460N>T | p.Arg154Cys | p.R154C | Q9Y3B7 | protein_coding | deleterious(0) | possibly_damaging(0.806) | TCGA-AX-A05S-01 | Endometrium | uterine corpus endometrioid carcinoma | Female | >=65 | III/IV | Unspecific | Carboplatin & Paclitaxel | PD |
| MRPL11 | SNV | Missense_Mutation | novel | c.85N>A | p.Ala29Thr | p.A29T | Q9Y3B7 | protein_coding | deleterious(0) | probably_damaging(0.999) | TCGA-AX-A2HC-01 | Endometrium | uterine corpus endometrioid carcinoma | Female | <65 | III/IV | Chemotherapy | paclitaxel | PD |
| MRPL11 | SNV | Missense_Mutation | novel | c.183G>T | p.Lys61Asn | p.K61N | Q9Y3B7 | protein_coding | deleterious(0) | probably_damaging(0.992) | TCGA-FI-A2D0-01 | Endometrium | uterine corpus endometrioid carcinoma | Female | <65 | I/II | Unknown | Unknown | SD |
| MRPL11 | deletion | Frame_Shift_Del | novel | c.301delN | p.Ala101ProfsTer12 | p.A101Pfs*12 | Q9Y3B7 | protein_coding | TCGA-G3-A25Z-01 | Liver | liver hepatocellular carcinoma | Male | <65 | I/II | Unknown | Unknown | SD | ||
| MRPL11 | SNV | Missense_Mutation | rs377543470 | c.365N>A | p.Arg122His | p.R122H | Q9Y3B7 | protein_coding | tolerated(0.07) | possibly_damaging(0.484) | TCGA-95-8494-01 | Lung | lung adenocarcinoma | Male | >=65 | I/II | Unknown | Unknown | SD |
| Page: 1 2 |
Top |
Related drugs of malignant transformation related genes |
| Identification of chemicals and drugs interact with genes involved in malignant transfromation |
| (DGIdb 4.0) |
| Entrez ID | Symbol | Category | Interaction Types | Drug Claim Name | Drug Name | PMIDs |
| Page: 1 |

Copyright 2023-Present -The University of Texas Health Science Center at Houston |