
|
|||||
|
 | |
| |
| |
| |
| |
| |
|
Gene: MRNIP |
Gene summary for MRNIP |
| Gene information | Species | Human | Gene symbol | MRNIP | Gene ID | 51149 |
| Gene name | MRN complex interacting protein | |
| Gene Alias | C5orf45 | |
| Cytomap | 5q35.3 | |
| Gene Type | protein-coding | GO ID | GO:0000018 | UniProtAcc | Q6NTE8 |
Top |
Malignant transformation analysis |
| Identification of the aberrant gene expression in precancerous and cancerous lesions by comparing the gene expression of stem-like cells in diseased tissues with normal stem cells |
| Entrez ID | Symbol | Replicates | Species | Organ | Tissue | Adj P-value | Log2FC | Malignancy |
| 51149 | MRNIP | male-WTA | Human | Thyroid | PTC | 7.43e-16 | 2.35e-01 | 0.1037 |
| 51149 | MRNIP | PTC01 | Human | Thyroid | PTC | 1.04e-27 | 5.70e-01 | 0.1899 |
| 51149 | MRNIP | PTC03 | Human | Thyroid | PTC | 1.35e-04 | 2.01e-01 | 0.1784 |
| 51149 | MRNIP | PTC04 | Human | Thyroid | PTC | 1.65e-23 | 4.40e-01 | 0.1927 |
| 51149 | MRNIP | PTC05 | Human | Thyroid | PTC | 1.02e-26 | 8.03e-01 | 0.2065 |
| 51149 | MRNIP | PTC06 | Human | Thyroid | PTC | 8.85e-35 | 7.50e-01 | 0.2057 |
| 51149 | MRNIP | PTC07 | Human | Thyroid | PTC | 4.37e-34 | 5.87e-01 | 0.2044 |
| 51149 | MRNIP | ATC09 | Human | Thyroid | ATC | 1.77e-08 | 3.92e-01 | 0.2871 |
| 51149 | MRNIP | ATC12 | Human | Thyroid | ATC | 5.14e-03 | 1.13e-01 | 0.34 |
| 51149 | MRNIP | ATC13 | Human | Thyroid | ATC | 5.95e-07 | 1.75e-01 | 0.34 |
| 51149 | MRNIP | ATC1 | Human | Thyroid | ATC | 4.49e-08 | 4.10e-01 | 0.2878 |
| 51149 | MRNIP | ATC2 | Human | Thyroid | ATC | 3.34e-11 | 5.69e-01 | 0.34 |
| 51149 | MRNIP | ATC4 | Human | Thyroid | ATC | 8.62e-06 | 1.55e-01 | 0.34 |
| 51149 | MRNIP | ATC5 | Human | Thyroid | ATC | 2.71e-09 | 1.91e-01 | 0.34 |
| Page: 1 |
| Tissue | Expression Dynamics | Abbreviation |
| Thyroid | 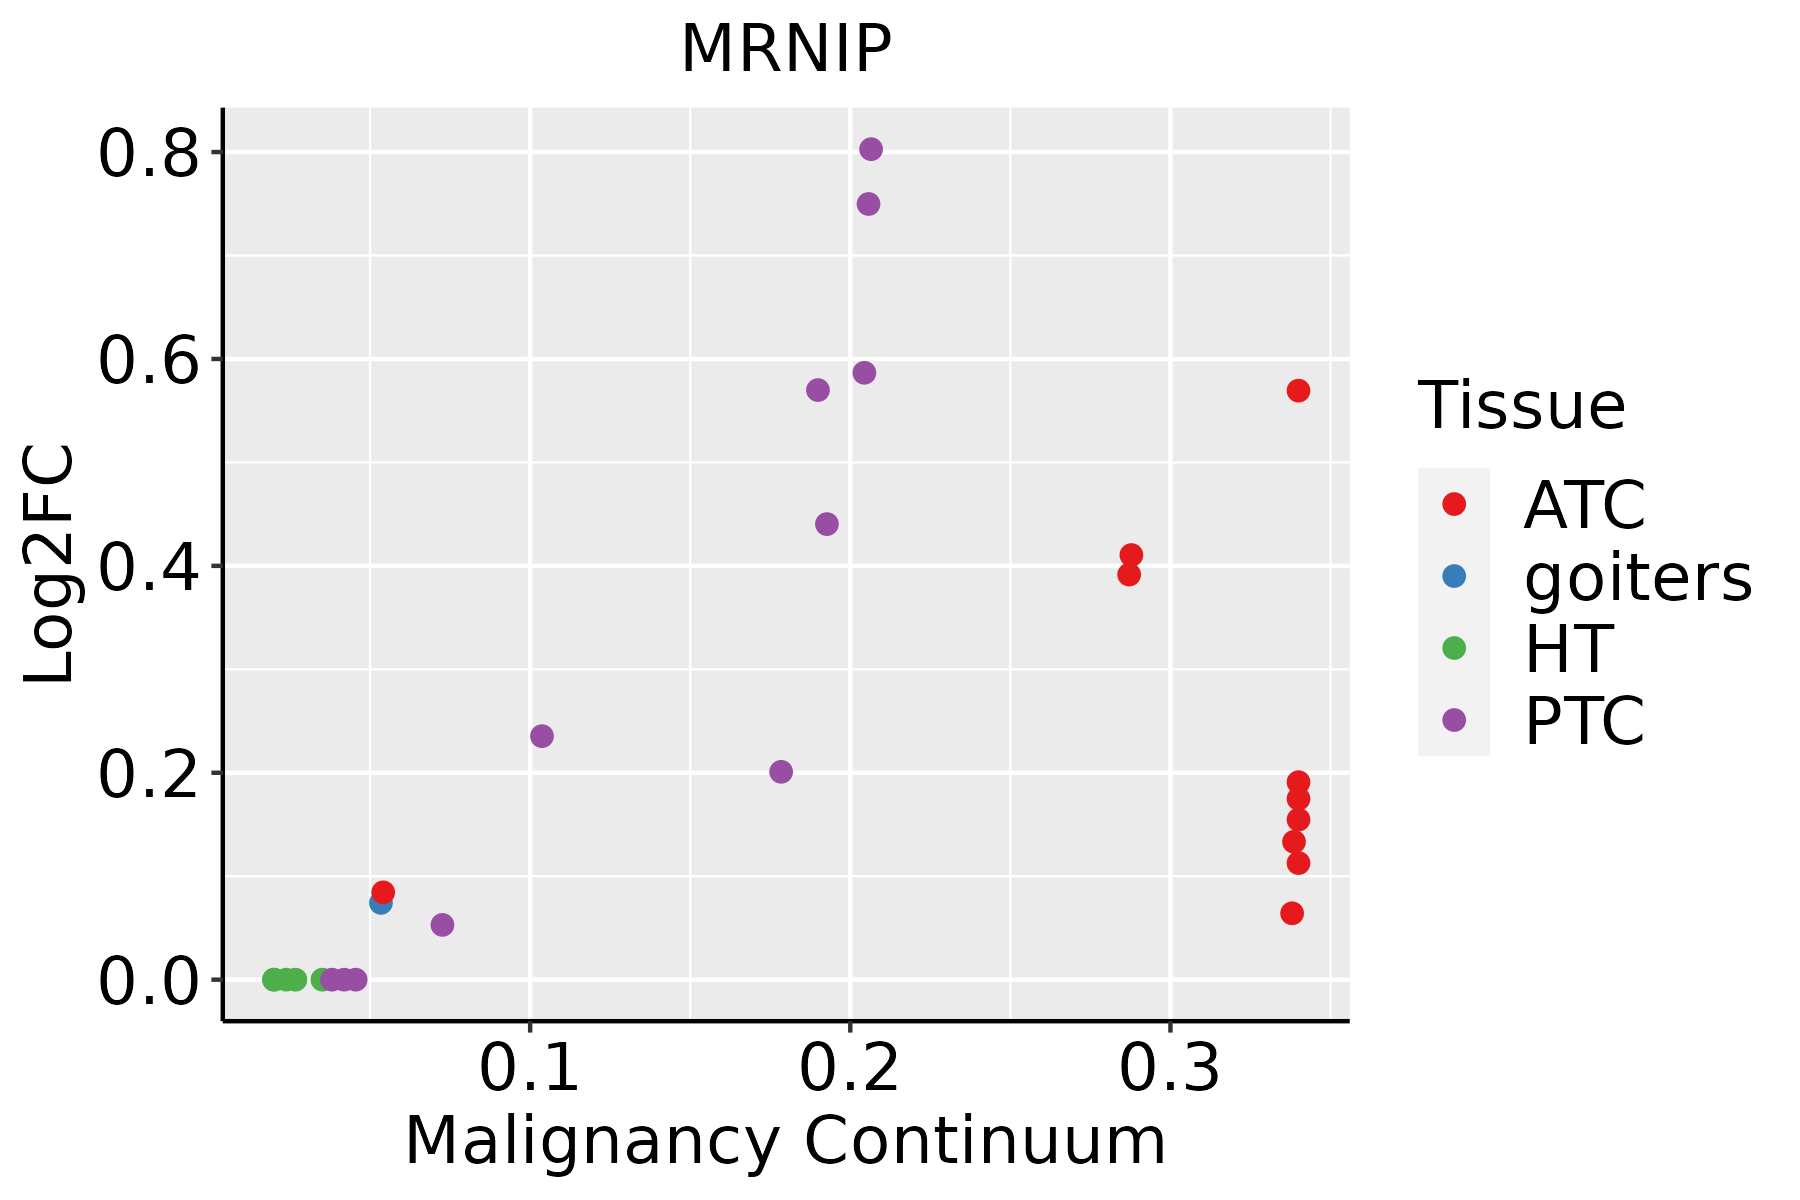 | ATC: Anaplastic thyroid cancer |
| HT: Hashimoto's thyroiditis | ||
| PTC: Papillary thyroid cancer |
| ∗log2FC in expression of this searched gene in stem-like cells from each diseased tissue sample relative to stem-like cells in normal samples in each tissue plotted against the malignancy continuum. Samples are colored based on if they are from different disease stage. |
Top |
Malignant transformation related pathway analysis |
| Find out the enriched GO biological processes and KEGG pathways involved in transition from healthy to precancer to cancer |
| Tissue | Disease Stage | Enriched GO biological Processes |
| Colorectum | AD |  |
| Colorectum | SER |  |
| Colorectum | MSS |  |
| Colorectum | MSI-H |  |
| Colorectum | FAP |  |
| ∗Top 15 enriched GO BP terms are showed in the bar plot of each disease state in each tissue. Each row represents a significant GO biological process which is colored according to the -log10(p.adjust). |
| Page: 1 2 3 4 5 6 7 8 9 |
| GO ID | Tissue | Disease Stage | Description | Gene Ratio | Bg Ratio | pvalue | p.adjust | Count |
| GO:000734619 | Thyroid | PTC | regulation of mitotic cell cycle | 212/5968 | 457/18723 | 4.03e-11 | 1.44e-09 | 212 |
| GO:005105218 | Thyroid | PTC | regulation of DNA metabolic process | 171/5968 | 359/18723 | 2.52e-10 | 8.33e-09 | 171 |
| GO:004477218 | Thyroid | PTC | mitotic cell cycle phase transition | 196/5968 | 424/18723 | 3.17e-10 | 1.02e-08 | 196 |
| GO:2001020112 | Thyroid | PTC | regulation of response to DNA damage stimulus | 113/5968 | 219/18723 | 9.37e-10 | 2.77e-08 | 113 |
| GO:0045860111 | Thyroid | PTC | positive regulation of protein kinase activity | 176/5968 | 386/18723 | 8.89e-09 | 2.17e-07 | 176 |
| GO:001021219 | Thyroid | PTC | response to ionizing radiation | 79/5968 | 148/18723 | 4.56e-08 | 9.74e-07 | 79 |
| GO:005105420 | Thyroid | PTC | positive regulation of DNA metabolic process | 100/5968 | 201/18723 | 9.18e-08 | 1.84e-06 | 100 |
| GO:19019908 | Thyroid | PTC | regulation of mitotic cell cycle phase transition | 138/5968 | 299/18723 | 1.44e-07 | 2.78e-06 | 138 |
| GO:0033674111 | Thyroid | PTC | positive regulation of kinase activity | 201/5968 | 467/18723 | 1.95e-07 | 3.54e-06 | 201 |
| GO:0009314111 | Thyroid | PTC | response to radiation | 195/5968 | 456/18723 | 5.10e-07 | 8.27e-06 | 195 |
| GO:00457867 | Thyroid | PTC | negative regulation of cell cycle | 166/5968 | 385/18723 | 1.93e-06 | 2.64e-05 | 166 |
| GO:19019878 | Thyroid | PTC | regulation of cell cycle phase transition | 167/5968 | 390/18723 | 2.97e-06 | 3.87e-05 | 167 |
| GO:00062828 | Thyroid | PTC | regulation of DNA repair | 65/5968 | 130/18723 | 1.25e-05 | 1.36e-04 | 65 |
| GO:004277010 | Thyroid | PTC | signal transduction in response to DNA damage | 81/5968 | 172/18723 | 2.07e-05 | 2.08e-04 | 81 |
| GO:00459307 | Thyroid | PTC | negative regulation of mitotic cell cycle | 105/5968 | 235/18723 | 2.41e-05 | 2.39e-04 | 105 |
| GO:19019917 | Thyroid | PTC | negative regulation of mitotic cell cycle phase transition | 83/5968 | 179/18723 | 3.34e-05 | 3.17e-04 | 83 |
| GO:20010229 | Thyroid | PTC | positive regulation of response to DNA damage stimulus | 53/5968 | 105/18723 | 5.51e-05 | 4.89e-04 | 53 |
| GO:00109486 | Thyroid | PTC | negative regulation of cell cycle process | 122/5968 | 294/18723 | 2.94e-04 | 2.08e-03 | 122 |
| GO:20007794 | Thyroid | PTC | regulation of double-strand break repair | 42/5968 | 85/18723 | 5.59e-04 | 3.56e-03 | 42 |
| GO:19019885 | Thyroid | PTC | negative regulation of cell cycle phase transition | 104/5968 | 249/18723 | 6.01e-04 | 3.82e-03 | 104 |
| Page: 1 2 3 4 |
| Pathway ID | Tissue | Disease Stage | Description | Gene Ratio | Bg Ratio | pvalue | p.adjust | qvalue | Count |
| Page: 1 |
Top |
Cell-cell communication analysis |
| Identification of potential cell-cell interactions between two cell types and their ligand-receptor pairs for different disease states |
| Ligand | Receptor | LRpair | Pathway | Tissue | Disease Stage |
| Page: 1 |
Top |
Single-cell gene regulatory network inference analysis |
| Find out the significant the regulons (TFs) and the target genes of each regulon across cell types for different disease states |
| TF | Cell Type | Tissue | Disease Stage | Target Gene | RSS | Regulon Activity |
| ∗The dot plots of a searched regulon are shown for all cell subpopulations in each disease state of each tissue based on the regulon specific score inferred using pySCENIC and by calculating the average expression. |
| Page: 1 |
Top |
Somatic mutation of malignant transformation related genes |
| Annotation of somatic variants for genes involved in malignant transformation |
| Hugo Symbol | Variant Class | Variant Classification | dbSNP RS | HGVSc | HGVSp | HGVSp Short | SWISSPROT | BIOTYPE | SIFT | PolyPhen | Tumor Sample Barcode | Tissue | Histology | Sex | Age | Stage | Therapy Types | Drugs | Outcome |
| MRNIP | SNV | Missense_Mutation | c.710N>C | p.Arg237Thr | p.R237T | Q6NTE8 | protein_coding | tolerated(0.23) | benign(0.114) | TCGA-AC-A23H-01 | Breast | breast invasive carcinoma | Female | >=65 | I/II | Unknown | Unknown | PD | |
| MRNIP | SNV | Missense_Mutation | rs112467347 | c.469N>A | p.Val157Ile | p.V157I | Q6NTE8 | protein_coding | tolerated(0.33) | benign(0.003) | TCGA-E2-A14P-01 | Breast | breast invasive carcinoma | Female | >=65 | III/IV | Targeted Molecular therapy | trastuzumab | SD |
| MRNIP | SNV | Missense_Mutation | c.75N>T | p.Lys25Asn | p.K25N | Q6NTE8 | protein_coding | deleterious(0) | probably_damaging(0.998) | TCGA-MU-A51Y-01 | Cervix | cervical & endocervical cancer | Female | <65 | I/II | Unknown | Unknown | SD | |
| MRNIP | SNV | Missense_Mutation | rs116981436 | c.493N>A | p.Val165Met | p.V165M | Q6NTE8 | protein_coding | deleterious(0.02) | benign(0.407) | TCGA-VS-A9U6-01 | Cervix | cervical & endocervical cancer | Female | <65 | I/II | Chemotherapy | cisplatin | PD |
| MRNIP | SNV | Missense_Mutation | rs367893357 | c.160C>T | p.Arg54Cys | p.R54C | Q6NTE8 | protein_coding | deleterious(0.01) | benign(0.112) | TCGA-VS-A9UU-01 | Cervix | cervical & endocervical cancer | Female | <65 | I/II | Chemotherapy | cisplatin | CR |
| MRNIP | SNV | Missense_Mutation | c.899G>A | p.Cys300Tyr | p.C300Y | Q6NTE8 | protein_coding | tolerated(0.44) | benign(0.275) | TCGA-AA-3966-01 | Colorectum | colon adenocarcinoma | Female | >=65 | I/II | Unknown | Unknown | SD | |
| MRNIP | SNV | Missense_Mutation | rs373940235 | c.20N>T | p.Ser7Phe | p.S7F | Q6NTE8 | protein_coding | tolerated(0.43) | benign(0) | TCGA-AZ-6599-01 | Colorectum | colon adenocarcinoma | Male | >=65 | I/II | Unknown | Unknown | SD |
| MRNIP | SNV | Missense_Mutation | rs143664576 | c.689N>T | p.Ala230Val | p.A230V | Q6NTE8 | protein_coding | deleterious(0.04) | benign(0.209) | TCGA-D5-6930-01 | Colorectum | colon adenocarcinoma | Male | >=65 | I/II | Unknown | Unknown | SD |
| MRNIP | SNV | Missense_Mutation | rs773459500 | c.590N>G | p.Gln197Arg | p.Q197R | Q6NTE8 | protein_coding | tolerated(0.49) | benign(0) | TCGA-DM-A1HB-01 | Colorectum | colon adenocarcinoma | Male | >=65 | III/IV | Unknown | Unknown | SD |
| MRNIP | SNV | Missense_Mutation | c.794N>T | p.Gly265Val | p.G265V | Q6NTE8 | protein_coding | deleterious(0.01) | probably_damaging(0.999) | TCGA-G4-6304-01 | Colorectum | colon adenocarcinoma | Female | >=65 | I/II | Chemotherapy | fluorouracil | PD |
| Page: 1 2 3 4 |
Top |
Related drugs of malignant transformation related genes |
| Identification of chemicals and drugs interact with genes involved in malignant transfromation |
| (DGIdb 4.0) |
| Entrez ID | Symbol | Category | Interaction Types | Drug Claim Name | Drug Name | PMIDs |
| Page: 1 |

Copyright 2023-Present -The University of Texas Health Science Center at Houston |