
|
|||||
|
 | |
| |
| |
| |
| |
| |
|
Gene: MRM2 |
Gene summary for MRM2 |
| Gene information | Species | Human | Gene symbol | MRM2 | Gene ID | 29960 |
| Gene name | mitochondrial rRNA methyltransferase 2 | |
| Gene Alias | FJH1 | |
| Cytomap | 7p22.3 | |
| Gene Type | protein-coding | GO ID | GO:0000154 | UniProtAcc | Q9UI43 |
Top |
Malignant transformation analysis |
| Identification of the aberrant gene expression in precancerous and cancerous lesions by comparing the gene expression of stem-like cells in diseased tissues with normal stem cells |
| Entrez ID | Symbol | Replicates | Species | Organ | Tissue | Adj P-value | Log2FC | Malignancy |
| 29960 | MRM2 | HCC2 | Human | Liver | HCC | 1.12e-11 | 3.46e+00 | 0.5341 |
| 29960 | MRM2 | S014 | Human | Liver | HCC | 3.19e-29 | 8.00e-01 | 0.2254 |
| 29960 | MRM2 | S015 | Human | Liver | HCC | 9.10e-29 | 8.63e-01 | 0.2375 |
| 29960 | MRM2 | S016 | Human | Liver | HCC | 1.64e-36 | 9.00e-01 | 0.2243 |
| 29960 | MRM2 | S027 | Human | Liver | HCC | 2.79e-08 | 5.25e-01 | 0.2446 |
| 29960 | MRM2 | S028 | Human | Liver | HCC | 1.20e-28 | 8.07e-01 | 0.2503 |
| 29960 | MRM2 | S029 | Human | Liver | HCC | 2.19e-23 | 6.89e-01 | 0.2581 |
| 29960 | MRM2 | PTC01 | Human | Thyroid | PTC | 7.91e-06 | 1.06e-01 | 0.1899 |
| 29960 | MRM2 | PTC05 | Human | Thyroid | PTC | 2.73e-08 | 2.36e-01 | 0.2065 |
| 29960 | MRM2 | PTC06 | Human | Thyroid | PTC | 5.12e-18 | 2.83e-01 | 0.2057 |
| 29960 | MRM2 | PTC07 | Human | Thyroid | PTC | 6.64e-16 | 2.73e-01 | 0.2044 |
| 29960 | MRM2 | ATC12 | Human | Thyroid | ATC | 2.10e-13 | 2.45e-01 | 0.34 |
| 29960 | MRM2 | ATC13 | Human | Thyroid | ATC | 1.06e-16 | 3.62e-01 | 0.34 |
| 29960 | MRM2 | ATC2 | Human | Thyroid | ATC | 2.25e-14 | 8.38e-01 | 0.34 |
| 29960 | MRM2 | ATC4 | Human | Thyroid | ATC | 1.31e-18 | 3.61e-01 | 0.34 |
| 29960 | MRM2 | ATC5 | Human | Thyroid | ATC | 2.39e-21 | 4.06e-01 | 0.34 |
| Page: 1 |
| Tissue | Expression Dynamics | Abbreviation |
| Liver | 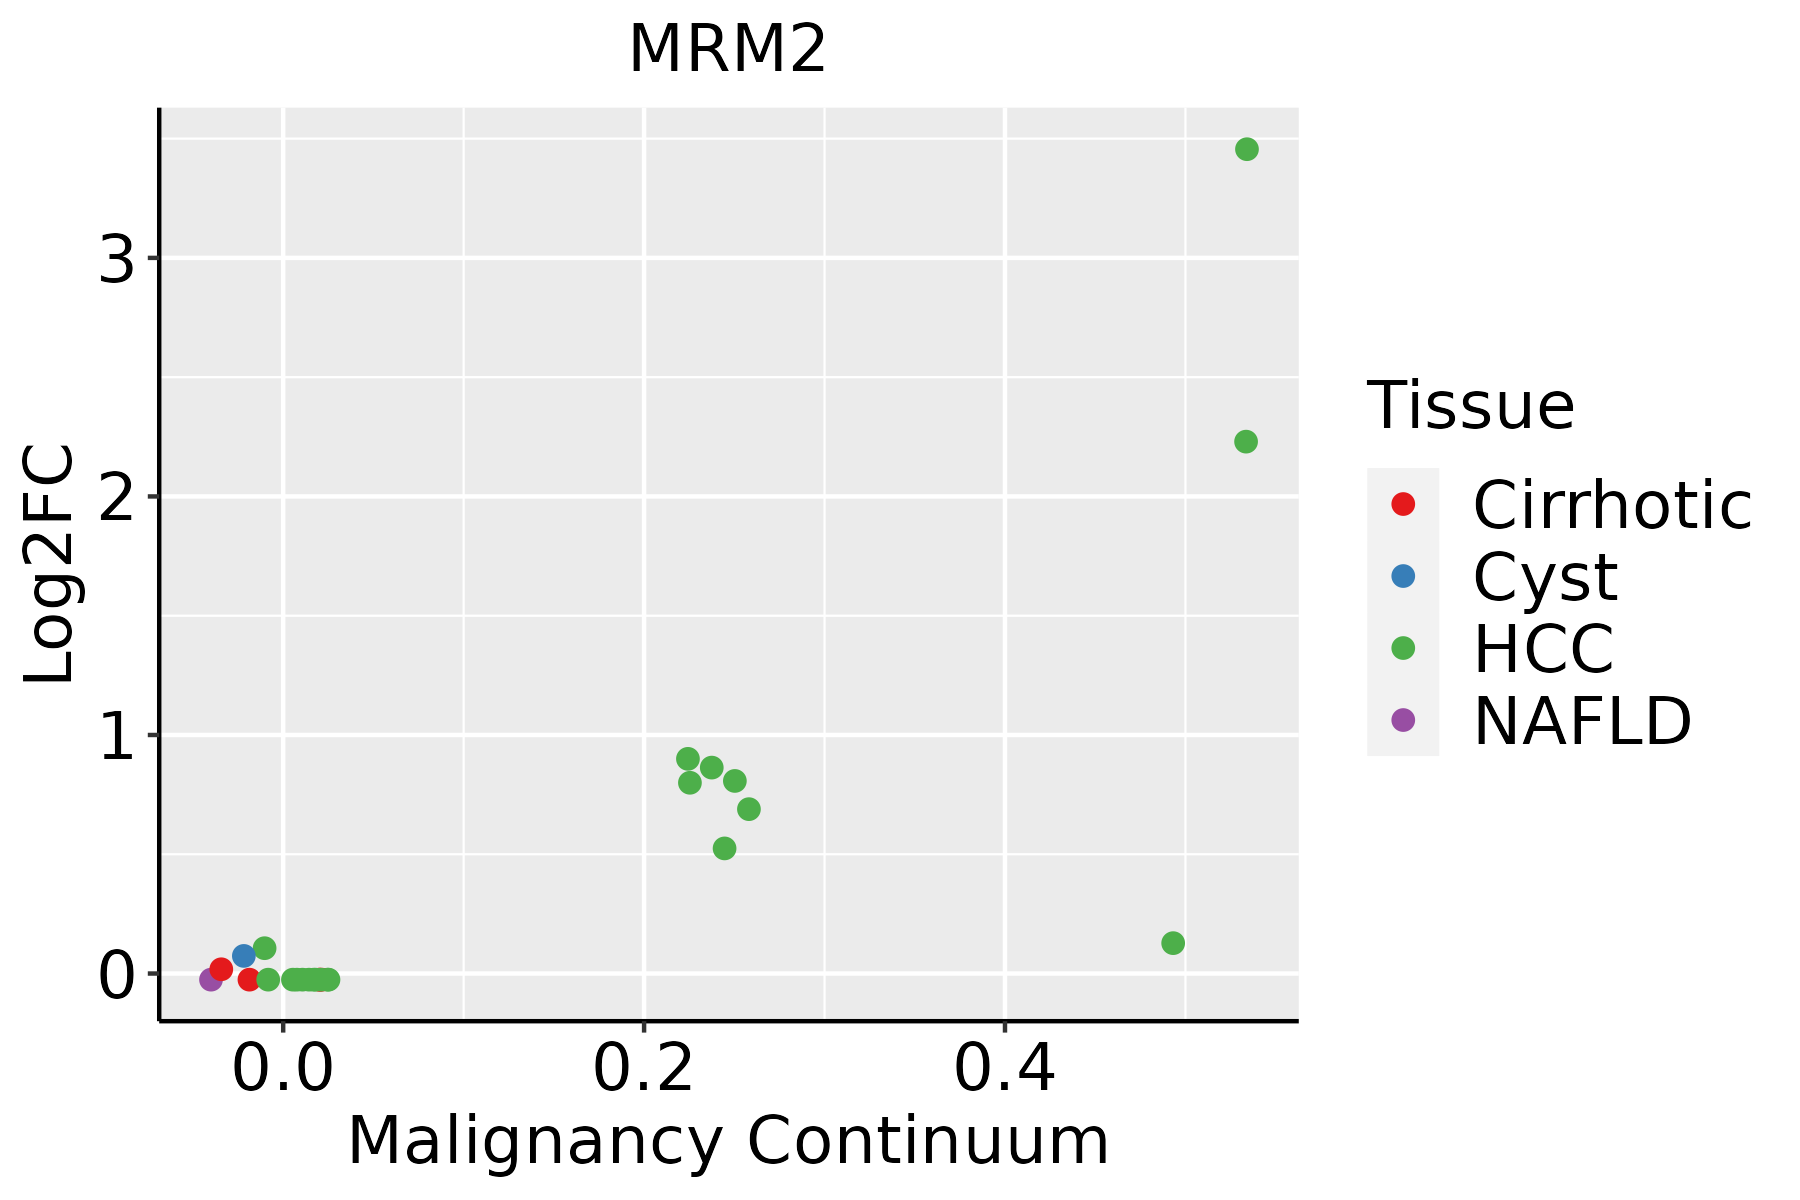 | HCC: Hepatocellular carcinoma |
| NAFLD: Non-alcoholic fatty liver disease | ||
| Thyroid | 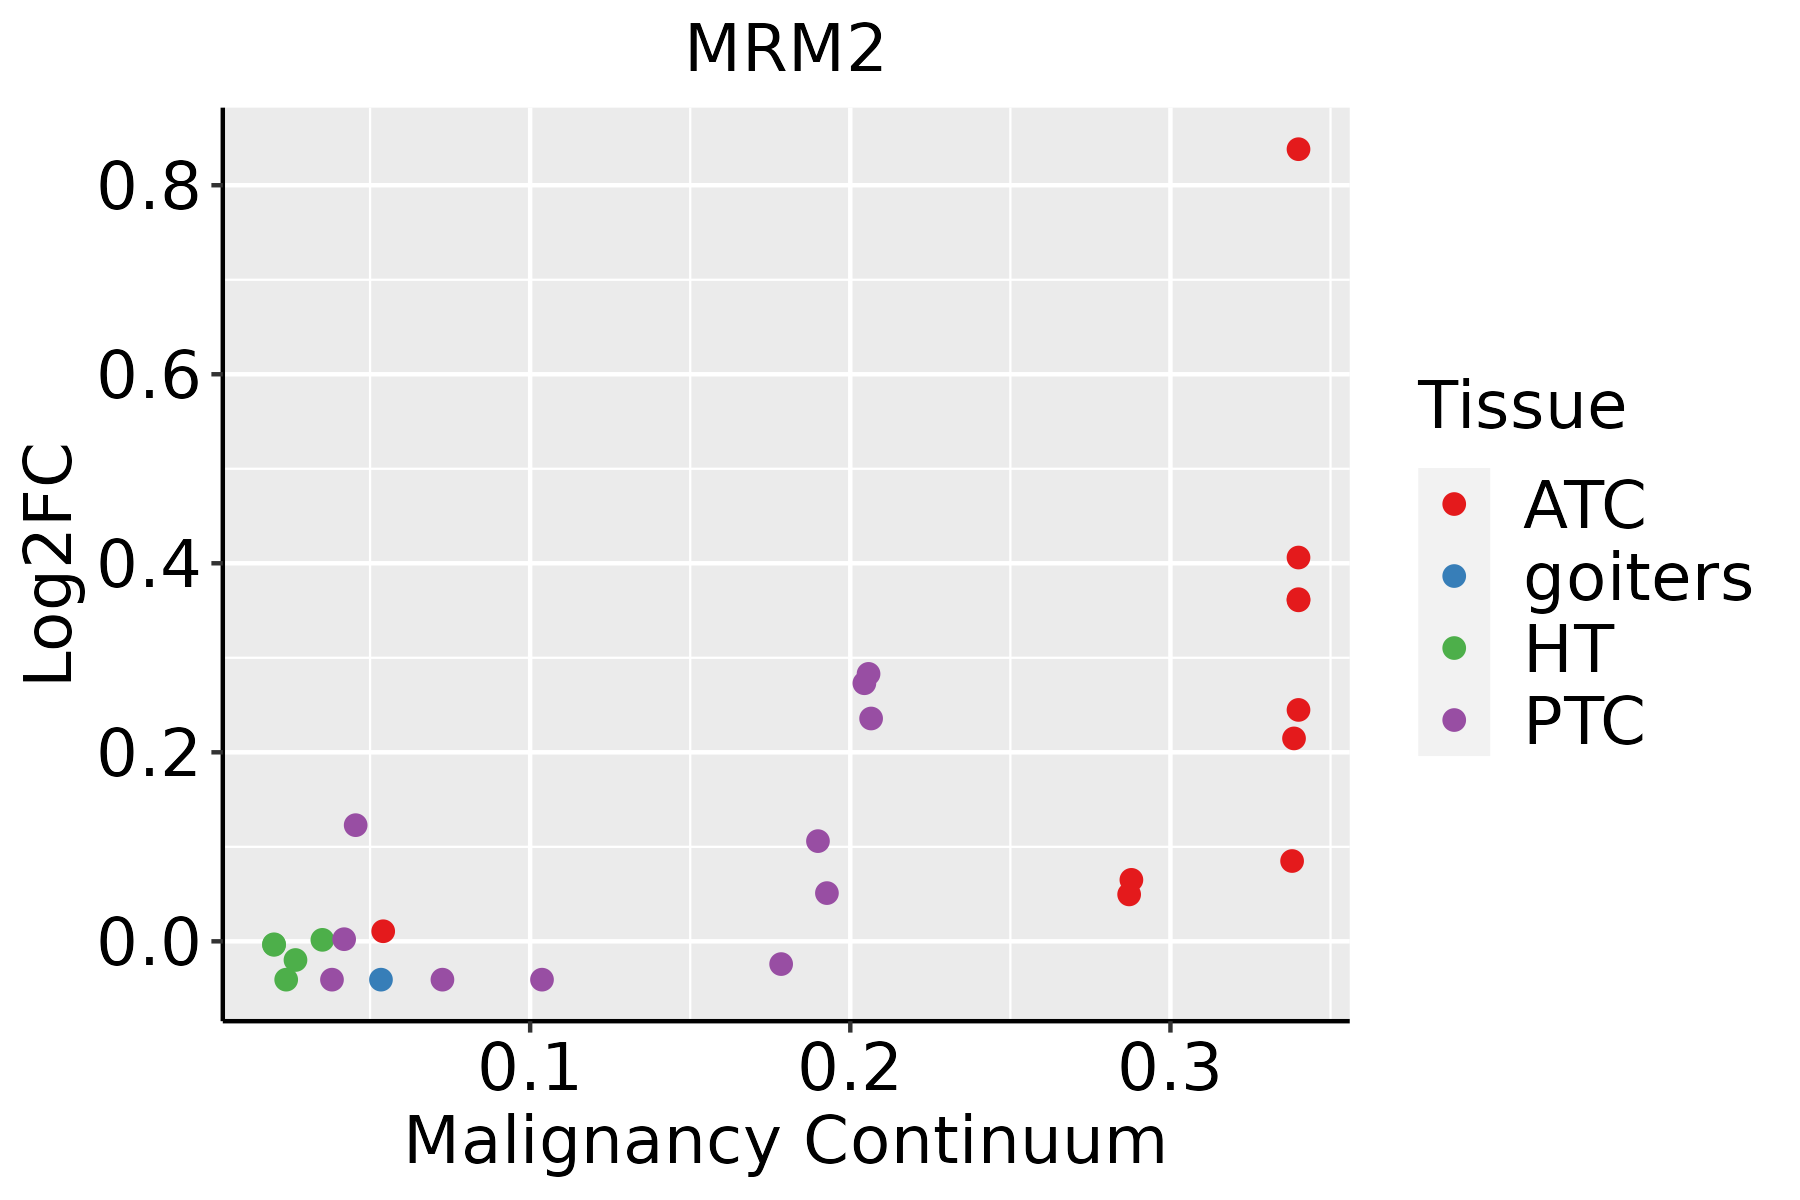 | ATC: Anaplastic thyroid cancer |
| HT: Hashimoto's thyroiditis | ||
| PTC: Papillary thyroid cancer |
| ∗log2FC in expression of this searched gene in stem-like cells from each diseased tissue sample relative to stem-like cells in normal samples in each tissue plotted against the malignancy continuum. Samples are colored based on if they are from different disease stage. |
Top |
Malignant transformation related pathway analysis |
| Find out the enriched GO biological processes and KEGG pathways involved in transition from healthy to precancer to cancer |
| Tissue | Disease Stage | Enriched GO biological Processes |
| Colorectum | AD |  |
| Colorectum | SER |  |
| Colorectum | MSS |  |
| Colorectum | MSI-H |  |
| Colorectum | FAP |  |
| ∗Top 15 enriched GO BP terms are showed in the bar plot of each disease state in each tissue. Each row represents a significant GO biological process which is colored according to the -log10(p.adjust). |
| Page: 1 2 3 4 5 6 7 8 9 |
| GO ID | Tissue | Disease Stage | Description | Gene Ratio | Bg Ratio | pvalue | p.adjust | Count |
| GO:002261322 | Liver | HCC | ribonucleoprotein complex biogenesis | 355/7958 | 463/18723 | 7.76e-52 | 4.92e-48 | 355 |
| GO:004225422 | Liver | HCC | ribosome biogenesis | 246/7958 | 299/18723 | 4.99e-46 | 1.58e-42 | 246 |
| GO:00344702 | Liver | HCC | ncRNA processing | 293/7958 | 395/18723 | 4.26e-38 | 6.76e-35 | 293 |
| GO:001607212 | Liver | HCC | rRNA metabolic process | 193/7958 | 236/18723 | 1.26e-35 | 1.14e-32 | 193 |
| GO:000636421 | Liver | HCC | rRNA processing | 185/7958 | 225/18723 | 8.14e-35 | 6.45e-32 | 185 |
| GO:00346601 | Liver | HCC | ncRNA metabolic process | 332/7958 | 485/18723 | 1.48e-31 | 7.80e-29 | 332 |
| GO:00434141 | Liver | HCC | macromolecule methylation | 183/7958 | 316/18723 | 2.00e-08 | 4.72e-07 | 183 |
| GO:0032259 | Liver | HCC | methylation | 206/7958 | 364/18723 | 3.35e-08 | 7.53e-07 | 206 |
| GO:0009451 | Liver | HCC | RNA modification | 101/7958 | 167/18723 | 2.02e-06 | 2.78e-05 | 101 |
| GO:0001510 | Liver | HCC | RNA methylation | 53/7958 | 83/18723 | 6.96e-05 | 6.29e-04 | 53 |
| GO:0022613113 | Thyroid | PTC | ribonucleoprotein complex biogenesis | 292/5968 | 463/18723 | 3.24e-44 | 2.05e-40 | 292 |
| GO:0042254113 | Thyroid | PTC | ribosome biogenesis | 202/5968 | 299/18723 | 3.47e-37 | 5.47e-34 | 202 |
| GO:0006364112 | Thyroid | PTC | rRNA processing | 156/5968 | 225/18723 | 5.58e-31 | 5.03e-28 | 156 |
| GO:0016072112 | Thyroid | PTC | rRNA metabolic process | 160/5968 | 236/18723 | 5.68e-30 | 3.58e-27 | 160 |
| GO:003447018 | Thyroid | PTC | ncRNA processing | 215/5968 | 395/18723 | 7.14e-21 | 1.22e-18 | 215 |
| GO:00346608 | Thyroid | PTC | ncRNA metabolic process | 239/5968 | 485/18723 | 5.54e-16 | 4.26e-14 | 239 |
| GO:00322594 | Thyroid | PTC | methylation | 146/5968 | 364/18723 | 4.99e-04 | 3.26e-03 | 146 |
| GO:00434145 | Thyroid | PTC | macromolecule methylation | 127/5968 | 316/18723 | 1.02e-03 | 6.07e-03 | 127 |
| GO:002261334 | Thyroid | ATC | ribonucleoprotein complex biogenesis | 292/6293 | 463/18723 | 3.05e-39 | 9.63e-36 | 292 |
| GO:004225434 | Thyroid | ATC | ribosome biogenesis | 203/6293 | 299/18723 | 3.63e-34 | 4.59e-31 | 203 |
| Page: 1 2 |
| Pathway ID | Tissue | Disease Stage | Description | Gene Ratio | Bg Ratio | pvalue | p.adjust | qvalue | Count |
| Page: 1 |
Top |
Cell-cell communication analysis |
| Identification of potential cell-cell interactions between two cell types and their ligand-receptor pairs for different disease states |
| Ligand | Receptor | LRpair | Pathway | Tissue | Disease Stage |
| Page: 1 |
Top |
Single-cell gene regulatory network inference analysis |
| Find out the significant the regulons (TFs) and the target genes of each regulon across cell types for different disease states |
| TF | Cell Type | Tissue | Disease Stage | Target Gene | RSS | Regulon Activity |
| ∗The dot plots of a searched regulon are shown for all cell subpopulations in each disease state of each tissue based on the regulon specific score inferred using pySCENIC and by calculating the average expression. |
| Page: 1 |
Top |
Somatic mutation of malignant transformation related genes |
| Annotation of somatic variants for genes involved in malignant transformation |
| Hugo Symbol | Variant Class | Variant Classification | dbSNP RS | HGVSc | HGVSp | HGVSp Short | SWISSPROT | BIOTYPE | SIFT | PolyPhen | Tumor Sample Barcode | Tissue | Histology | Sex | Age | Stage | Therapy Types | Drugs | Outcome |
| MRM2 | deletion | Frame_Shift_Del | novel | c.65delN | p.Ser22IlefsTer14 | p.S22Ifs*14 | Q9UI43 | protein_coding | TCGA-EW-A2FV-01 | Breast | breast invasive carcinoma | Female | <65 | III/IV | Chemotherapy | docetaxel | SD | ||
| MRM2 | SNV | Missense_Mutation | rs753589819 | c.79N>T | p.Arg27Trp | p.R27W | Q9UI43 | protein_coding | deleterious(0) | probably_damaging(0.918) | TCGA-EA-A3QD-01 | Cervix | cervical & endocervical cancer | Female | <65 | III/IV | Chemotherapy | cisplatin | CR |
| MRM2 | SNV | Missense_Mutation | c.668N>A | p.Ser223Asn | p.S223N | Q9UI43 | protein_coding | deleterious(0) | probably_damaging(0.998) | TCGA-AA-A02W-01 | Colorectum | colon adenocarcinoma | Female | >=65 | I/II | Unknown | Unknown | PD | |
| MRM2 | SNV | Missense_Mutation | c.178C>T | p.Leu60Phe | p.L60F | Q9UI43 | protein_coding | deleterious(0) | probably_damaging(1) | TCGA-AG-3898-01 | Colorectum | rectum adenocarcinoma | Male | <65 | I/II | Unknown | Unknown | SD | |
| MRM2 | SNV | Missense_Mutation | rs763061299 | c.88N>A | p.Ala30Thr | p.A30T | Q9UI43 | protein_coding | tolerated(0.3) | benign(0.048) | TCGA-EI-6917-01 | Colorectum | rectum adenocarcinoma | Male | <65 | III/IV | Chemotherapy | 5fluorouracil+oxaciplatina+l-folinian | SD |
| MRM2 | SNV | Missense_Mutation | novel | c.547G>T | p.Asp183Tyr | p.D183Y | Q9UI43 | protein_coding | deleterious(0.04) | benign(0.224) | TCGA-AP-A051-01 | Endometrium | uterine corpus endometrioid carcinoma | Female | >=65 | I/II | Unknown | Unknown | SD |
| MRM2 | SNV | Missense_Mutation | novel | c.678N>T | p.Glu226Asp | p.E226D | Q9UI43 | protein_coding | tolerated(0.75) | benign(0.174) | TCGA-AX-A06F-01 | Endometrium | uterine corpus endometrioid carcinoma | Female | <65 | III/IV | Chemotherapy | carboplatin | SD |
| MRM2 | SNV | Missense_Mutation | novel | c.68N>A | p.Arg23His | p.R23H | Q9UI43 | protein_coding | tolerated(0.8) | benign(0) | TCGA-AX-A1CE-01 | Endometrium | uterine corpus endometrioid carcinoma | Female | <65 | I/II | Unspecific | Paclitaxel | SD |
| MRM2 | SNV | Missense_Mutation | rs758318346 | c.388N>A | p.Val130Met | p.V130M | Q9UI43 | protein_coding | tolerated(0.06) | possibly_damaging(0.663) | TCGA-EO-A22R-01 | Endometrium | uterine corpus endometrioid carcinoma | Female | <65 | I/II | Unknown | Unknown | SD |
| MRM2 | SNV | Missense_Mutation | c.276N>C | p.Gln92His | p.Q92H | Q9UI43 | protein_coding | tolerated(0.09) | benign(0.023) | TCGA-ED-A7PZ-01 | Liver | liver hepatocellular carcinoma | Male | <65 | I/II | Unknown | Unknown | SD |
| Page: 1 2 3 |
Top |
Related drugs of malignant transformation related genes |
| Identification of chemicals and drugs interact with genes involved in malignant transfromation |
| (DGIdb 4.0) |
| Entrez ID | Symbol | Category | Interaction Types | Drug Claim Name | Drug Name | PMIDs |
| 29960 | MRM2 | NA | Plazomicin | PLAZOMICIN |
| Page: 1 |

Copyright 2023-Present -The University of Texas Health Science Center at Houston |