
|
|||||
|
 | |
| |
| |
| |
| |
| |
|
Gene: MRI1 |
Gene summary for MRI1 |
| Gene information | Species | Human | Gene symbol | MRI1 | Gene ID | 84245 |
| Gene name | methylthioribose-1-phosphate isomerase 1 | |
| Gene Alias | M1Pi | |
| Cytomap | 19p13.13 | |
| Gene Type | protein-coding | GO ID | GO:0000096 | UniProtAcc | Q9BV20 |
Top |
Malignant transformation analysis |
| Identification of the aberrant gene expression in precancerous and cancerous lesions by comparing the gene expression of stem-like cells in diseased tissues with normal stem cells |
| Entrez ID | Symbol | Replicates | Species | Organ | Tissue | Adj P-value | Log2FC | Malignancy |
| 84245 | MRI1 | LZE4T | Human | Esophagus | ESCC | 7.31e-04 | 2.05e-01 | 0.0811 |
| 84245 | MRI1 | LZE7T | Human | Esophagus | ESCC | 3.43e-02 | 1.50e-01 | 0.0667 |
| 84245 | MRI1 | LZE24T | Human | Esophagus | ESCC | 6.41e-09 | 2.06e-01 | 0.0596 |
| 84245 | MRI1 | P1T-E | Human | Esophagus | ESCC | 2.04e-07 | 3.21e-01 | 0.0875 |
| 84245 | MRI1 | P2T-E | Human | Esophagus | ESCC | 2.10e-11 | 1.87e-01 | 0.1177 |
| 84245 | MRI1 | P4T-E | Human | Esophagus | ESCC | 6.53e-10 | 1.50e-01 | 0.1323 |
| 84245 | MRI1 | P5T-E | Human | Esophagus | ESCC | 3.34e-08 | 1.58e-01 | 0.1327 |
| 84245 | MRI1 | P8T-E | Human | Esophagus | ESCC | 7.99e-10 | 1.80e-01 | 0.0889 |
| 84245 | MRI1 | P9T-E | Human | Esophagus | ESCC | 1.18e-07 | 1.69e-01 | 0.1131 |
| 84245 | MRI1 | P10T-E | Human | Esophagus | ESCC | 1.07e-14 | 2.81e-01 | 0.116 |
| 84245 | MRI1 | P11T-E | Human | Esophagus | ESCC | 7.05e-07 | 3.75e-01 | 0.1426 |
| 84245 | MRI1 | P12T-E | Human | Esophagus | ESCC | 2.71e-18 | 2.15e-01 | 0.1122 |
| 84245 | MRI1 | P15T-E | Human | Esophagus | ESCC | 2.66e-08 | 1.59e-01 | 0.1149 |
| 84245 | MRI1 | P16T-E | Human | Esophagus | ESCC | 7.61e-06 | 1.38e-01 | 0.1153 |
| 84245 | MRI1 | P17T-E | Human | Esophagus | ESCC | 2.74e-03 | 2.58e-01 | 0.1278 |
| 84245 | MRI1 | P19T-E | Human | Esophagus | ESCC | 7.59e-04 | 3.18e-01 | 0.1662 |
| 84245 | MRI1 | P20T-E | Human | Esophagus | ESCC | 3.40e-19 | 4.62e-01 | 0.1124 |
| 84245 | MRI1 | P21T-E | Human | Esophagus | ESCC | 8.80e-13 | 1.97e-01 | 0.1617 |
| 84245 | MRI1 | P22T-E | Human | Esophagus | ESCC | 2.96e-12 | 1.87e-01 | 0.1236 |
| 84245 | MRI1 | P23T-E | Human | Esophagus | ESCC | 1.22e-13 | 3.29e-01 | 0.108 |
| Page: 1 2 3 4 |
| Tissue | Expression Dynamics | Abbreviation |
| Esophagus | 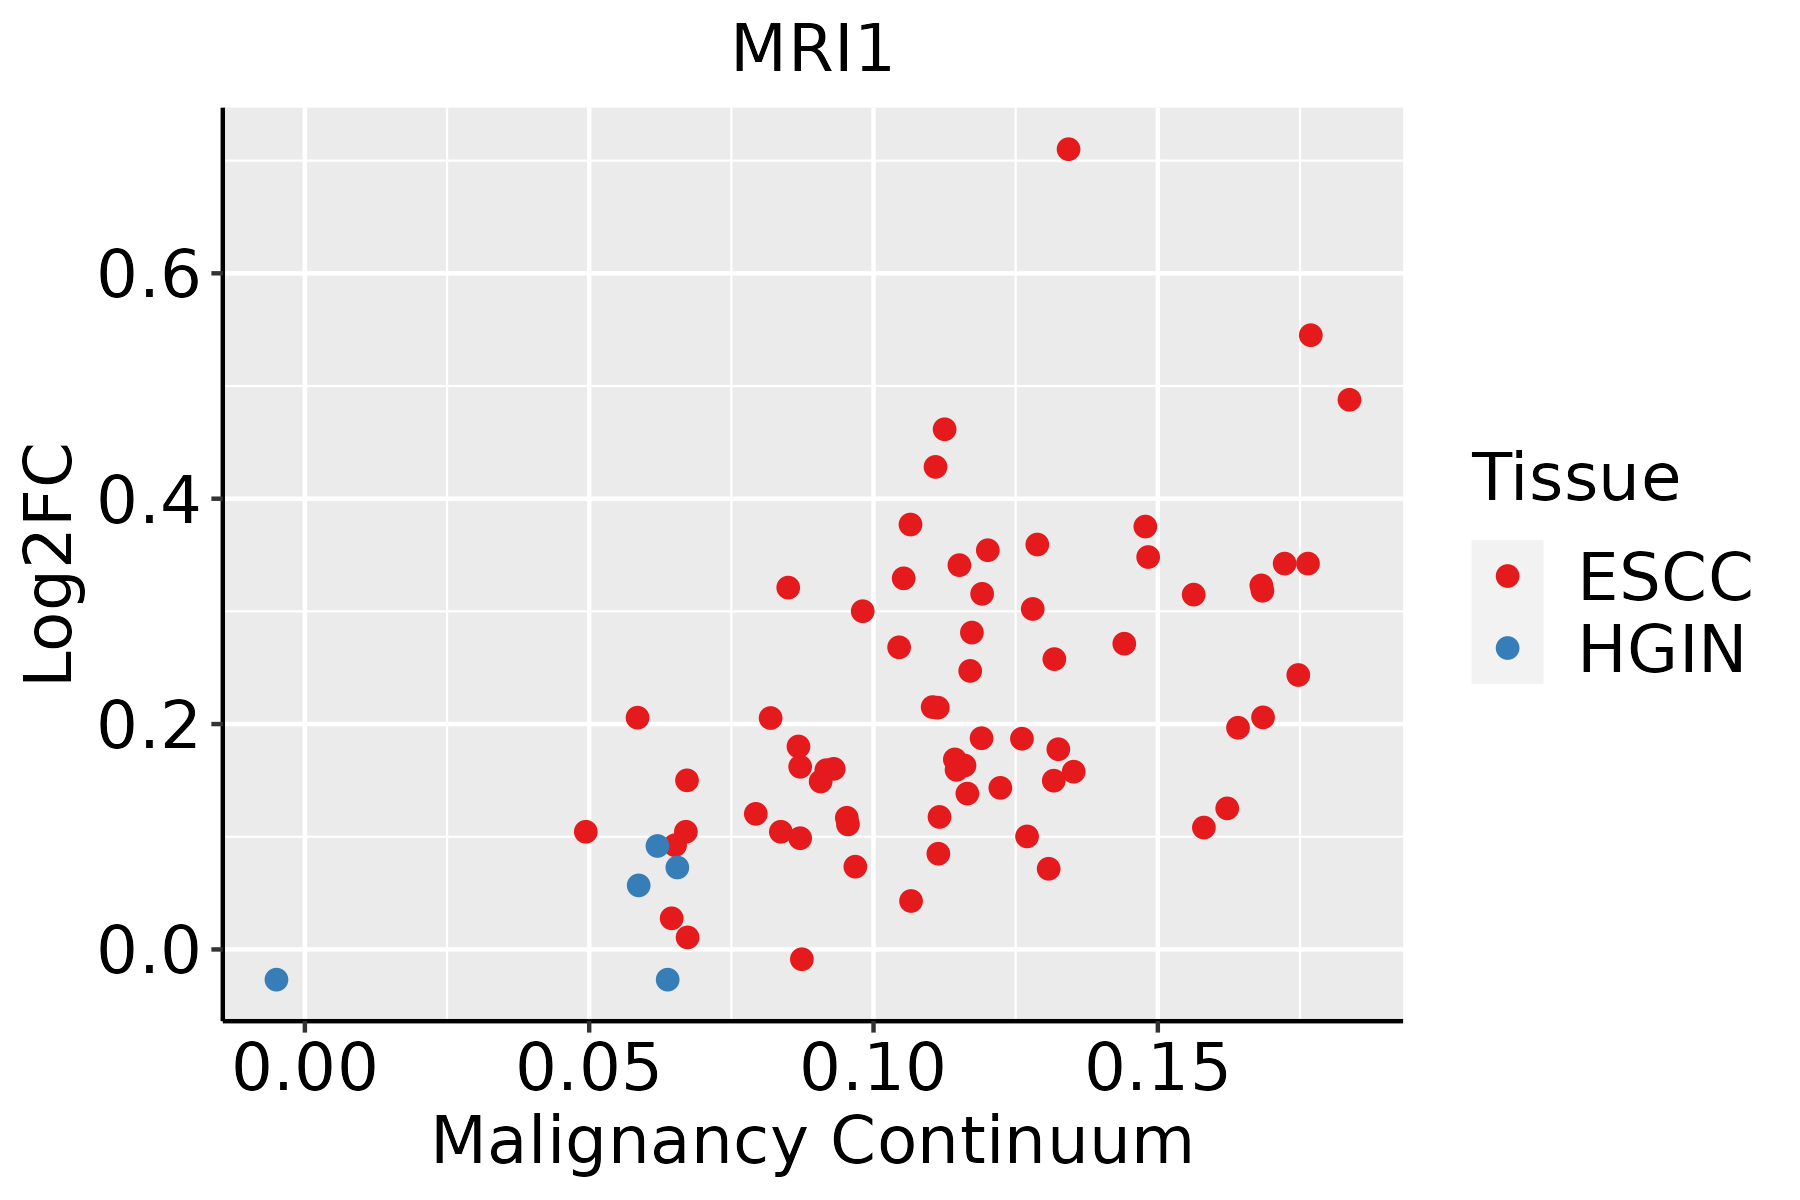 | ESCC: Esophageal squamous cell carcinoma |
| HGIN: High-grade intraepithelial neoplasias | ||
| LGIN: Low-grade intraepithelial neoplasias | ||
| Liver |  | HCC: Hepatocellular carcinoma |
| NAFLD: Non-alcoholic fatty liver disease | ||
| Thyroid | 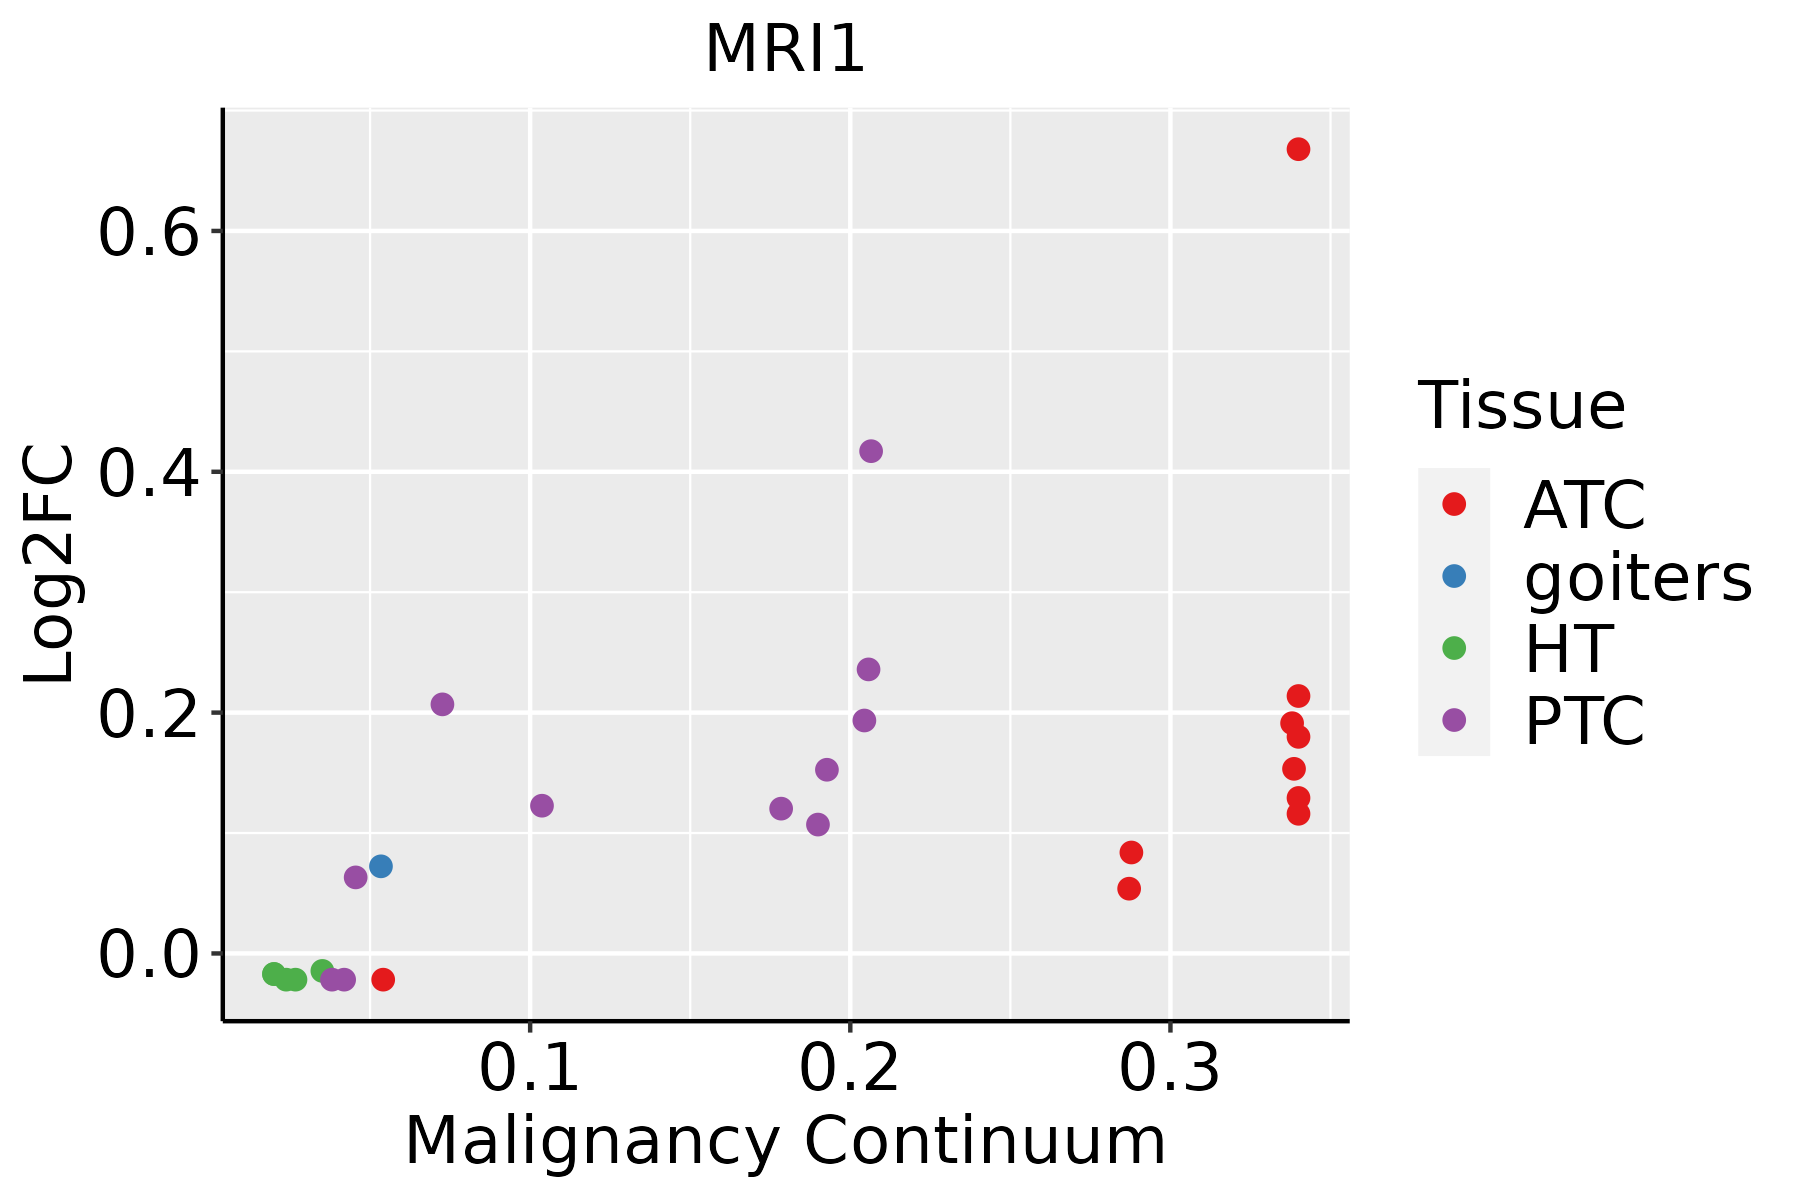 | ATC: Anaplastic thyroid cancer |
| HT: Hashimoto's thyroiditis | ||
| PTC: Papillary thyroid cancer |
| ∗log2FC in expression of this searched gene in stem-like cells from each diseased tissue sample relative to stem-like cells in normal samples in each tissue plotted against the malignancy continuum. Samples are colored based on if they are from different disease stage. |
Top |
Malignant transformation related pathway analysis |
| Find out the enriched GO biological processes and KEGG pathways involved in transition from healthy to precancer to cancer |
| Tissue | Disease Stage | Enriched GO biological Processes |
| Colorectum | AD |  |
| Colorectum | SER |  |
| Colorectum | MSS |  |
| Colorectum | MSI-H |  |
| Colorectum | FAP |  |
| ∗Top 15 enriched GO BP terms are showed in the bar plot of each disease state in each tissue. Each row represents a significant GO biological process which is colored according to the -log10(p.adjust). |
| Page: 1 2 3 4 5 6 7 8 9 |
| GO ID | Tissue | Disease Stage | Description | Gene Ratio | Bg Ratio | pvalue | p.adjust | Count |
| GO:00067906 | Esophagus | ESCC | sulfur compound metabolic process | 201/8552 | 339/18723 | 2.64e-07 | 3.94e-06 | 201 |
| GO:00442725 | Esophagus | ESCC | sulfur compound biosynthetic process | 96/8552 | 148/18723 | 1.86e-06 | 2.16e-05 | 96 |
| GO:00086525 | Esophagus | ESCC | cellular amino acid biosynthetic process | 51/8552 | 76/18723 | 1.30e-04 | 8.88e-04 | 51 |
| GO:00463948 | Esophagus | ESCC | carboxylic acid biosynthetic process | 175/8552 | 314/18723 | 1.98e-04 | 1.26e-03 | 175 |
| GO:00160538 | Esophagus | ESCC | organic acid biosynthetic process | 175/8552 | 316/18723 | 3.04e-04 | 1.82e-03 | 175 |
| GO:19016075 | Esophagus | ESCC | alpha-amino acid biosynthetic process | 45/8552 | 68/18723 | 5.13e-04 | 2.84e-03 | 45 |
| GO:00090674 | Esophagus | ESCC | aspartate family amino acid biosynthetic process | 17/8552 | 21/18723 | 1.03e-03 | 5.19e-03 | 17 |
| GO:00090862 | Esophagus | ESCC | methionine biosynthetic process | 10/8552 | 12/18723 | 8.94e-03 | 3.12e-02 | 10 |
| GO:00430941 | Esophagus | ESCC | cellular metabolic compound salvage | 18/8552 | 26/18723 | 1.32e-02 | 4.31e-02 | 18 |
| GO:001605321 | Liver | HCC | organic acid biosynthetic process | 200/7958 | 316/18723 | 5.24e-14 | 3.22e-12 | 200 |
| GO:000679021 | Liver | HCC | sulfur compound metabolic process | 212/7958 | 339/18723 | 5.60e-14 | 3.39e-12 | 212 |
| GO:004639421 | Liver | HCC | carboxylic acid biosynthetic process | 198/7958 | 314/18723 | 1.19e-13 | 6.78e-12 | 198 |
| GO:00086522 | Liver | HCC | cellular amino acid biosynthetic process | 58/7958 | 76/18723 | 1.98e-09 | 5.63e-08 | 58 |
| GO:19016052 | Liver | HCC | alpha-amino acid metabolic process | 124/7958 | 195/18723 | 2.07e-09 | 5.79e-08 | 124 |
| GO:19016072 | Liver | HCC | alpha-amino acid biosynthetic process | 53/7958 | 68/18723 | 2.62e-09 | 7.16e-08 | 53 |
| GO:00065202 | Liver | HCC | cellular amino acid metabolic process | 167/7958 | 284/18723 | 1.91e-08 | 4.56e-07 | 167 |
| GO:00442722 | Liver | HCC | sulfur compound biosynthetic process | 95/7958 | 148/18723 | 7.89e-08 | 1.58e-06 | 95 |
| GO:00000962 | Liver | HCC | sulfur amino acid metabolic process | 29/7958 | 34/18723 | 3.26e-07 | 5.62e-06 | 29 |
| GO:00090672 | Liver | HCC | aspartate family amino acid biosynthetic process | 19/7958 | 21/18723 | 6.44e-06 | 7.84e-05 | 19 |
| GO:00090861 | Liver | HCC | methionine biosynthetic process | 12/7958 | 12/18723 | 3.46e-05 | 3.45e-04 | 12 |
| Page: 1 2 |
| Pathway ID | Tissue | Disease Stage | Description | Gene Ratio | Bg Ratio | pvalue | p.adjust | qvalue | Count |
| hsa002702 | Liver | HCC | Cysteine and methionine metabolism | 35/4020 | 52/8465 | 3.03e-03 | 9.94e-03 | 5.53e-03 | 35 |
| hsa002703 | Liver | HCC | Cysteine and methionine metabolism | 35/4020 | 52/8465 | 3.03e-03 | 9.94e-03 | 5.53e-03 | 35 |
| Page: 1 |
Top |
Cell-cell communication analysis |
| Identification of potential cell-cell interactions between two cell types and their ligand-receptor pairs for different disease states |
| Ligand | Receptor | LRpair | Pathway | Tissue | Disease Stage |
| Page: 1 |
Top |
Single-cell gene regulatory network inference analysis |
| Find out the significant the regulons (TFs) and the target genes of each regulon across cell types for different disease states |
| TF | Cell Type | Tissue | Disease Stage | Target Gene | RSS | Regulon Activity |
| ∗The dot plots of a searched regulon are shown for all cell subpopulations in each disease state of each tissue based on the regulon specific score inferred using pySCENIC and by calculating the average expression. |
| Page: 1 |
Top |
Somatic mutation of malignant transformation related genes |
| Annotation of somatic variants for genes involved in malignant transformation |
| Hugo Symbol | Variant Class | Variant Classification | dbSNP RS | HGVSc | HGVSp | HGVSp Short | SWISSPROT | BIOTYPE | SIFT | PolyPhen | Tumor Sample Barcode | Tissue | Histology | Sex | Age | Stage | Therapy Types | Drugs | Outcome |
| MRI1 | SNV | Missense_Mutation | c.1039N>A | p.Glu347Lys | p.E347K | Q9BV20 | protein_coding | tolerated(0.73) | benign(0.001) | TCGA-AC-A23H-01 | Breast | breast invasive carcinoma | Female | >=65 | I/II | Unknown | Unknown | PD | |
| MRI1 | SNV | Missense_Mutation | c.547N>T | p.Gly183Cys | p.G183C | Q9BV20 | protein_coding | deleterious(0) | probably_damaging(1) | TCGA-BH-A18G-01 | Breast | breast invasive carcinoma | Female | >=65 | I/II | Unknown | Unknown | SD | |
| MRI1 | SNV | Missense_Mutation | novel | c.882G>C | p.Glu294Asp | p.E294D | Q9BV20 | protein_coding | tolerated(0.98) | benign(0.003) | TCGA-E9-A226-01 | Breast | breast invasive carcinoma | Female | <65 | III/IV | Hormone Therapy | tamoxiphen | PD |
| MRI1 | deletion | Frame_Shift_Del | rs751646149 | c.988delC | p.His330ThrfsTer24 | p.H330Tfs*24 | Q9BV20 | protein_coding | TCGA-AO-A128-01 | Breast | breast invasive carcinoma | Female | <65 | I/II | Chemotherapy | doxorubicin | SD | ||
| MRI1 | insertion | Nonsense_Mutation | novel | c.1004_1005insCACTTTGGGAGGCCGAGGCGGGCAGATCACCTGAGGTCGGGAGTT | p.Gly335_Gly336insThrLeuGlyGlyArgGlyGlyGlnIleThrTerGlyArgGluPhe | p.G335_G336insTLGGRGGQIT*GREF | Q9BV20 | protein_coding | TCGA-BH-A0B1-01 | Breast | breast invasive carcinoma | Female | >=65 | I/II | Chemotherapy | adriamycin | SD | ||
| MRI1 | SNV | Missense_Mutation | novel | c.1099N>T | p.Pro367Ser | p.P367S | Q9BV20 | protein_coding | tolerated_low_confidence(0.17) | benign(0.005) | TCGA-EI-6917-01 | Colorectum | rectum adenocarcinoma | Male | <65 | III/IV | Chemotherapy | 5fluorouracil+oxaciplatina+l-folinian | SD |
| MRI1 | deletion | Frame_Shift_Del | rs751646149 | c.988delC | p.His330ThrfsTer24 | p.H330Tfs*24 | Q9BV20 | protein_coding | TCGA-5M-AAT6-01 | Colorectum | colon adenocarcinoma | Female | <65 | III/IV | Unknown | Unknown | PD | ||
| MRI1 | deletion | Frame_Shift_Del | rs751646149 | c.983delN | p.His330ThrfsTer24 | p.H330Tfs*24 | Q9BV20 | protein_coding | TCGA-A6-5665-01 | Colorectum | colon adenocarcinoma | Female | >=65 | I/II | Unknown | Unknown | PD | ||
| MRI1 | deletion | Frame_Shift_Del | rs751646149 | c.983delN | p.His330ThrfsTer24 | p.H330Tfs*24 | Q9BV20 | protein_coding | TCGA-A6-6781-01 | Colorectum | colon adenocarcinoma | Male | <65 | III/IV | Chemotherapy | oxaliplatin | SD | ||
| MRI1 | deletion | Frame_Shift_Del | rs751646149 | c.983delN | p.His330ThrfsTer24 | p.H330Tfs*24 | Q9BV20 | protein_coding | TCGA-AA-3815-01 | Colorectum | colon adenocarcinoma | Female | >=65 | I/II | Unknown | Unknown | SD |
| Page: 1 2 3 4 |
Top |
Related drugs of malignant transformation related genes |
| Identification of chemicals and drugs interact with genes involved in malignant transfromation |
| (DGIdb 4.0) |
| Entrez ID | Symbol | Category | Interaction Types | Drug Claim Name | Drug Name | PMIDs |
| Page: 1 |

Copyright 2023-Present -The University of Texas Health Science Center at Houston |