
|
|||||
|
 | |
| |
| |
| |
| |
| |
|
Gene: MRGBP |
Gene summary for MRGBP |
| Gene information | Species | Human | Gene symbol | MRGBP | Gene ID | 55257 |
| Gene name | MRG domain binding protein | |
| Gene Alias | C20orf20 | |
| Cytomap | 20q13.33 | |
| Gene Type | protein-coding | GO ID | GO:0006139 | UniProtAcc | Q9NV56 |
Top |
Malignant transformation analysis |
| Identification of the aberrant gene expression in precancerous and cancerous lesions by comparing the gene expression of stem-like cells in diseased tissues with normal stem cells |
| Entrez ID | Symbol | Replicates | Species | Organ | Tissue | Adj P-value | Log2FC | Malignancy |
| 55257 | MRGBP | LZE4T | Human | Esophagus | ESCC | 4.97e-08 | 1.60e-01 | 0.0811 |
| 55257 | MRGBP | LZE7T | Human | Esophagus | ESCC | 2.08e-02 | 1.44e-01 | 0.0667 |
| 55257 | MRGBP | LZE20T | Human | Esophagus | ESCC | 1.75e-07 | 1.65e-01 | 0.0662 |
| 55257 | MRGBP | LZE24T | Human | Esophagus | ESCC | 6.18e-11 | 2.46e-01 | 0.0596 |
| 55257 | MRGBP | LZE6T | Human | Esophagus | ESCC | 7.52e-03 | 1.39e-01 | 0.0845 |
| 55257 | MRGBP | P1T-E | Human | Esophagus | ESCC | 1.11e-02 | 1.52e-01 | 0.0875 |
| 55257 | MRGBP | P2T-E | Human | Esophagus | ESCC | 8.59e-17 | 3.53e-01 | 0.1177 |
| 55257 | MRGBP | P4T-E | Human | Esophagus | ESCC | 2.80e-16 | 3.48e-01 | 0.1323 |
| 55257 | MRGBP | P5T-E | Human | Esophagus | ESCC | 1.46e-19 | 3.95e-01 | 0.1327 |
| 55257 | MRGBP | P8T-E | Human | Esophagus | ESCC | 1.84e-06 | 8.02e-02 | 0.0889 |
| 55257 | MRGBP | P9T-E | Human | Esophagus | ESCC | 1.56e-06 | 1.43e-01 | 0.1131 |
| 55257 | MRGBP | P10T-E | Human | Esophagus | ESCC | 1.39e-17 | 2.60e-01 | 0.116 |
| 55257 | MRGBP | P11T-E | Human | Esophagus | ESCC | 1.08e-10 | 3.03e-01 | 0.1426 |
| 55257 | MRGBP | P12T-E | Human | Esophagus | ESCC | 3.18e-15 | 2.45e-01 | 0.1122 |
| 55257 | MRGBP | P15T-E | Human | Esophagus | ESCC | 3.62e-16 | 2.88e-01 | 0.1149 |
| 55257 | MRGBP | P16T-E | Human | Esophagus | ESCC | 2.74e-20 | 3.03e-01 | 0.1153 |
| 55257 | MRGBP | P17T-E | Human | Esophagus | ESCC | 3.77e-03 | 1.41e-01 | 0.1278 |
| 55257 | MRGBP | P19T-E | Human | Esophagus | ESCC | 1.75e-04 | 2.81e-01 | 0.1662 |
| 55257 | MRGBP | P20T-E | Human | Esophagus | ESCC | 7.24e-10 | 2.17e-01 | 0.1124 |
| 55257 | MRGBP | P21T-E | Human | Esophagus | ESCC | 6.32e-23 | 4.47e-01 | 0.1617 |
| Page: 1 2 3 4 5 |
| Tissue | Expression Dynamics | Abbreviation |
| Esophagus | 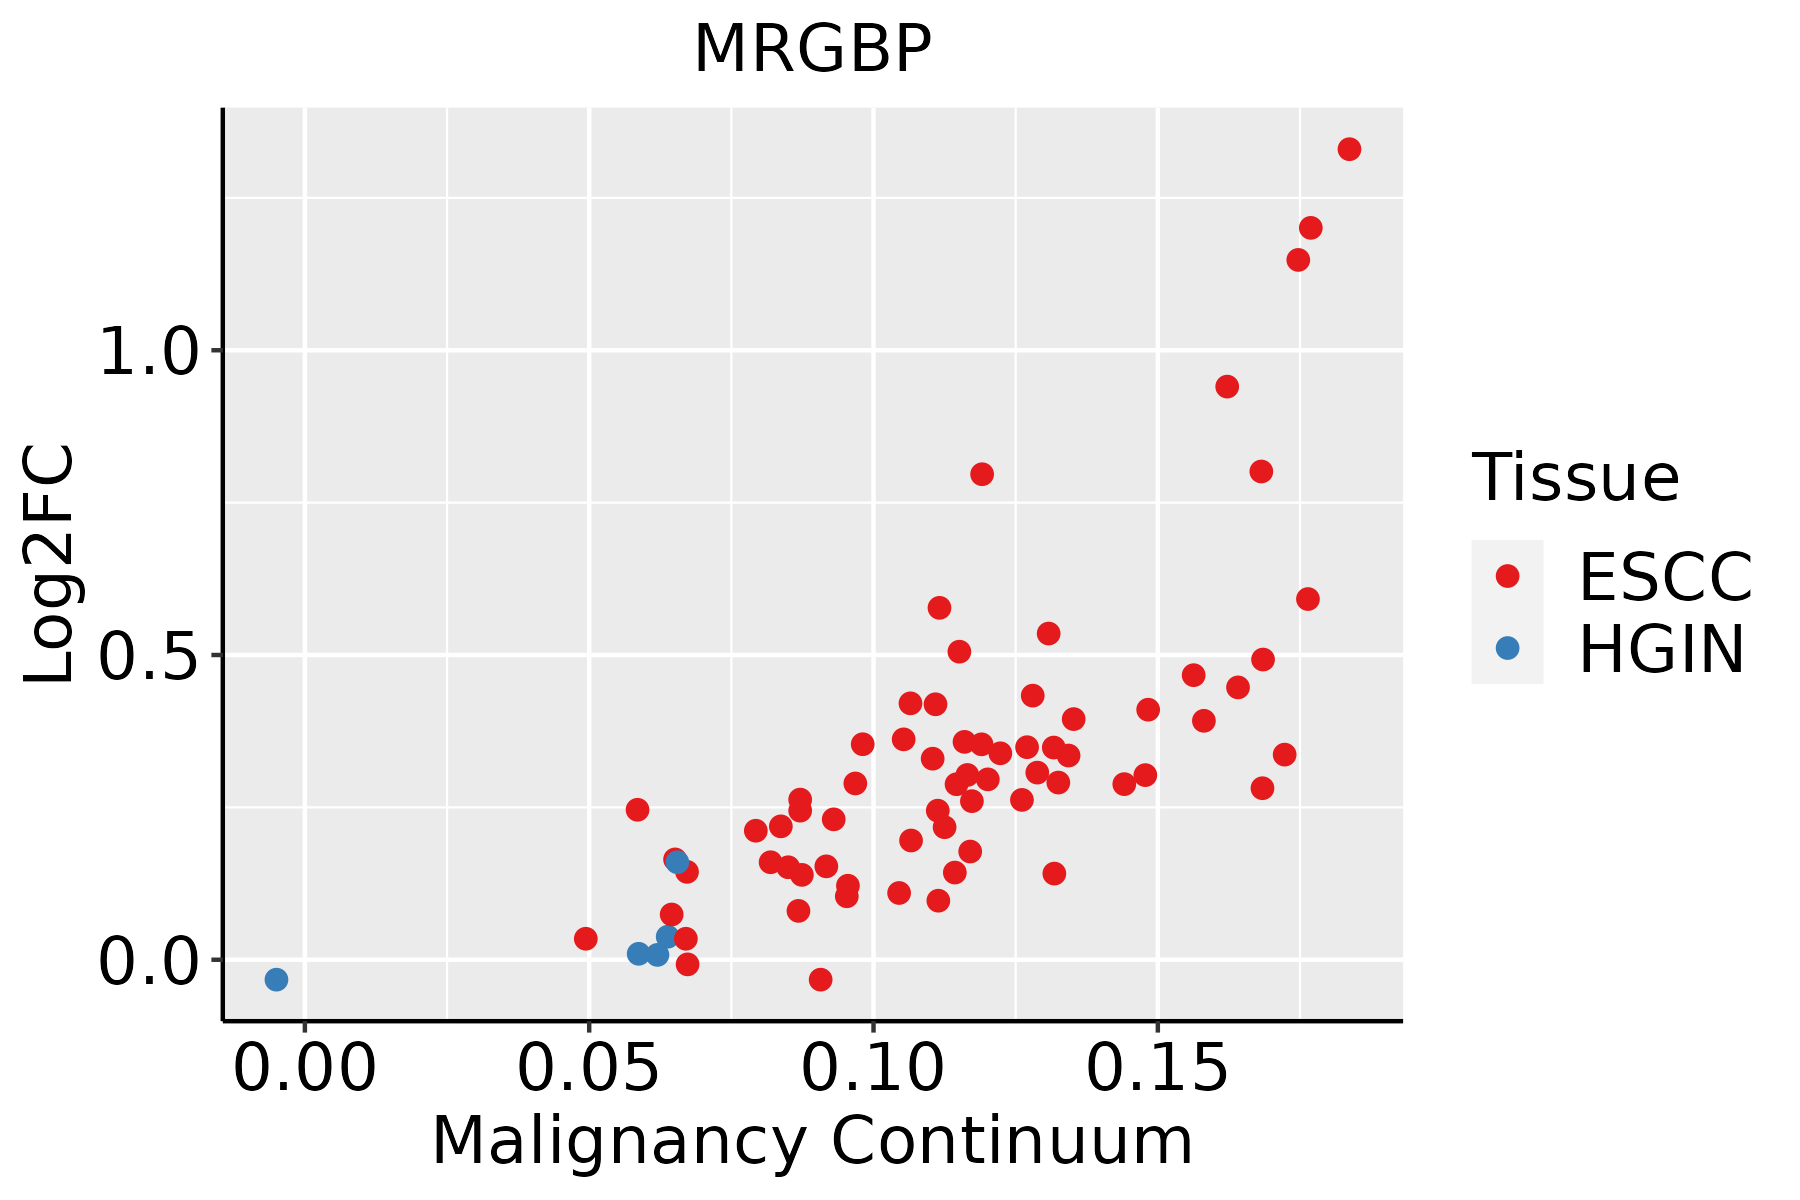 | ESCC: Esophageal squamous cell carcinoma |
| HGIN: High-grade intraepithelial neoplasias | ||
| LGIN: Low-grade intraepithelial neoplasias | ||
| Liver | 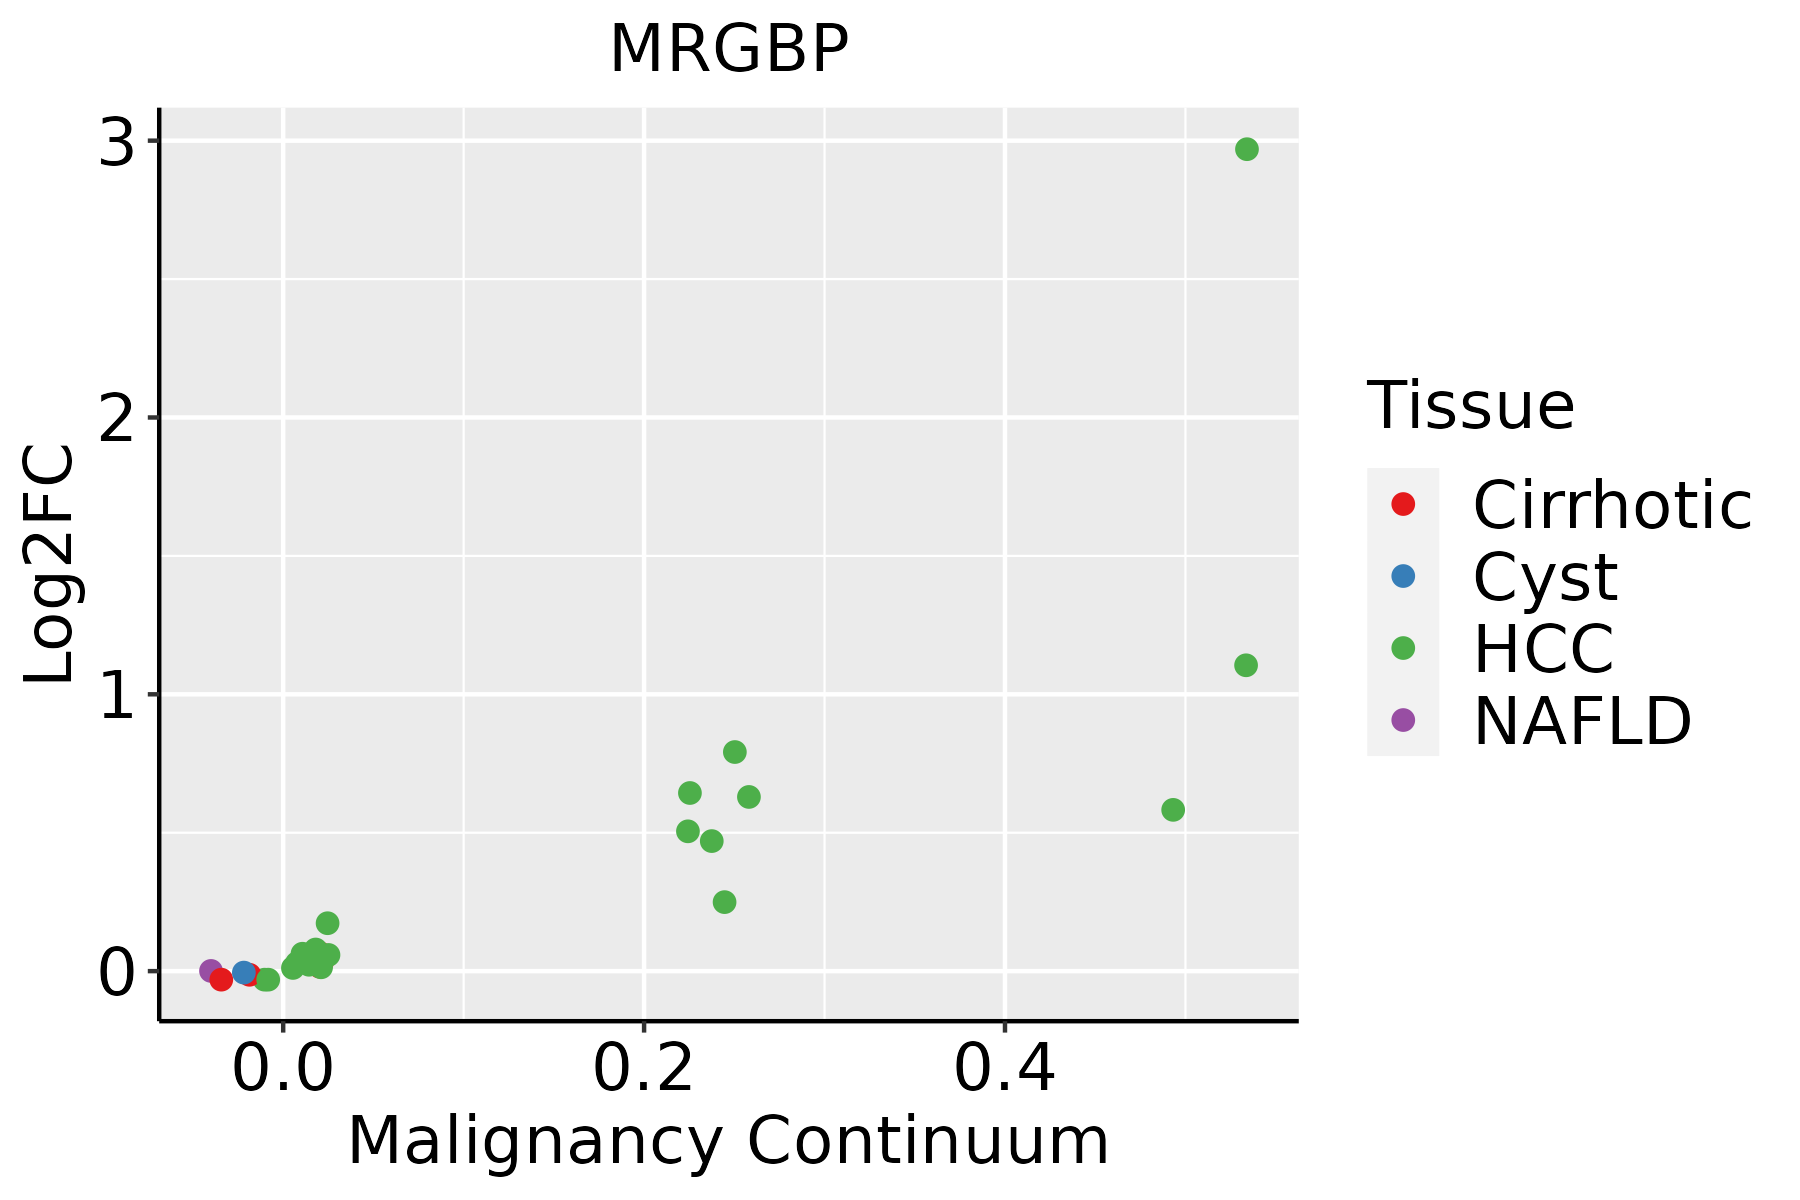 | HCC: Hepatocellular carcinoma |
| NAFLD: Non-alcoholic fatty liver disease | ||
| Oral Cavity | 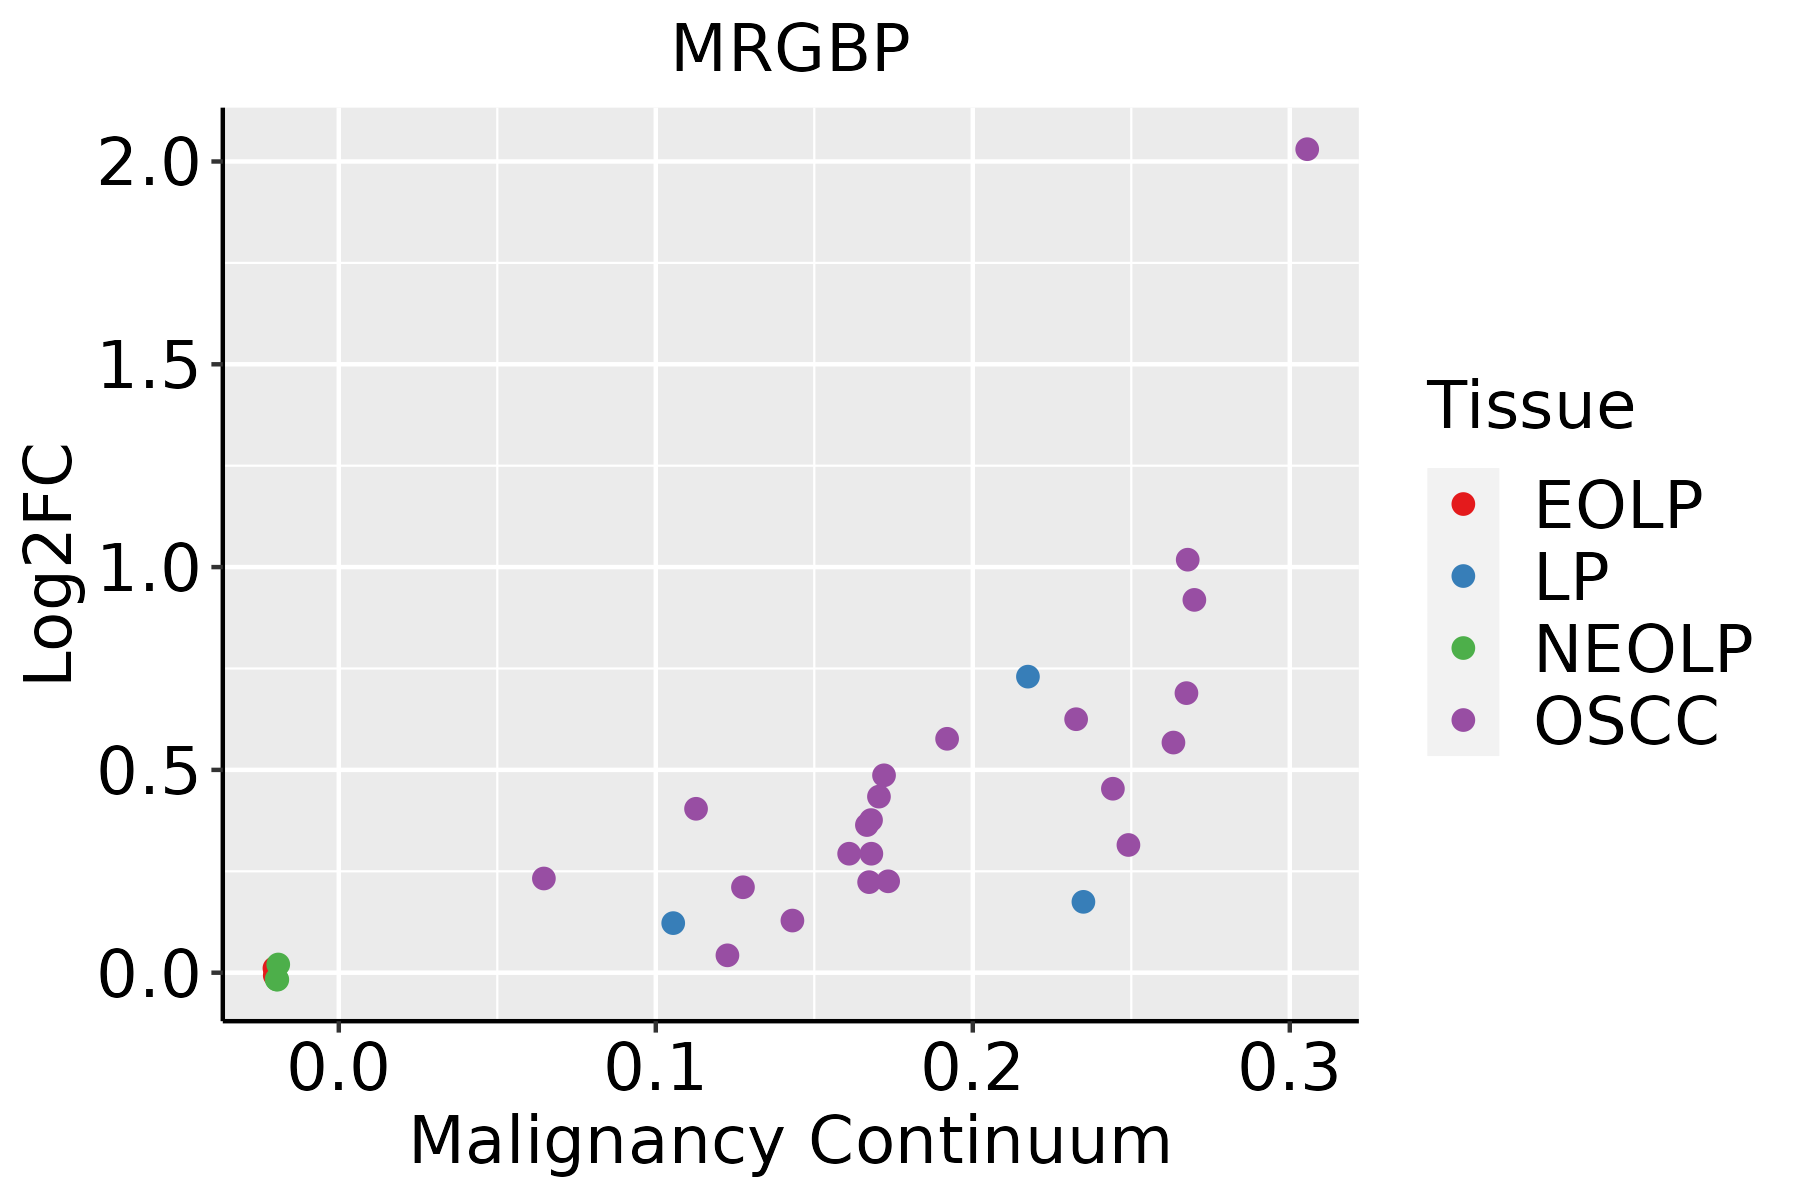 | EOLP: Erosive Oral lichen planus |
| LP: leukoplakia | ||
| NEOLP: Non-erosive oral lichen planus | ||
| OSCC: Oral squamous cell carcinoma | ||
| Skin | 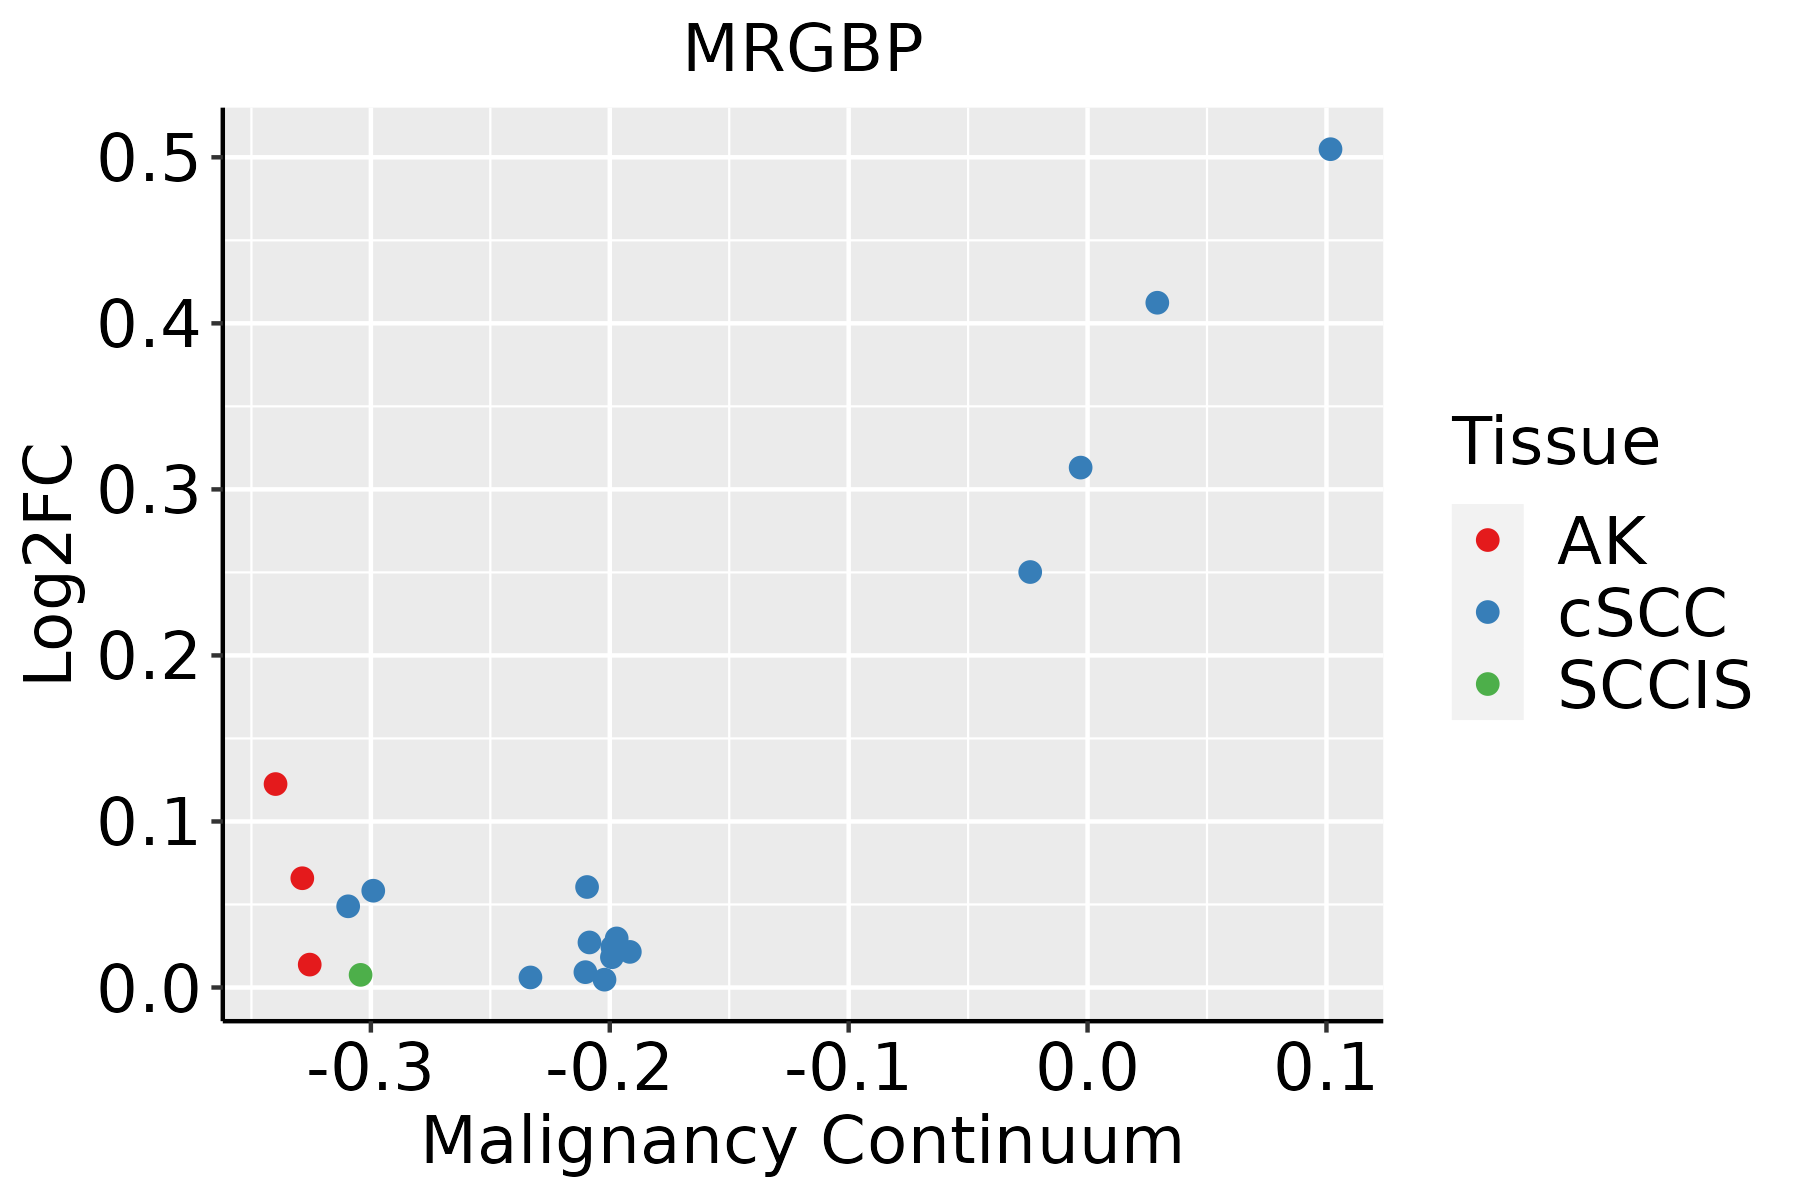 | AK: Actinic keratosis |
| cSCC: Cutaneous squamous cell carcinoma | ||
| SCCIS:squamous cell carcinoma in situ |
| ∗log2FC in expression of this searched gene in stem-like cells from each diseased tissue sample relative to stem-like cells in normal samples in each tissue plotted against the malignancy continuum. Samples are colored based on if they are from different disease stage. |
Top |
Malignant transformation related pathway analysis |
| Find out the enriched GO biological processes and KEGG pathways involved in transition from healthy to precancer to cancer |
| Tissue | Disease Stage | Enriched GO biological Processes |
| Colorectum | AD |  |
| Colorectum | SER |  |
| Colorectum | MSS |  |
| Colorectum | MSI-H |  |
| Colorectum | FAP |  |
| ∗Top 15 enriched GO BP terms are showed in the bar plot of each disease state in each tissue. Each row represents a significant GO biological process which is colored according to the -log10(p.adjust). |
| Page: 1 2 3 4 5 6 7 8 9 |
| GO ID | Tissue | Disease Stage | Description | Gene Ratio | Bg Ratio | pvalue | p.adjust | Count |
| GO:001657015 | Esophagus | ESCC | histone modification | 323/8552 | 463/18723 | 2.61e-26 | 7.88e-24 | 323 |
| GO:001820514 | Esophagus | ESCC | peptidyl-lysine modification | 259/8552 | 376/18723 | 3.90e-20 | 5.26e-18 | 259 |
| GO:001839413 | Esophagus | ESCC | peptidyl-lysine acetylation | 123/8552 | 169/18723 | 6.58e-13 | 2.94e-11 | 123 |
| GO:004354313 | Esophagus | ESCC | protein acylation | 165/8552 | 243/18723 | 1.69e-12 | 7.14e-11 | 165 |
| GO:000647313 | Esophagus | ESCC | protein acetylation | 140/8552 | 201/18723 | 4.37e-12 | 1.69e-10 | 140 |
| GO:001839313 | Esophagus | ESCC | internal peptidyl-lysine acetylation | 114/8552 | 158/18723 | 1.16e-11 | 4.24e-10 | 114 |
| GO:000647513 | Esophagus | ESCC | internal protein amino acid acetylation | 115/8552 | 160/18723 | 1.43e-11 | 5.08e-10 | 115 |
| GO:00165735 | Esophagus | ESCC | histone acetylation | 110/8552 | 152/18723 | 1.95e-11 | 6.81e-10 | 110 |
| GO:001657021 | Liver | HCC | histone modification | 283/7958 | 463/18723 | 2.68e-16 | 2.33e-14 | 283 |
| GO:00182052 | Liver | HCC | peptidyl-lysine modification | 230/7958 | 376/18723 | 1.51e-13 | 8.32e-12 | 230 |
| GO:00064732 | Liver | HCC | protein acetylation | 135/7958 | 201/18723 | 1.20e-12 | 5.92e-11 | 135 |
| GO:00435432 | Liver | HCC | protein acylation | 157/7958 | 243/18723 | 2.40e-12 | 1.12e-10 | 157 |
| GO:00183942 | Liver | HCC | peptidyl-lysine acetylation | 116/7958 | 169/18723 | 5.11e-12 | 2.23e-10 | 116 |
| GO:00064752 | Liver | HCC | internal protein amino acid acetylation | 107/7958 | 160/18723 | 3.77e-10 | 1.23e-08 | 107 |
| GO:00183932 | Liver | HCC | internal peptidyl-lysine acetylation | 105/7958 | 158/18723 | 9.48e-10 | 2.90e-08 | 105 |
| GO:00165732 | Liver | HCC | histone acetylation | 101/7958 | 152/18723 | 1.99e-09 | 5.63e-08 | 101 |
| GO:00165707 | Oral cavity | OSCC | histone modification | 270/7305 | 463/18723 | 1.59e-17 | 1.50e-15 | 270 |
| GO:00182056 | Oral cavity | OSCC | peptidyl-lysine modification | 216/7305 | 376/18723 | 2.32e-13 | 1.16e-11 | 216 |
| GO:00435434 | Oral cavity | OSCC | protein acylation | 149/7305 | 243/18723 | 1.33e-12 | 5.80e-11 | 149 |
| GO:00183944 | Oral cavity | OSCC | peptidyl-lysine acetylation | 108/7305 | 169/18723 | 4.55e-11 | 1.45e-09 | 108 |
| Page: 1 2 |
| Pathway ID | Tissue | Disease Stage | Description | Gene Ratio | Bg Ratio | pvalue | p.adjust | qvalue | Count |
| Page: 1 |
Top |
Cell-cell communication analysis |
| Identification of potential cell-cell interactions between two cell types and their ligand-receptor pairs for different disease states |
| Ligand | Receptor | LRpair | Pathway | Tissue | Disease Stage |
| Page: 1 |
Top |
Single-cell gene regulatory network inference analysis |
| Find out the significant the regulons (TFs) and the target genes of each regulon across cell types for different disease states |
| TF | Cell Type | Tissue | Disease Stage | Target Gene | RSS | Regulon Activity |
| ∗The dot plots of a searched regulon are shown for all cell subpopulations in each disease state of each tissue based on the regulon specific score inferred using pySCENIC and by calculating the average expression. |
| Page: 1 |
Top |
Somatic mutation of malignant transformation related genes |
| Annotation of somatic variants for genes involved in malignant transformation |
| Hugo Symbol | Variant Class | Variant Classification | dbSNP RS | HGVSc | HGVSp | HGVSp Short | SWISSPROT | BIOTYPE | SIFT | PolyPhen | Tumor Sample Barcode | Tissue | Histology | Sex | Age | Stage | Therapy Types | Drugs | Outcome |
| MRGBP | SNV | Missense_Mutation | novel | c.529C>T | p.Arg177Trp | p.R177W | Q9NV56 | protein_coding | deleterious(0) | probably_damaging(0.94) | TCGA-AC-A7VB-01 | Breast | breast invasive carcinoma | Female | <65 | I/II | Unknown | Unknown | SD |
| MRGBP | SNV | Missense_Mutation | c.514N>C | p.Glu172Gln | p.E172Q | Q9NV56 | protein_coding | deleterious(0.04) | benign(0.261) | TCGA-C8-A12T-01 | Breast | breast invasive carcinoma | Female | <65 | I/II | Unknown | Unknown | SD | |
| MRGBP | SNV | Missense_Mutation | novel | c.266N>T | p.Ala89Val | p.A89V | Q9NV56 | protein_coding | tolerated(0.09) | possibly_damaging(0.497) | TCGA-2W-A8YY-01 | Cervix | cervical & endocervical cancer | Female | <65 | I/II | Chemotherapy | cisplatin | CR |
| MRGBP | SNV | Missense_Mutation | c.403N>A | p.Asp135Asn | p.D135N | Q9NV56 | protein_coding | tolerated(0.06) | possibly_damaging(0.494) | TCGA-AA-3663-01 | Colorectum | colon adenocarcinoma | Male | <65 | I/II | Unknown | Unknown | SD | |
| MRGBP | SNV | Missense_Mutation | rs756019296 | c.541N>T | p.Arg181Trp | p.R181W | Q9NV56 | protein_coding | deleterious(0.01) | possibly_damaging(0.893) | TCGA-CM-6162-01 | Colorectum | colon adenocarcinoma | Female | <65 | III/IV | Chemotherapy | oxaliplatin | SD |
| MRGBP | SNV | Missense_Mutation | c.319C>A | p.Leu107Ile | p.L107I | Q9NV56 | protein_coding | deleterious(0) | probably_damaging(0.998) | TCGA-B5-A0JY-01 | Endometrium | uterine corpus endometrioid carcinoma | Female | <65 | III/IV | Chemotherapy | doxorubicin | SD | |
| MRGBP | SNV | Missense_Mutation | c.470C>T | p.Ser157Phe | p.S157F | Q9NV56 | protein_coding | deleterious(0.01) | benign(0.364) | TCGA-B5-A3FC-01 | Endometrium | uterine corpus endometrioid carcinoma | Female | <65 | I/II | Unknown | Unknown | SD | |
| MRGBP | SNV | Missense_Mutation | c.322C>A | p.Pro108Thr | p.P108T | Q9NV56 | protein_coding | deleterious(0.04) | probably_damaging(0.999) | TCGA-DD-A4NR-01 | Liver | liver hepatocellular carcinoma | Female | >=65 | I/II | Unknown | Unknown | SD | |
| MRGBP | SNV | Missense_Mutation | c.602N>T | p.Arg201Leu | p.R201L | Q9NV56 | protein_coding | deleterious(0) | probably_damaging(0.993) | TCGA-55-8085-01 | Lung | lung adenocarcinoma | Male | <65 | I/II | Unknown | Unknown | SD | |
| MRGBP | SNV | Missense_Mutation | novel | c.525N>A | p.Asp175Glu | p.D175E | Q9NV56 | protein_coding | tolerated(0.39) | benign(0.03) | TCGA-55-8204-01 | Lung | lung adenocarcinoma | Female | >=65 | I/II | Unknown | Unknown | SD |
| Page: 1 2 |
Top |
Related drugs of malignant transformation related genes |
| Identification of chemicals and drugs interact with genes involved in malignant transfromation |
| (DGIdb 4.0) |
| Entrez ID | Symbol | Category | Interaction Types | Drug Claim Name | Drug Name | PMIDs |
| Page: 1 |

Copyright 2023-Present -The University of Texas Health Science Center at Houston |