
|
|||||
|
 | |
| |
| |
| |
| |
| |
|
Gene: MREG |
Gene summary for MREG |
| Gene information | Species | Human | Gene symbol | MREG | Gene ID | 55686 |
| Gene name | melanoregulin | |
| Gene Alias | DSU | |
| Cytomap | 2q35 | |
| Gene Type | protein-coding | GO ID | GO:0006810 | UniProtAcc | Q8N565 |
Top |
Malignant transformation analysis |
| Identification of the aberrant gene expression in precancerous and cancerous lesions by comparing the gene expression of stem-like cells in diseased tissues with normal stem cells |
| Entrez ID | Symbol | Replicates | Species | Organ | Tissue | Adj P-value | Log2FC | Malignancy |
| 55686 | MREG | P2T-E | Human | Esophagus | ESCC | 4.37e-11 | 1.03e-01 | 0.1177 |
| 55686 | MREG | P4T-E | Human | Esophagus | ESCC | 1.04e-02 | 1.06e-01 | 0.1323 |
| 55686 | MREG | P5T-E | Human | Esophagus | ESCC | 2.76e-04 | 1.34e-01 | 0.1327 |
| 55686 | MREG | P8T-E | Human | Esophagus | ESCC | 6.01e-08 | 7.52e-02 | 0.0889 |
| 55686 | MREG | P9T-E | Human | Esophagus | ESCC | 2.50e-02 | 5.11e-02 | 0.1131 |
| 55686 | MREG | P12T-E | Human | Esophagus | ESCC | 2.53e-05 | 1.65e-01 | 0.1122 |
| 55686 | MREG | P16T-E | Human | Esophagus | ESCC | 3.00e-06 | 1.45e-01 | 0.1153 |
| 55686 | MREG | P20T-E | Human | Esophagus | ESCC | 5.75e-03 | 1.12e-01 | 0.1124 |
| 55686 | MREG | P21T-E | Human | Esophagus | ESCC | 2.50e-08 | 1.44e-01 | 0.1617 |
| 55686 | MREG | P22T-E | Human | Esophagus | ESCC | 1.44e-09 | 5.61e-02 | 0.1236 |
| 55686 | MREG | P23T-E | Human | Esophagus | ESCC | 3.94e-02 | 7.18e-02 | 0.108 |
| 55686 | MREG | P24T-E | Human | Esophagus | ESCC | 2.96e-05 | 1.82e-01 | 0.1287 |
| 55686 | MREG | P26T-E | Human | Esophagus | ESCC | 3.16e-06 | 1.45e-01 | 0.1276 |
| 55686 | MREG | P27T-E | Human | Esophagus | ESCC | 9.01e-07 | 8.05e-02 | 0.1055 |
| 55686 | MREG | P28T-E | Human | Esophagus | ESCC | 9.75e-08 | 2.22e-01 | 0.1149 |
| 55686 | MREG | P30T-E | Human | Esophagus | ESCC | 7.06e-05 | 2.35e-01 | 0.137 |
| 55686 | MREG | P31T-E | Human | Esophagus | ESCC | 5.87e-08 | 4.28e-02 | 0.1251 |
| 55686 | MREG | P32T-E | Human | Esophagus | ESCC | 9.33e-04 | 1.63e-01 | 0.1666 |
| 55686 | MREG | P37T-E | Human | Esophagus | ESCC | 4.54e-07 | 5.98e-02 | 0.1371 |
| 55686 | MREG | P40T-E | Human | Esophagus | ESCC | 8.22e-04 | 1.96e-01 | 0.109 |
| Page: 1 2 3 |
| Tissue | Expression Dynamics | Abbreviation |
| Esophagus | 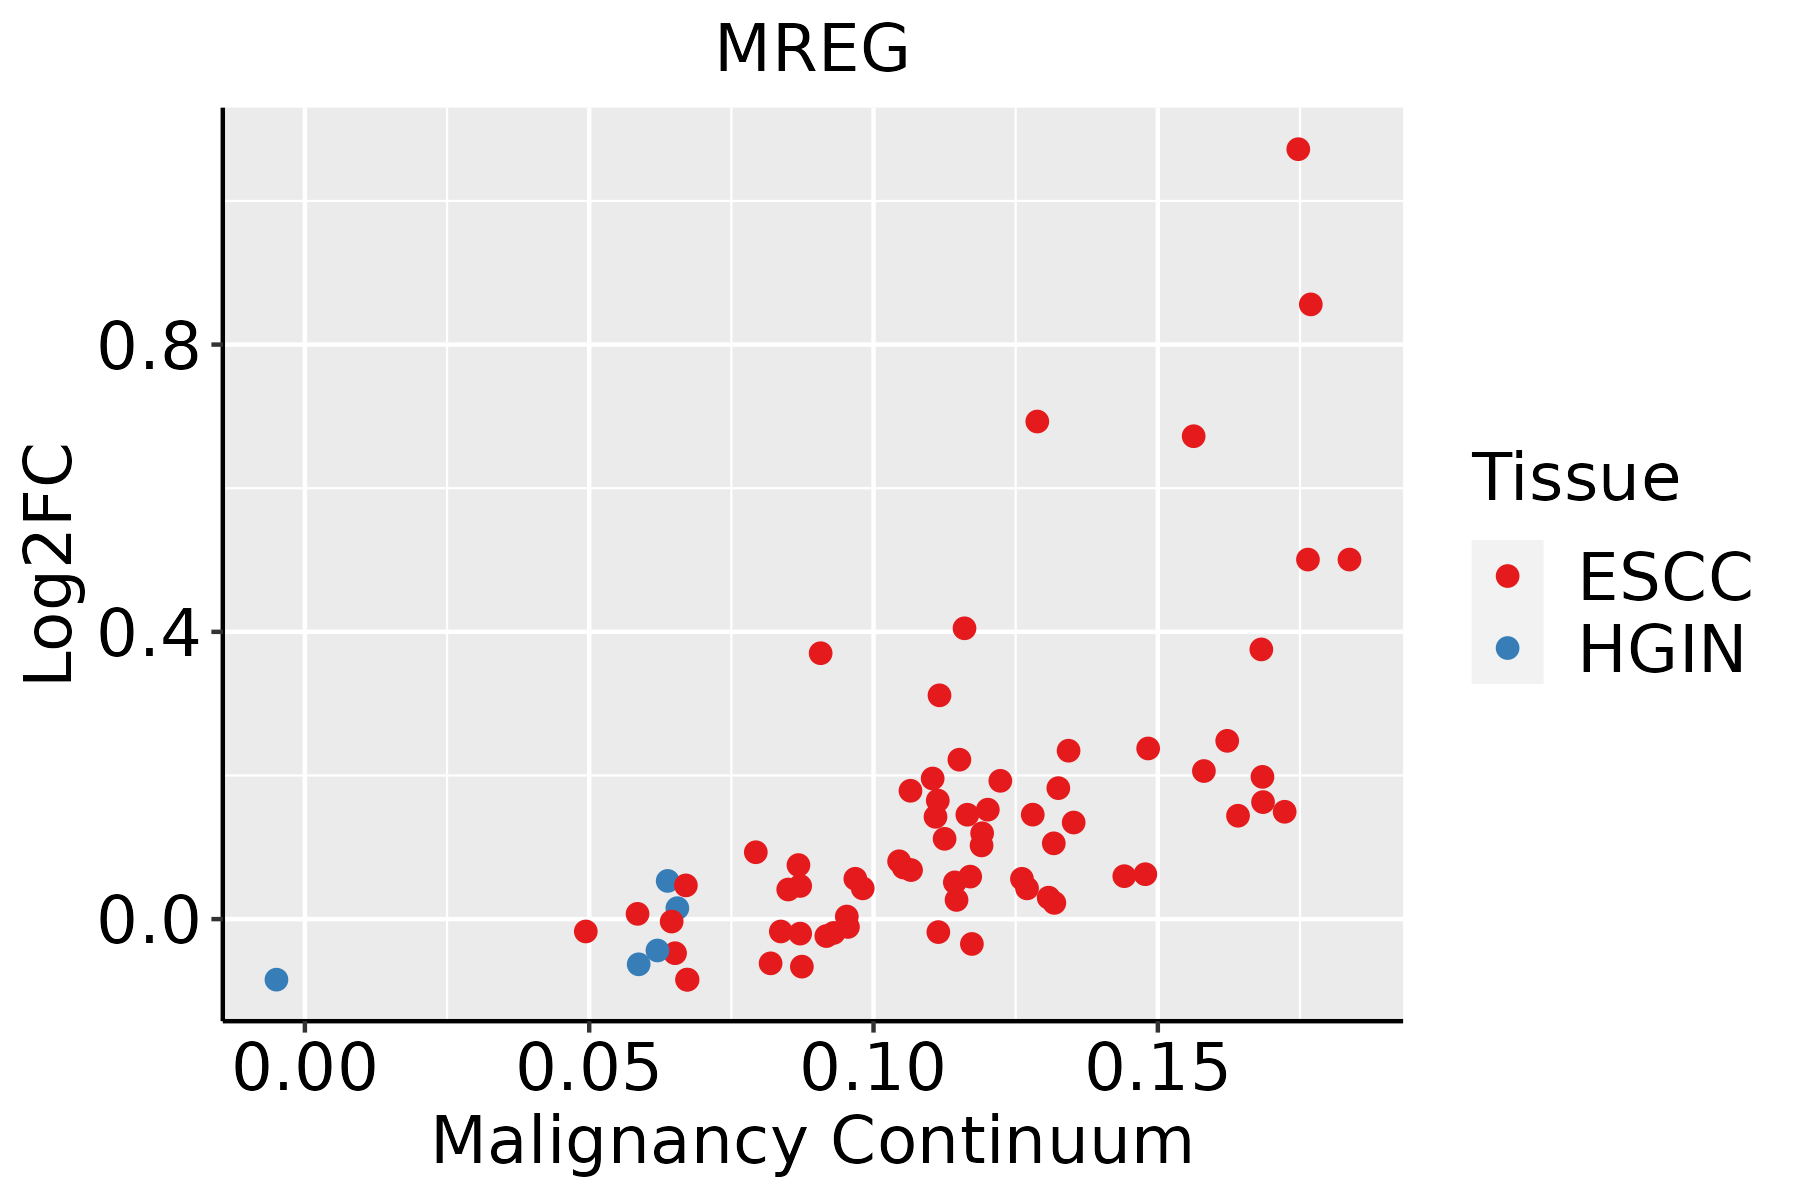 | ESCC: Esophageal squamous cell carcinoma |
| HGIN: High-grade intraepithelial neoplasias | ||
| LGIN: Low-grade intraepithelial neoplasias | ||
| Liver | 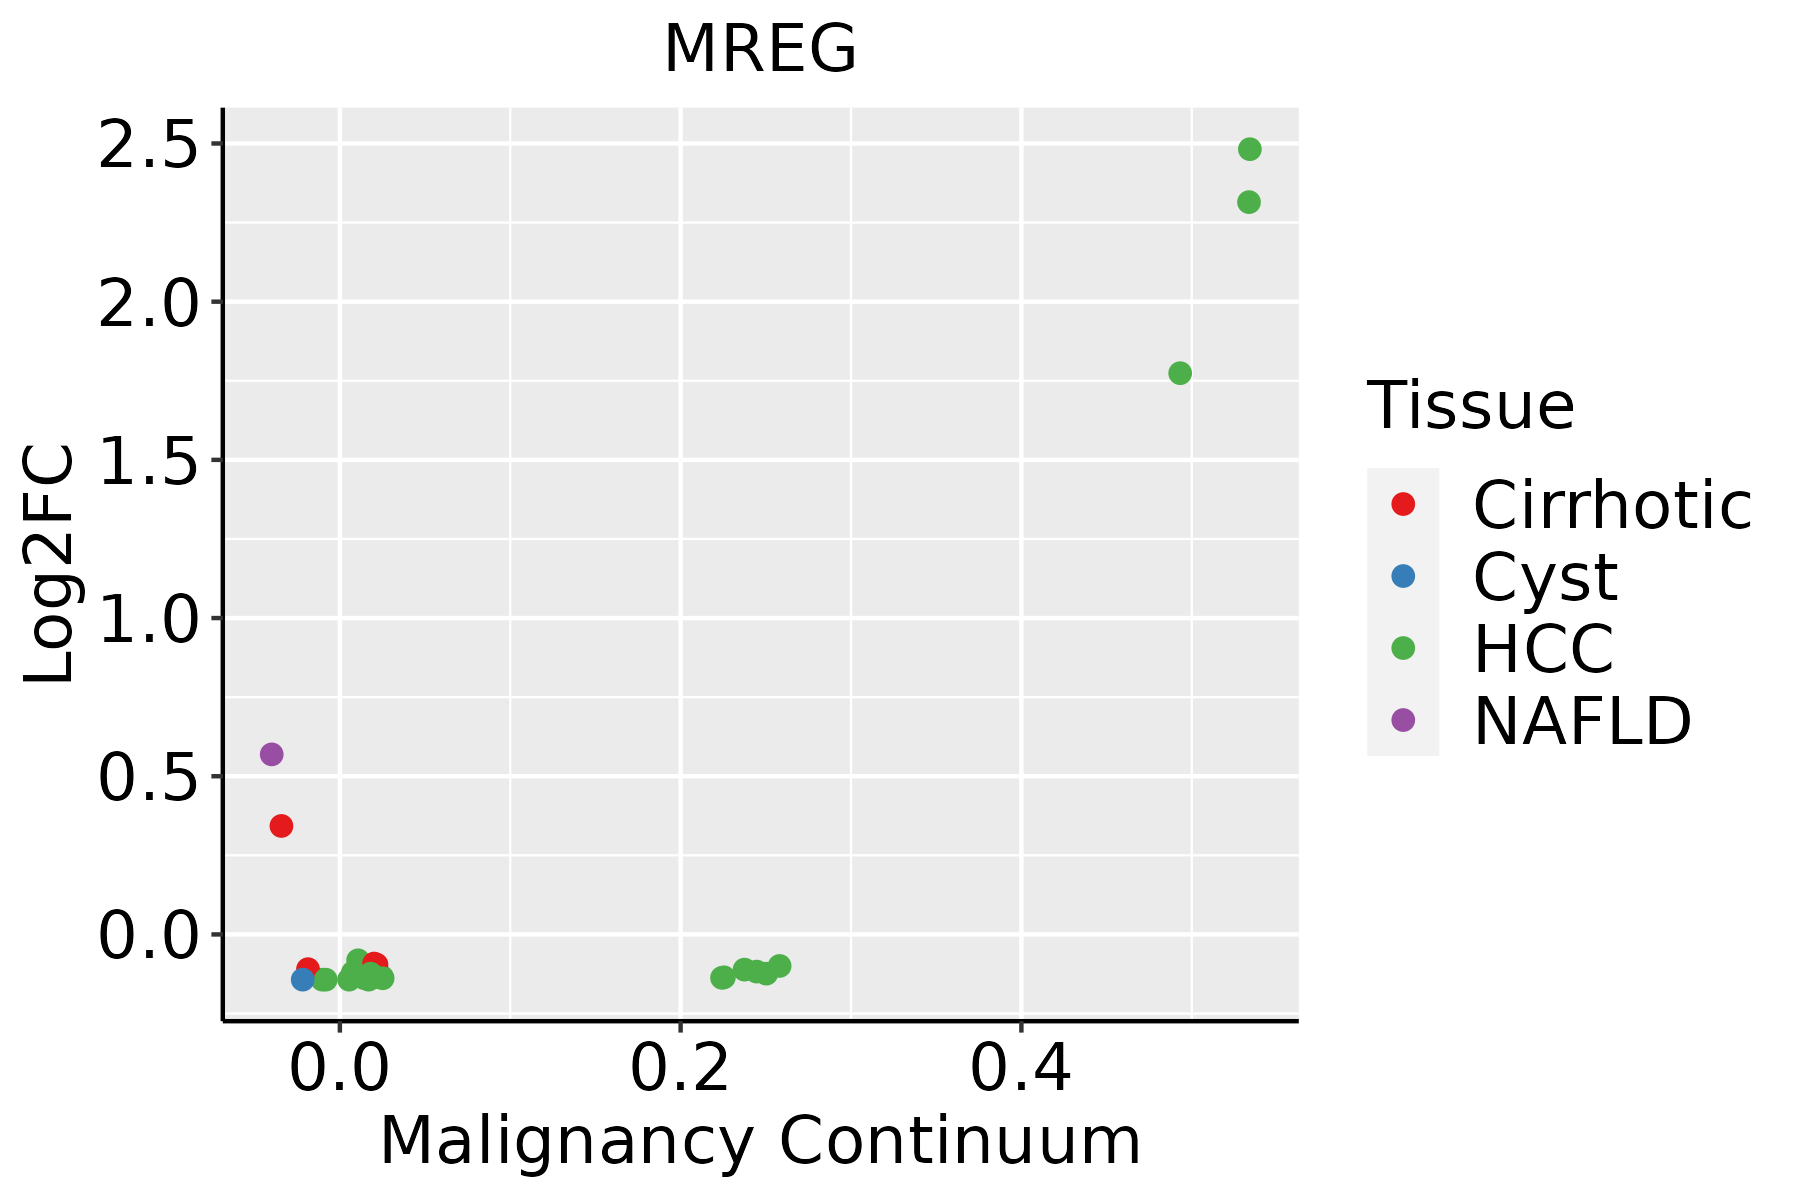 | HCC: Hepatocellular carcinoma |
| NAFLD: Non-alcoholic fatty liver disease | ||
| Oral Cavity | 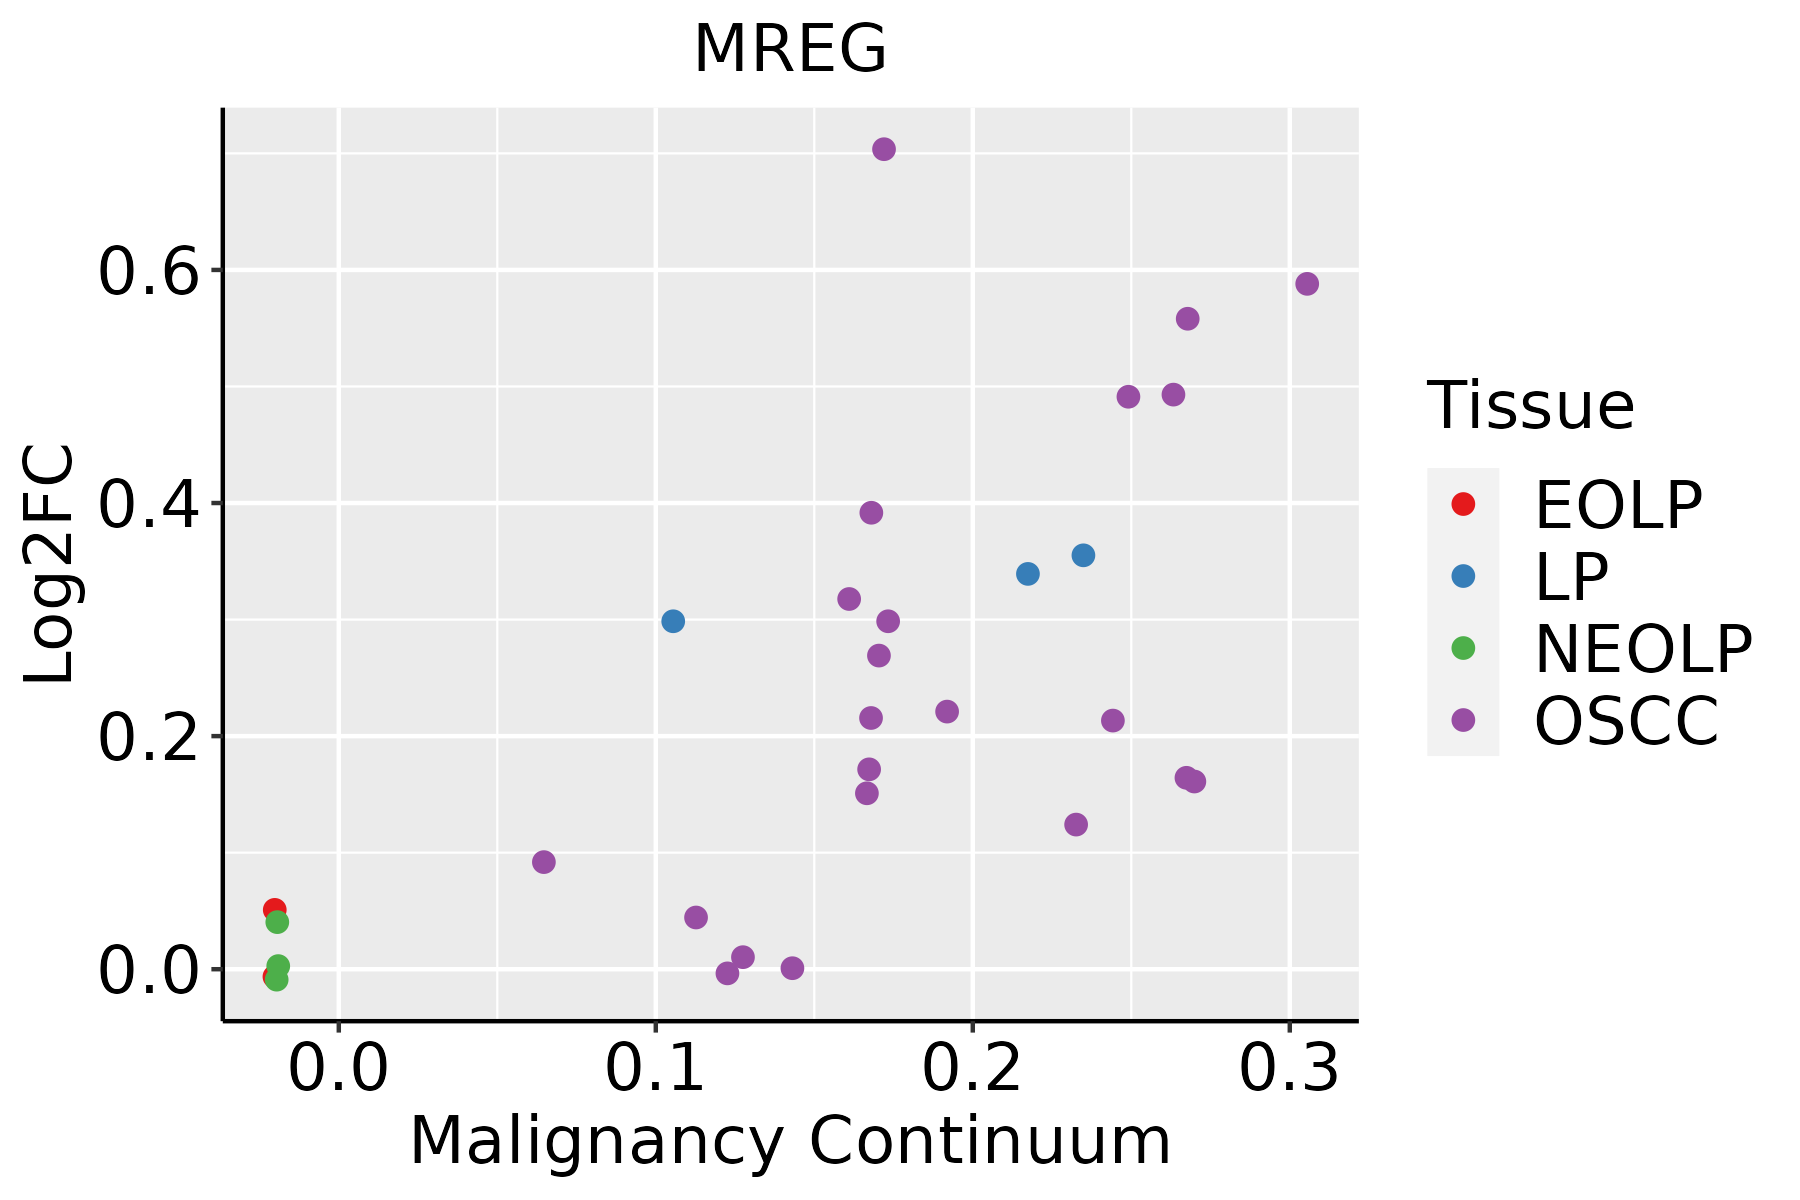 | EOLP: Erosive Oral lichen planus |
| LP: leukoplakia | ||
| NEOLP: Non-erosive oral lichen planus | ||
| OSCC: Oral squamous cell carcinoma |
| ∗log2FC in expression of this searched gene in stem-like cells from each diseased tissue sample relative to stem-like cells in normal samples in each tissue plotted against the malignancy continuum. Samples are colored based on if they are from different disease stage. |
Top |
Malignant transformation related pathway analysis |
| Find out the enriched GO biological processes and KEGG pathways involved in transition from healthy to precancer to cancer |
| Tissue | Disease Stage | Enriched GO biological Processes |
| Colorectum | AD |  |
| Colorectum | SER |  |
| Colorectum | MSS |  |
| Colorectum | MSI-H |  |
| Colorectum | FAP |  |
| ∗Top 15 enriched GO BP terms are showed in the bar plot of each disease state in each tissue. Each row represents a significant GO biological process which is colored according to the -log10(p.adjust). |
| Page: 1 2 3 4 5 6 7 8 9 |
| GO ID | Tissue | Disease Stage | Description | Gene Ratio | Bg Ratio | pvalue | p.adjust | Count |
| GO:005165617 | Esophagus | ESCC | establishment of organelle localization | 273/8552 | 390/18723 | 9.13e-23 | 1.81e-20 | 273 |
| GO:005165016 | Esophagus | ESCC | establishment of vesicle localization | 114/8552 | 161/18723 | 8.20e-11 | 2.53e-09 | 114 |
| GO:003070518 | Esophagus | ESCC | cytoskeleton-dependent intracellular transport | 133/8552 | 195/18723 | 1.48e-10 | 4.27e-09 | 133 |
| GO:001097013 | Esophagus | ESCC | transport along microtubule | 107/8552 | 155/18723 | 3.17e-09 | 6.80e-08 | 107 |
| GO:005164815 | Esophagus | ESCC | vesicle localization | 119/8552 | 177/18723 | 5.16e-09 | 1.08e-07 | 119 |
| GO:00723846 | Esophagus | ESCC | organelle transport along microtubule | 65/8552 | 85/18723 | 6.61e-09 | 1.35e-07 | 65 |
| GO:00330593 | Esophagus | ESCC | cellular pigmentation | 40/8552 | 53/18723 | 9.67e-06 | 9.21e-05 | 40 |
| GO:00991114 | Esophagus | ESCC | microtubule-based transport | 115/8552 | 190/18723 | 2.54e-05 | 2.15e-04 | 115 |
| GO:0090382 | Esophagus | ESCC | phagosome maturation | 19/8552 | 25/18723 | 2.03e-03 | 9.08e-03 | 19 |
| GO:00434731 | Esophagus | ESCC | pigmentation | 59/8552 | 98/18723 | 2.64e-03 | 1.12e-02 | 59 |
| GO:00307055 | Liver | NAFLD | cytoskeleton-dependent intracellular transport | 33/1882 | 195/18723 | 1.98e-03 | 1.98e-02 | 33 |
| GO:00516565 | Liver | NAFLD | establishment of organelle localization | 57/1882 | 390/18723 | 2.52e-03 | 2.34e-02 | 57 |
| GO:00516485 | Liver | NAFLD | vesicle localization | 30/1882 | 177/18723 | 3.01e-03 | 2.72e-02 | 30 |
| GO:00516505 | Liver | NAFLD | establishment of vesicle localization | 27/1882 | 161/18723 | 5.47e-03 | 4.20e-02 | 27 |
| GO:00109703 | Liver | NAFLD | transport along microtubule | 26/1882 | 155/18723 | 6.30e-03 | 4.69e-02 | 26 |
| GO:005165621 | Liver | HCC | establishment of organelle localization | 226/7958 | 390/18723 | 4.15e-10 | 1.34e-08 | 226 |
| GO:005165021 | Liver | HCC | establishment of vesicle localization | 103/7958 | 161/18723 | 2.94e-08 | 6.69e-07 | 103 |
| GO:005164821 | Liver | HCC | vesicle localization | 107/7958 | 177/18723 | 1.05e-06 | 1.57e-05 | 107 |
| GO:00723843 | Liver | HCC | organelle transport along microtubule | 56/7958 | 85/18723 | 1.13e-05 | 1.29e-04 | 56 |
| GO:003070521 | Liver | HCC | cytoskeleton-dependent intracellular transport | 111/7958 | 195/18723 | 3.25e-05 | 3.28e-04 | 111 |
| Page: 1 2 |
| Pathway ID | Tissue | Disease Stage | Description | Gene Ratio | Bg Ratio | pvalue | p.adjust | qvalue | Count |
| Page: 1 |
Top |
Cell-cell communication analysis |
| Identification of potential cell-cell interactions between two cell types and their ligand-receptor pairs for different disease states |
| Ligand | Receptor | LRpair | Pathway | Tissue | Disease Stage |
| Page: 1 |
Top |
Single-cell gene regulatory network inference analysis |
| Find out the significant the regulons (TFs) and the target genes of each regulon across cell types for different disease states |
| TF | Cell Type | Tissue | Disease Stage | Target Gene | RSS | Regulon Activity |
| ∗The dot plots of a searched regulon are shown for all cell subpopulations in each disease state of each tissue based on the regulon specific score inferred using pySCENIC and by calculating the average expression. |
| Page: 1 |
Top |
Somatic mutation of malignant transformation related genes |
| Annotation of somatic variants for genes involved in malignant transformation |
| Hugo Symbol | Variant Class | Variant Classification | dbSNP RS | HGVSc | HGVSp | HGVSp Short | SWISSPROT | BIOTYPE | SIFT | PolyPhen | Tumor Sample Barcode | Tissue | Histology | Sex | Age | Stage | Therapy Types | Drugs | Outcome |
| MREG | deletion | Frame_Shift_Del | novel | c.307delG | p.Glu103LysfsTer2 | p.E103Kfs*2 | Q8N565 | protein_coding | TCGA-D8-A27V-01 | Breast | breast invasive carcinoma | Female | <65 | I/II | Hormone Therapy | tamoxiphen | SD | ||
| MREG | SNV | Missense_Mutation | rs543536857 | c.563G>A | p.Arg188Gln | p.R188Q | Q8N565 | protein_coding | tolerated(0.46) | benign(0) | TCGA-AA-A00N-01 | Colorectum | colon adenocarcinoma | Male | >=65 | I/II | Unknown | Unknown | PD |
| MREG | SNV | Missense_Mutation | c.67G>A | p.Ala23Thr | p.A23T | Q8N565 | protein_coding | tolerated_low_confidence(0.18) | benign(0) | TCGA-CM-6171-01 | Colorectum | colon adenocarcinoma | Female | >=65 | I/II | Unknown | Unknown | SD | |
| MREG | SNV | Missense_Mutation | c.74C>A | p.Pro25His | p.P25H | Q8N565 | protein_coding | deleterious(0.04) | benign(0.01) | TCGA-G4-6304-01 | Colorectum | colon adenocarcinoma | Female | >=65 | I/II | Chemotherapy | fluorouracil | PD | |
| MREG | SNV | Missense_Mutation | rs543536857 | c.563G>A | p.Arg188Gln | p.R188Q | Q8N565 | protein_coding | tolerated(0.46) | benign(0) | TCGA-EI-6917-01 | Colorectum | rectum adenocarcinoma | Male | <65 | III/IV | Chemotherapy | 5fluorouracil+oxaciplatina+l-folinian | SD |
| MREG | deletion | Frame_Shift_Del | c.420delN | p.Ala142LeufsTer6 | p.A142Lfs*6 | Q8N565 | protein_coding | TCGA-AA-3679-01 | Colorectum | colon adenocarcinoma | Male | <65 | III/IV | Chemotherapy | folinic | SD | |||
| MREG | SNV | Missense_Mutation | novel | c.98N>G | p.Asp33Gly | p.D33G | Q8N565 | protein_coding | tolerated(0.42) | benign(0) | TCGA-A5-A0G2-01 | Endometrium | uterine corpus endometrioid carcinoma | Female | <65 | III/IV | Unknown | Unknown | SD |
| MREG | SNV | Missense_Mutation | rs757448435 | c.196N>A | p.Asp66Asn | p.D66N | Q8N565 | protein_coding | deleterious(0.01) | probably_damaging(0.994) | TCGA-AP-A056-01 | Endometrium | uterine corpus endometrioid carcinoma | Female | <65 | I/II | Unknown | Unknown | SD |
| MREG | SNV | Missense_Mutation | rs543536857 | c.563N>A | p.Arg188Gln | p.R188Q | Q8N565 | protein_coding | tolerated(0.46) | benign(0) | TCGA-AP-A1DV-01 | Endometrium | uterine corpus endometrioid carcinoma | Female | <65 | I/II | Unknown | Unknown | SD |
| MREG | SNV | Missense_Mutation | novel | c.572C>A | p.Pro191His | p.P191H | Q8N565 | protein_coding | deleterious(0) | possibly_damaging(0.875) | TCGA-B5-A1MX-01 | Endometrium | uterine corpus endometrioid carcinoma | Female | <65 | I/II | Hormone Therapy | megace | SD |
| Page: 1 2 |
Top |
Related drugs of malignant transformation related genes |
| Identification of chemicals and drugs interact with genes involved in malignant transfromation |
| (DGIdb 4.0) |
| Entrez ID | Symbol | Category | Interaction Types | Drug Claim Name | Drug Name | PMIDs |
| Page: 1 |

Copyright 2023-Present -The University of Texas Health Science Center at Houston |