
|
|||||
|
 | |
| |
| |
| |
| |
| |
|
Gene: MRC2 |
Gene summary for MRC2 |
| Gene information | Species | Human | Gene symbol | MRC2 | Gene ID | 9902 |
| Gene name | mannose receptor C type 2 | |
| Gene Alias | CD280 | |
| Cytomap | 17q23.2 | |
| Gene Type | protein-coding | GO ID | GO:0001503 | UniProtAcc | Q9UBG0 |
Top |
Malignant transformation analysis |
| Identification of the aberrant gene expression in precancerous and cancerous lesions by comparing the gene expression of stem-like cells in diseased tissues with normal stem cells |
| Entrez ID | Symbol | Replicates | Species | Organ | Tissue | Adj P-value | Log2FC | Malignancy |
| 9902 | MRC2 | LZE4T | Human | Esophagus | ESCC | 2.19e-02 | -1.72e-01 | 0.0811 |
| 9902 | MRC2 | LZE24T | Human | Esophagus | ESCC | 1.07e-03 | -2.28e-01 | 0.0596 |
| 9902 | MRC2 | LZE6T | Human | Esophagus | ESCC | 1.34e-02 | 2.23e-02 | 0.0845 |
| 9902 | MRC2 | P2T-E | Human | Esophagus | ESCC | 3.51e-14 | 7.39e-02 | 0.1177 |
| 9902 | MRC2 | P4T-E | Human | Esophagus | ESCC | 1.97e-02 | 1.35e-01 | 0.1323 |
| 9902 | MRC2 | P8T-E | Human | Esophagus | ESCC | 3.00e-02 | -6.24e-02 | 0.0889 |
| 9902 | MRC2 | P11T-E | Human | Esophagus | ESCC | 3.29e-03 | 3.90e-01 | 0.1426 |
| 9902 | MRC2 | P12T-E | Human | Esophagus | ESCC | 5.58e-10 | -8.32e-02 | 0.1122 |
| 9902 | MRC2 | P16T-E | Human | Esophagus | ESCC | 1.26e-17 | 6.52e-02 | 0.1153 |
| 9902 | MRC2 | P17T-E | Human | Esophagus | ESCC | 3.48e-05 | 4.07e-02 | 0.1278 |
| 9902 | MRC2 | P20T-E | Human | Esophagus | ESCC | 2.76e-02 | -2.02e-02 | 0.1124 |
| 9902 | MRC2 | P21T-E | Human | Esophagus | ESCC | 2.02e-08 | 3.00e-02 | 0.1617 |
| 9902 | MRC2 | P22T-E | Human | Esophagus | ESCC | 6.53e-04 | 3.61e-02 | 0.1236 |
| 9902 | MRC2 | P23T-E | Human | Esophagus | ESCC | 9.88e-10 | 5.30e-01 | 0.108 |
| 9902 | MRC2 | P24T-E | Human | Esophagus | ESCC | 1.14e-02 | 1.01e-01 | 0.1287 |
| 9902 | MRC2 | P26T-E | Human | Esophagus | ESCC | 1.85e-07 | -1.19e-01 | 0.1276 |
| 9902 | MRC2 | P27T-E | Human | Esophagus | ESCC | 8.37e-13 | 2.46e-01 | 0.1055 |
| 9902 | MRC2 | P28T-E | Human | Esophagus | ESCC | 2.86e-13 | 1.56e-01 | 0.1149 |
| 9902 | MRC2 | P31T-E | Human | Esophagus | ESCC | 2.66e-13 | 8.28e-02 | 0.1251 |
| 9902 | MRC2 | P32T-E | Human | Esophagus | ESCC | 6.34e-11 | 1.46e-01 | 0.1666 |
| Page: 1 2 3 4 5 |
| Tissue | Expression Dynamics | Abbreviation |
| Esophagus | 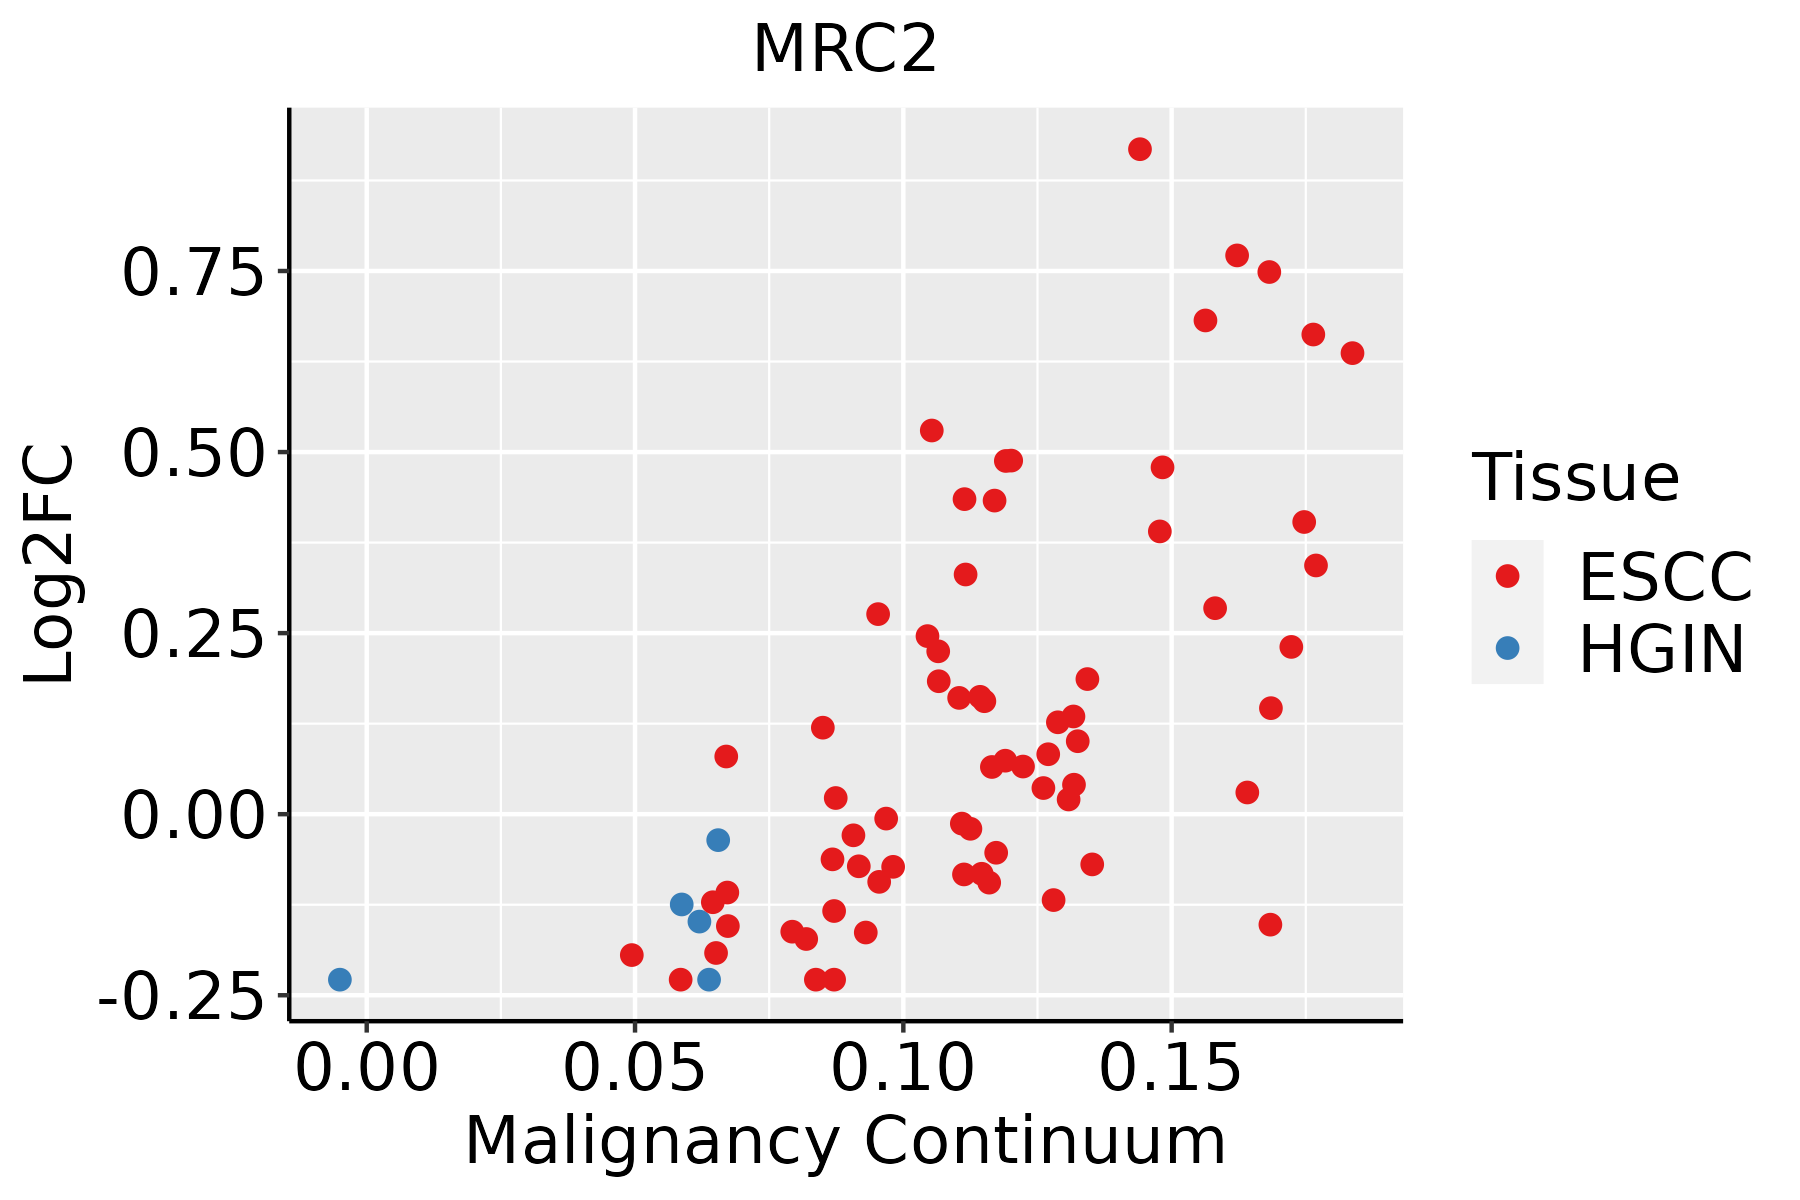 | ESCC: Esophageal squamous cell carcinoma |
| HGIN: High-grade intraepithelial neoplasias | ||
| LGIN: Low-grade intraepithelial neoplasias | ||
| Oral Cavity |  | EOLP: Erosive Oral lichen planus |
| LP: leukoplakia | ||
| NEOLP: Non-erosive oral lichen planus | ||
| OSCC: Oral squamous cell carcinoma | ||
| Prostate | 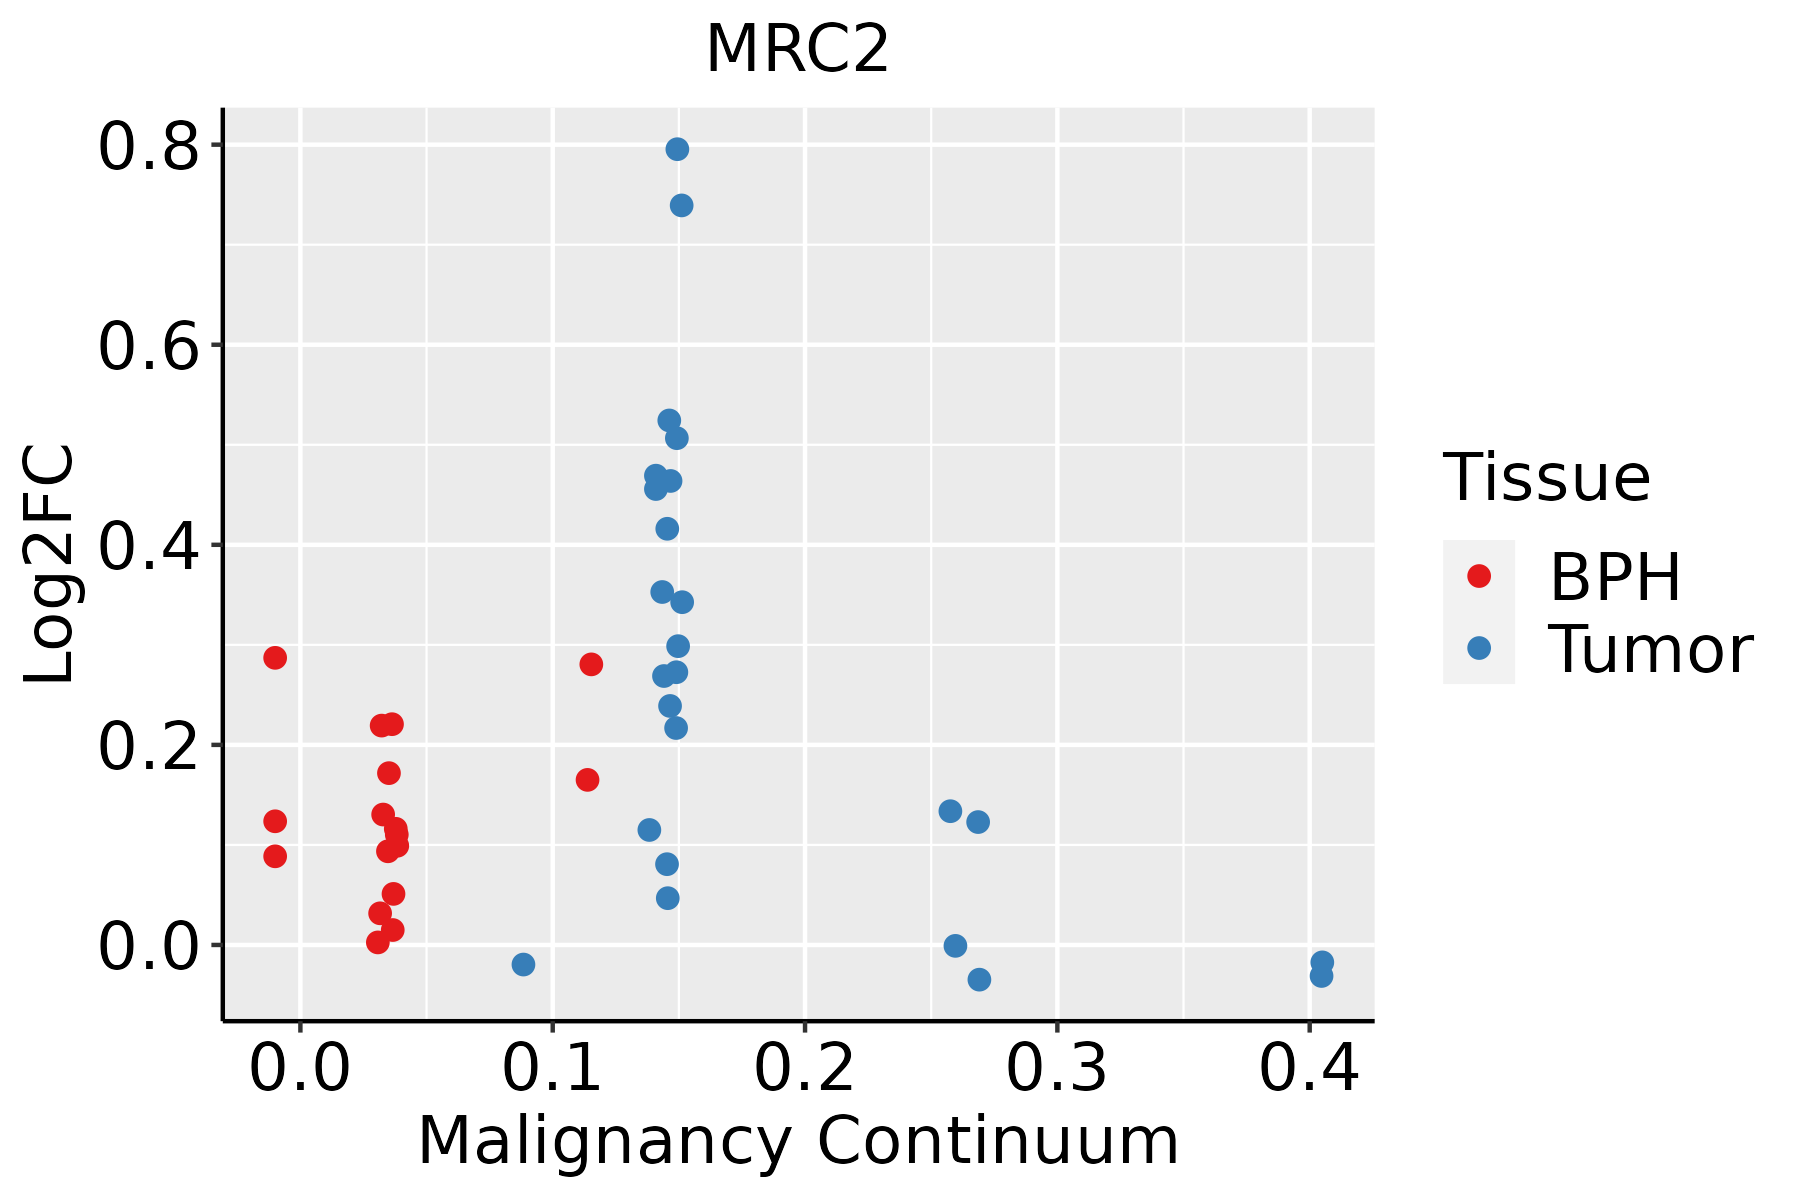 | BPH: Benign Prostatic Hyperplasia |
| Skin | 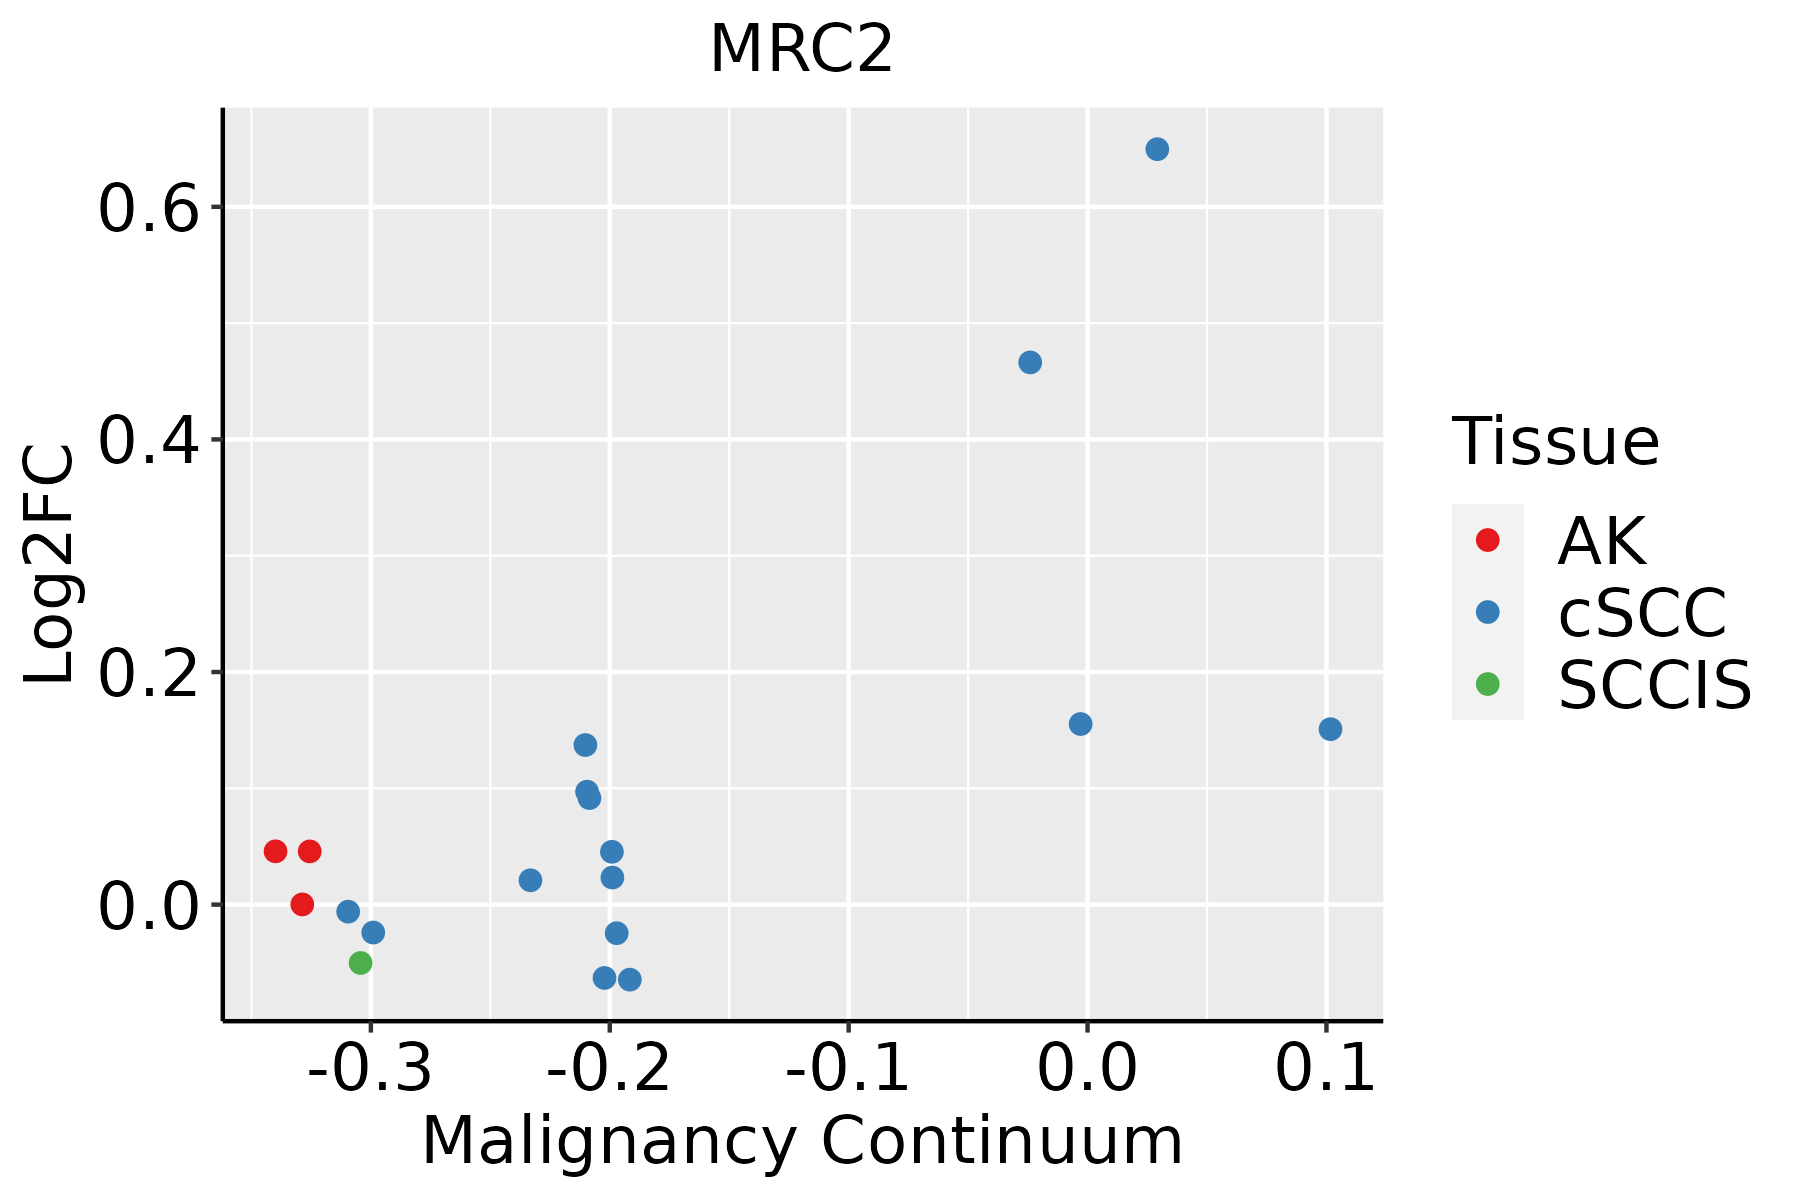 | AK: Actinic keratosis |
| cSCC: Cutaneous squamous cell carcinoma | ||
| SCCIS:squamous cell carcinoma in situ | ||
| Thyroid |  | ATC: Anaplastic thyroid cancer |
| HT: Hashimoto's thyroiditis | ||
| PTC: Papillary thyroid cancer |
| ∗log2FC in expression of this searched gene in stem-like cells from each diseased tissue sample relative to stem-like cells in normal samples in each tissue plotted against the malignancy continuum. Samples are colored based on if they are from different disease stage. |
Top |
Malignant transformation related pathway analysis |
| Find out the enriched GO biological processes and KEGG pathways involved in transition from healthy to precancer to cancer |
| Tissue | Disease Stage | Enriched GO biological Processes |
| Colorectum | AD |  |
| Colorectum | SER |  |
| Colorectum | MSS |  |
| Colorectum | MSI-H |  |
| Colorectum | FAP |  |
| ∗Top 15 enriched GO BP terms are showed in the bar plot of each disease state in each tissue. Each row represents a significant GO biological process which is colored according to the -log10(p.adjust). |
| Page: 1 2 3 4 5 6 7 8 9 |
| GO ID | Tissue | Disease Stage | Description | Gene Ratio | Bg Ratio | pvalue | p.adjust | Count |
| GO:000164918 | Esophagus | ESCC | osteoblast differentiation | 140/8552 | 229/18723 | 1.63e-06 | 1.95e-05 | 140 |
| GO:000150317 | Esophagus | ESCC | ossification | 232/8552 | 408/18723 | 3.00e-06 | 3.40e-05 | 232 |
| GO:00329631 | Esophagus | ESCC | collagen metabolic process | 62/8552 | 104/18723 | 2.90e-03 | 1.22e-02 | 62 |
| GO:000150310 | Oral cavity | OSCC | ossification | 203/7305 | 408/18723 | 5.54e-06 | 6.19e-05 | 203 |
| GO:000164910 | Oral cavity | OSCC | osteoblast differentiation | 118/7305 | 229/18723 | 7.51e-05 | 5.85e-04 | 118 |
| GO:0032963 | Oral cavity | OSCC | collagen metabolic process | 54/7305 | 104/18723 | 5.00e-03 | 1.96e-02 | 54 |
| GO:000150315 | Oral cavity | LP | ossification | 123/4623 | 408/18723 | 6.55e-03 | 3.84e-02 | 123 |
| GO:000164916 | Oral cavity | LP | osteoblast differentiation | 73/4623 | 229/18723 | 8.09e-03 | 4.40e-02 | 73 |
| GO:00016499 | Prostate | BPH | osteoblast differentiation | 75/3107 | 229/18723 | 1.29e-09 | 5.57e-08 | 75 |
| GO:00015039 | Prostate | BPH | ossification | 107/3107 | 408/18723 | 4.31e-07 | 8.83e-06 | 107 |
| GO:000164915 | Prostate | Tumor | osteoblast differentiation | 77/3246 | 229/18723 | 1.55e-09 | 7.26e-08 | 77 |
| GO:000150314 | Prostate | Tumor | ossification | 109/3246 | 408/18723 | 1.13e-06 | 2.14e-05 | 109 |
| GO:000164923 | Skin | cSCC | osteoblast differentiation | 89/4864 | 229/18723 | 1.18e-05 | 1.51e-04 | 89 |
| GO:000150323 | Skin | cSCC | ossification | 137/4864 | 408/18723 | 3.39e-04 | 2.68e-03 | 137 |
| GO:0001503110 | Thyroid | PTC | ossification | 176/5968 | 408/18723 | 9.26e-07 | 1.40e-05 | 176 |
| GO:0001649111 | Thyroid | PTC | osteoblast differentiation | 102/5968 | 229/18723 | 3.66e-05 | 3.40e-04 | 102 |
| GO:000150332 | Thyroid | ATC | ossification | 206/6293 | 408/18723 | 9.23e-13 | 3.95e-11 | 206 |
| GO:000164932 | Thyroid | ATC | osteoblast differentiation | 122/6293 | 229/18723 | 6.04e-10 | 1.60e-08 | 122 |
| GO:00329633 | Thyroid | ATC | collagen metabolic process | 52/6293 | 104/18723 | 3.94e-04 | 2.38e-03 | 52 |
| Page: 1 |
| Pathway ID | Tissue | Disease Stage | Description | Gene Ratio | Bg Ratio | pvalue | p.adjust | qvalue | Count |
| hsa0414530 | Esophagus | ESCC | Phagosome | 100/4205 | 152/8465 | 3.81e-05 | 1.72e-04 | 8.82e-05 | 100 |
| hsa051527 | Esophagus | ESCC | Tuberculosis | 111/4205 | 180/8465 | 7.14e-04 | 2.32e-03 | 1.19e-03 | 111 |
| hsa04145114 | Esophagus | ESCC | Phagosome | 100/4205 | 152/8465 | 3.81e-05 | 1.72e-04 | 8.82e-05 | 100 |
| hsa0515212 | Esophagus | ESCC | Tuberculosis | 111/4205 | 180/8465 | 7.14e-04 | 2.32e-03 | 1.19e-03 | 111 |
| hsa051526 | Oral cavity | OSCC | Tuberculosis | 105/3704 | 180/8465 | 5.00e-05 | 2.04e-04 | 1.04e-04 | 105 |
| hsa0414528 | Oral cavity | OSCC | Phagosome | 88/3704 | 152/8465 | 2.83e-04 | 9.13e-04 | 4.65e-04 | 88 |
| hsa0515211 | Oral cavity | OSCC | Tuberculosis | 105/3704 | 180/8465 | 5.00e-05 | 2.04e-04 | 1.04e-04 | 105 |
| hsa04145113 | Oral cavity | OSCC | Phagosome | 88/3704 | 152/8465 | 2.83e-04 | 9.13e-04 | 4.65e-04 | 88 |
| hsa0414529 | Oral cavity | LP | Phagosome | 73/2418 | 152/8465 | 2.37e-07 | 3.29e-06 | 2.12e-06 | 73 |
| hsa0515221 | Oral cavity | LP | Tuberculosis | 65/2418 | 180/8465 | 1.60e-02 | 4.92e-02 | 3.17e-02 | 65 |
| hsa0414536 | Oral cavity | LP | Phagosome | 73/2418 | 152/8465 | 2.37e-07 | 3.29e-06 | 2.12e-06 | 73 |
| hsa0515231 | Oral cavity | LP | Tuberculosis | 65/2418 | 180/8465 | 1.60e-02 | 4.92e-02 | 3.17e-02 | 65 |
| hsa0414526 | Prostate | BPH | Phagosome | 50/1718 | 152/8465 | 1.62e-04 | 9.40e-04 | 5.82e-04 | 50 |
| hsa04145112 | Prostate | BPH | Phagosome | 50/1718 | 152/8465 | 1.62e-04 | 9.40e-04 | 5.82e-04 | 50 |
| hsa0414527 | Prostate | Tumor | Phagosome | 52/1791 | 152/8465 | 1.19e-04 | 7.42e-04 | 4.60e-04 | 52 |
| hsa0414535 | Prostate | Tumor | Phagosome | 52/1791 | 152/8465 | 1.19e-04 | 7.42e-04 | 4.60e-04 | 52 |
| Page: 1 |
Top |
Cell-cell communication analysis |
| Identification of potential cell-cell interactions between two cell types and their ligand-receptor pairs for different disease states |
| Ligand | Receptor | LRpair | Pathway | Tissue | Disease Stage |
| Page: 1 |
Top |
Single-cell gene regulatory network inference analysis |
| Find out the significant the regulons (TFs) and the target genes of each regulon across cell types for different disease states |
| TF | Cell Type | Tissue | Disease Stage | Target Gene | RSS | Regulon Activity |
| ∗The dot plots of a searched regulon are shown for all cell subpopulations in each disease state of each tissue based on the regulon specific score inferred using pySCENIC and by calculating the average expression. |
| Page: 1 |
Top |
Somatic mutation of malignant transformation related genes |
| Annotation of somatic variants for genes involved in malignant transformation |
| Hugo Symbol | Variant Class | Variant Classification | dbSNP RS | HGVSc | HGVSp | HGVSp Short | SWISSPROT | BIOTYPE | SIFT | PolyPhen | Tumor Sample Barcode | Tissue | Histology | Sex | Age | Stage | Therapy Types | Drugs | Outcome |
| MRC2 | SNV | Missense_Mutation | c.3122N>T | p.Ser1041Leu | p.S1041L | Q9UBG0 | protein_coding | tolerated(0.13) | benign(0.356) | TCGA-5L-AAT1-01 | Breast | breast invasive carcinoma | Female | <65 | III/IV | Hormone Therapy | letrozol | SD | |
| MRC2 | SNV | Missense_Mutation | c.4147N>T | p.Ala1383Ser | p.A1383S | Q9UBG0 | protein_coding | tolerated(1) | benign(0.015) | TCGA-A2-A04P-01 | Breast | breast invasive carcinoma | Female | <65 | III/IV | Chemotherapy | taxol | PD | |
| MRC2 | SNV | Missense_Mutation | c.4037N>G | p.Asn1346Ser | p.N1346S | Q9UBG0 | protein_coding | tolerated(0.33) | possibly_damaging(0.696) | TCGA-A2-A1FW-01 | Breast | breast invasive carcinoma | Female | <65 | III/IV | Chemotherapy | cytoxan | SD | |
| MRC2 | SNV | Missense_Mutation | c.1276N>G | p.Leu426Val | p.L426V | Q9UBG0 | protein_coding | tolerated(0.17) | possibly_damaging(0.778) | TCGA-A8-A07R-01 | Breast | breast invasive carcinoma | Female | >=65 | III/IV | Ancillary | zoledronic | SD | |
| MRC2 | SNV | Missense_Mutation | c.480C>G | p.Ile160Met | p.I160M | Q9UBG0 | protein_coding | tolerated(0.11) | possibly_damaging(0.46) | TCGA-A8-A081-01 | Breast | breast invasive carcinoma | Female | >=65 | I/II | Unknown | Unknown | SD | |
| MRC2 | SNV | Missense_Mutation | c.4435N>C | p.Glu1479Gln | p.E1479Q | Q9UBG0 | protein_coding | deleterious(0.02) | benign(0.283) | TCGA-AC-A23H-01 | Breast | breast invasive carcinoma | Female | >=65 | I/II | Unknown | Unknown | PD | |
| MRC2 | SNV | Missense_Mutation | novel | c.3902N>T | p.Ala1301Val | p.A1301V | Q9UBG0 | protein_coding | tolerated(0.25) | benign(0.09) | TCGA-BH-A18G-01 | Breast | breast invasive carcinoma | Female | >=65 | I/II | Unknown | Unknown | SD |
| MRC2 | SNV | Missense_Mutation | c.3460N>A | p.Glu1154Lys | p.E1154K | Q9UBG0 | protein_coding | tolerated(0.05) | probably_damaging(0.999) | TCGA-D8-A1JA-01 | Breast | breast invasive carcinoma | Female | <65 | III/IV | Chemotherapy | adriamycin | PD | |
| MRC2 | insertion | Nonsense_Mutation | novel | c.450_451insAGTTCAGGGGTGGGATGAGTGGTCTGGGAAGATCCTAGAAGAAG | p.Asp151SerfsTer6 | p.D151Sfs*6 | Q9UBG0 | protein_coding | TCGA-A7-A0CJ-01 | Breast | breast invasive carcinoma | Female | <65 | I/II | Chemotherapy | cytoxan | SD | ||
| MRC2 | insertion | Frame_Shift_Ins | novel | c.247_248insTTCAGAAAAGTAT | p.Asn83IlefsTer33 | p.N83Ifs*33 | Q9UBG0 | protein_coding | TCGA-AO-A0J9-01 | Breast | breast invasive carcinoma | Female | <65 | III/IV | Chemotherapy | cyclophosphamide | PD |
| Page: 1 2 3 4 5 6 7 8 9 10 11 12 13 14 |
Top |
Related drugs of malignant transformation related genes |
| Identification of chemicals and drugs interact with genes involved in malignant transfromation |
| (DGIdb 4.0) |
| Entrez ID | Symbol | Category | Interaction Types | Drug Claim Name | Drug Name | PMIDs |
| Page: 1 |

Copyright 2023-Present -The University of Texas Health Science Center at Houston |