
|
|||||
|
 | |
| |
| |
| |
| |
| |
|
Gene: MPZL2 |
Gene summary for MPZL2 |
| Gene information | Species | Human | Gene symbol | MPZL2 | Gene ID | 10205 |
| Gene name | myelin protein zero like 2 | |
| Gene Alias | DFNB111 | |
| Cytomap | 11q23.3 | |
| Gene Type | protein-coding | GO ID | GO:0007155 | UniProtAcc | A0A024R3K1 |
Top |
Malignant transformation analysis |
| Identification of the aberrant gene expression in precancerous and cancerous lesions by comparing the gene expression of stem-like cells in diseased tissues with normal stem cells |
| Entrez ID | Symbol | Replicates | Species | Organ | Tissue | Adj P-value | Log2FC | Malignancy |
| 10205 | MPZL2 | CA_HPV_1 | Human | Cervix | CC | 1.18e-14 | -4.01e-01 | 0.0264 |
| 10205 | MPZL2 | CA_HPV_3 | Human | Cervix | CC | 1.05e-07 | 2.51e-01 | 0.0414 |
| 10205 | MPZL2 | CCII_1 | Human | Cervix | CC | 1.15e-02 | -3.63e-01 | 0.3249 |
| 10205 | MPZL2 | Tumor | Human | Cervix | CC | 9.26e-29 | 6.81e-01 | 0.1241 |
| 10205 | MPZL2 | sample3 | Human | Cervix | CC | 1.29e-42 | 7.46e-01 | 0.1387 |
| 10205 | MPZL2 | T3 | Human | Cervix | CC | 1.13e-37 | 7.41e-01 | 0.1389 |
| 10205 | MPZL2 | LZE4T | Human | Esophagus | ESCC | 2.52e-12 | 5.98e-01 | 0.0811 |
| 10205 | MPZL2 | LZE7T | Human | Esophagus | ESCC | 1.40e-02 | -2.59e-01 | 0.0667 |
| 10205 | MPZL2 | LZE8T | Human | Esophagus | ESCC | 2.98e-05 | 2.07e-01 | 0.067 |
| 10205 | MPZL2 | LZE20T | Human | Esophagus | ESCC | 8.70e-11 | 7.17e-01 | 0.0662 |
| 10205 | MPZL2 | LZE24T | Human | Esophagus | ESCC | 9.10e-17 | 9.16e-01 | 0.0596 |
| 10205 | MPZL2 | LZE21T | Human | Esophagus | ESCC | 2.86e-04 | 7.33e-02 | 0.0655 |
| 10205 | MPZL2 | P2T-E | Human | Esophagus | ESCC | 2.01e-24 | -9.21e-02 | 0.1177 |
| 10205 | MPZL2 | P4T-E | Human | Esophagus | ESCC | 1.02e-38 | 1.37e+00 | 0.1323 |
| 10205 | MPZL2 | P5T-E | Human | Esophagus | ESCC | 1.67e-09 | 3.27e-01 | 0.1327 |
| 10205 | MPZL2 | P8T-E | Human | Esophagus | ESCC | 1.17e-09 | 4.51e-01 | 0.0889 |
| 10205 | MPZL2 | P9T-E | Human | Esophagus | ESCC | 4.57e-06 | 1.96e-01 | 0.1131 |
| 10205 | MPZL2 | P10T-E | Human | Esophagus | ESCC | 3.83e-21 | 3.29e-01 | 0.116 |
| 10205 | MPZL2 | P11T-E | Human | Esophagus | ESCC | 4.40e-04 | 6.15e-01 | 0.1426 |
| 10205 | MPZL2 | P12T-E | Human | Esophagus | ESCC | 4.73e-12 | 4.96e-01 | 0.1122 |
| Page: 1 2 3 4 5 6 7 |
| Tissue | Expression Dynamics | Abbreviation |
| Cervix | 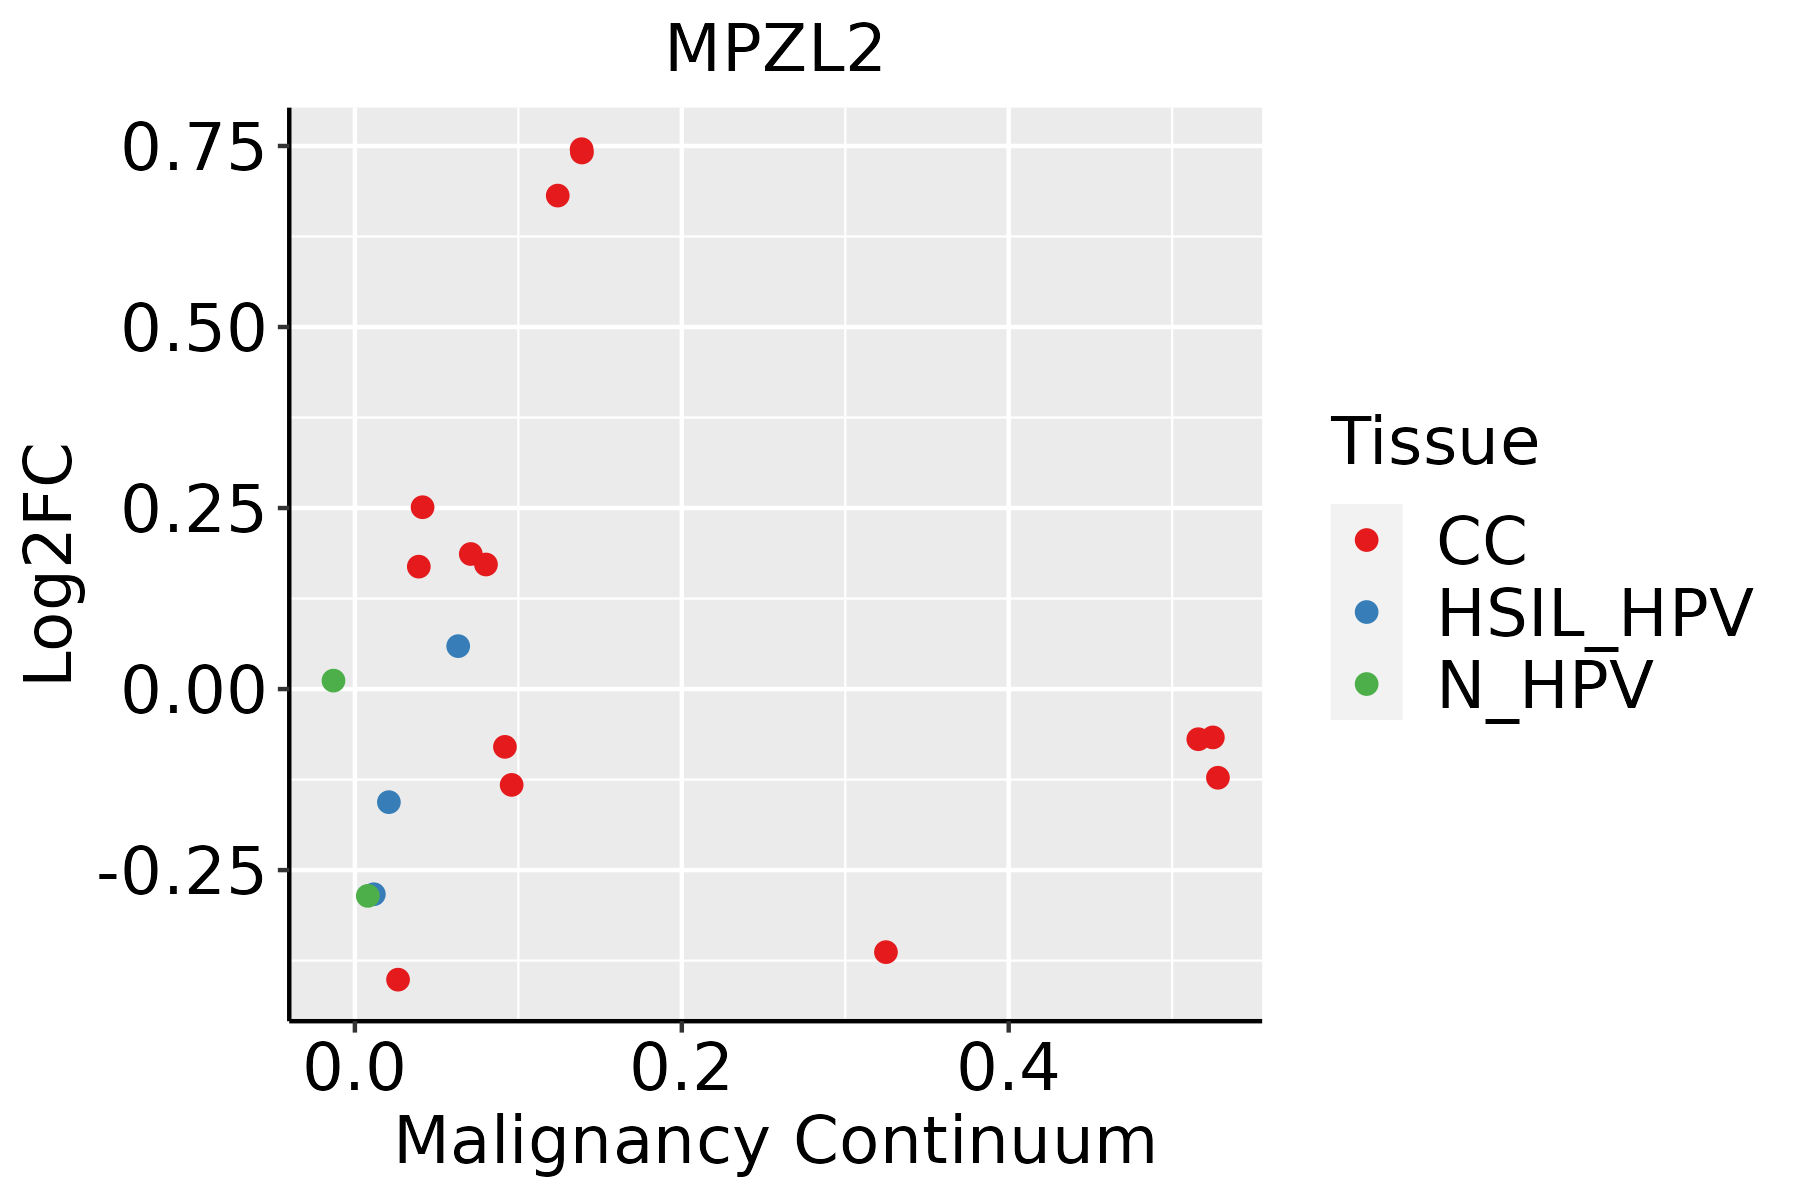 | CC: Cervix cancer |
| HSIL_HPV: HPV-infected high-grade squamous intraepithelial lesions | ||
| N_HPV: HPV-infected normal cervix | ||
| Esophagus | 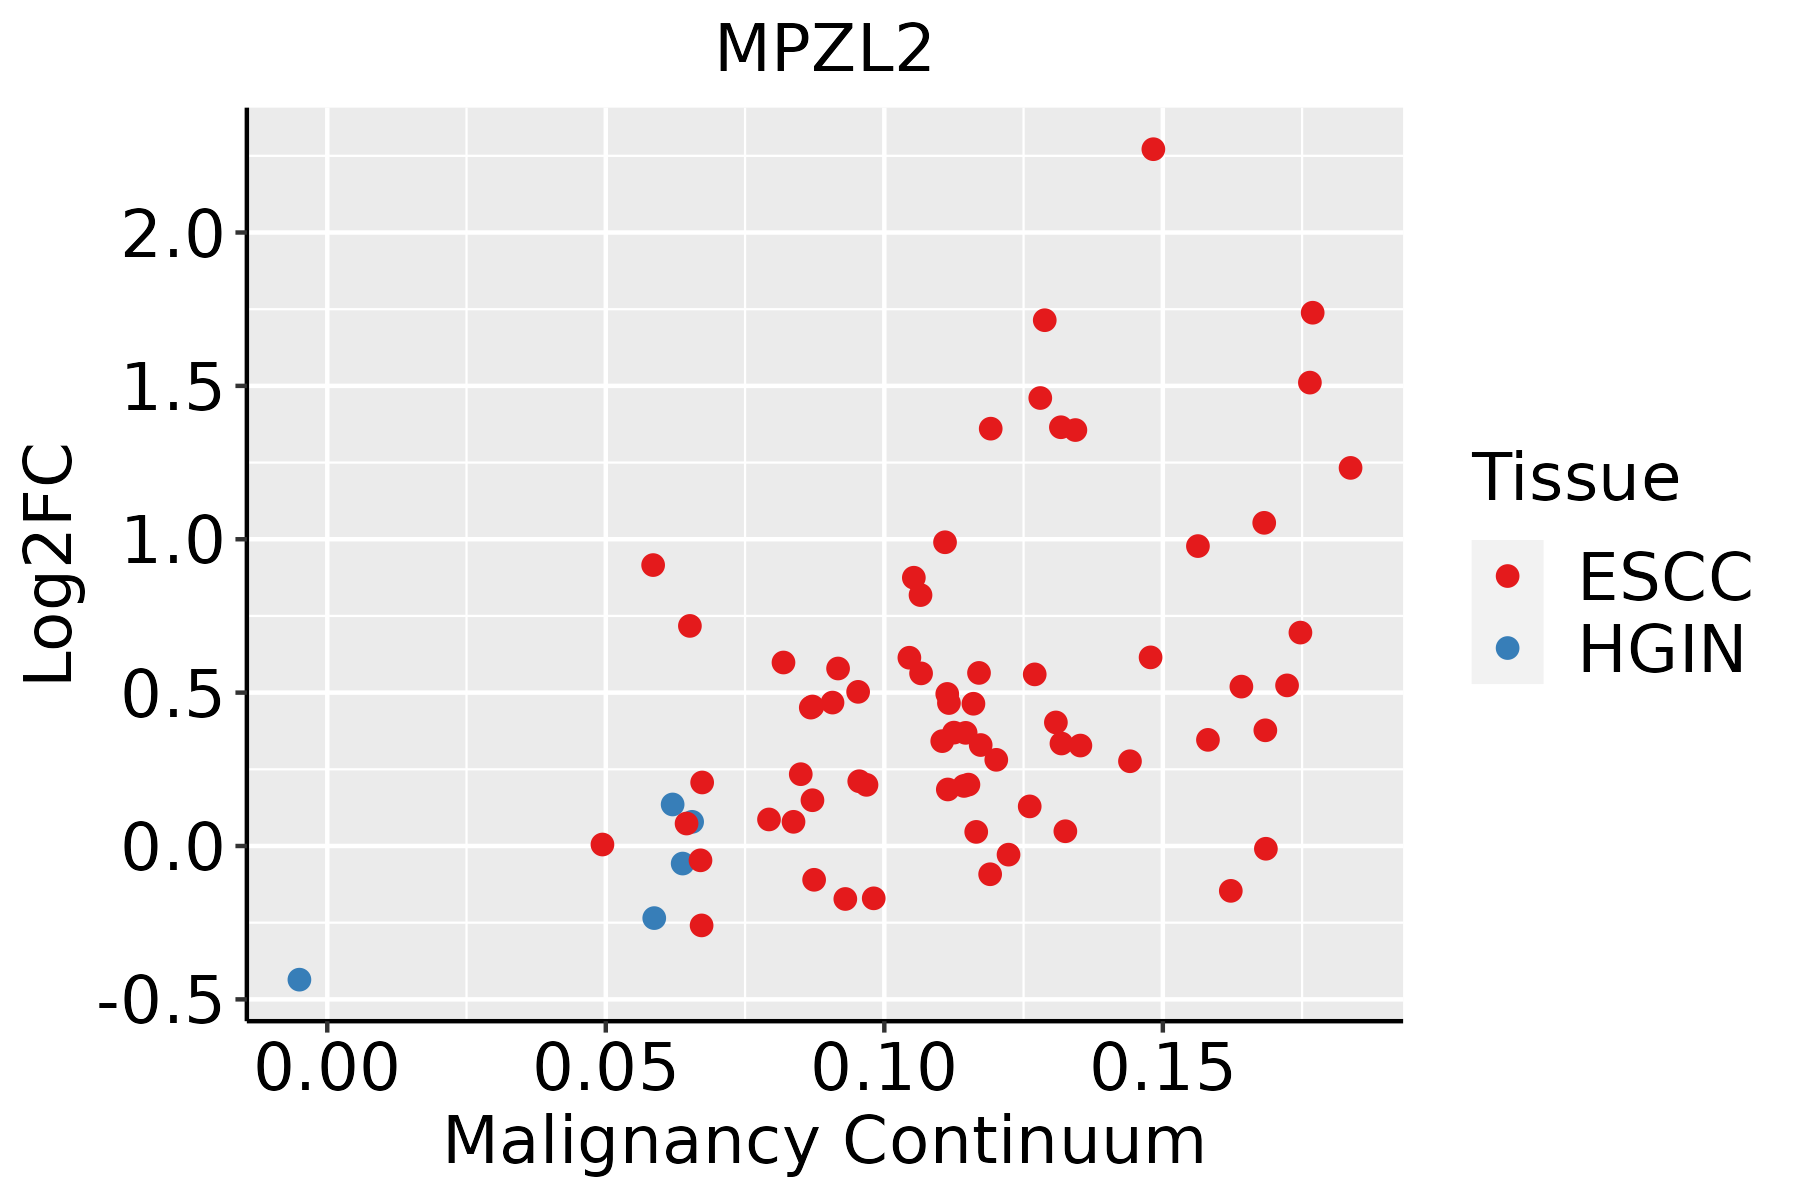 | ESCC: Esophageal squamous cell carcinoma |
| HGIN: High-grade intraepithelial neoplasias | ||
| LGIN: Low-grade intraepithelial neoplasias | ||
| Liver | 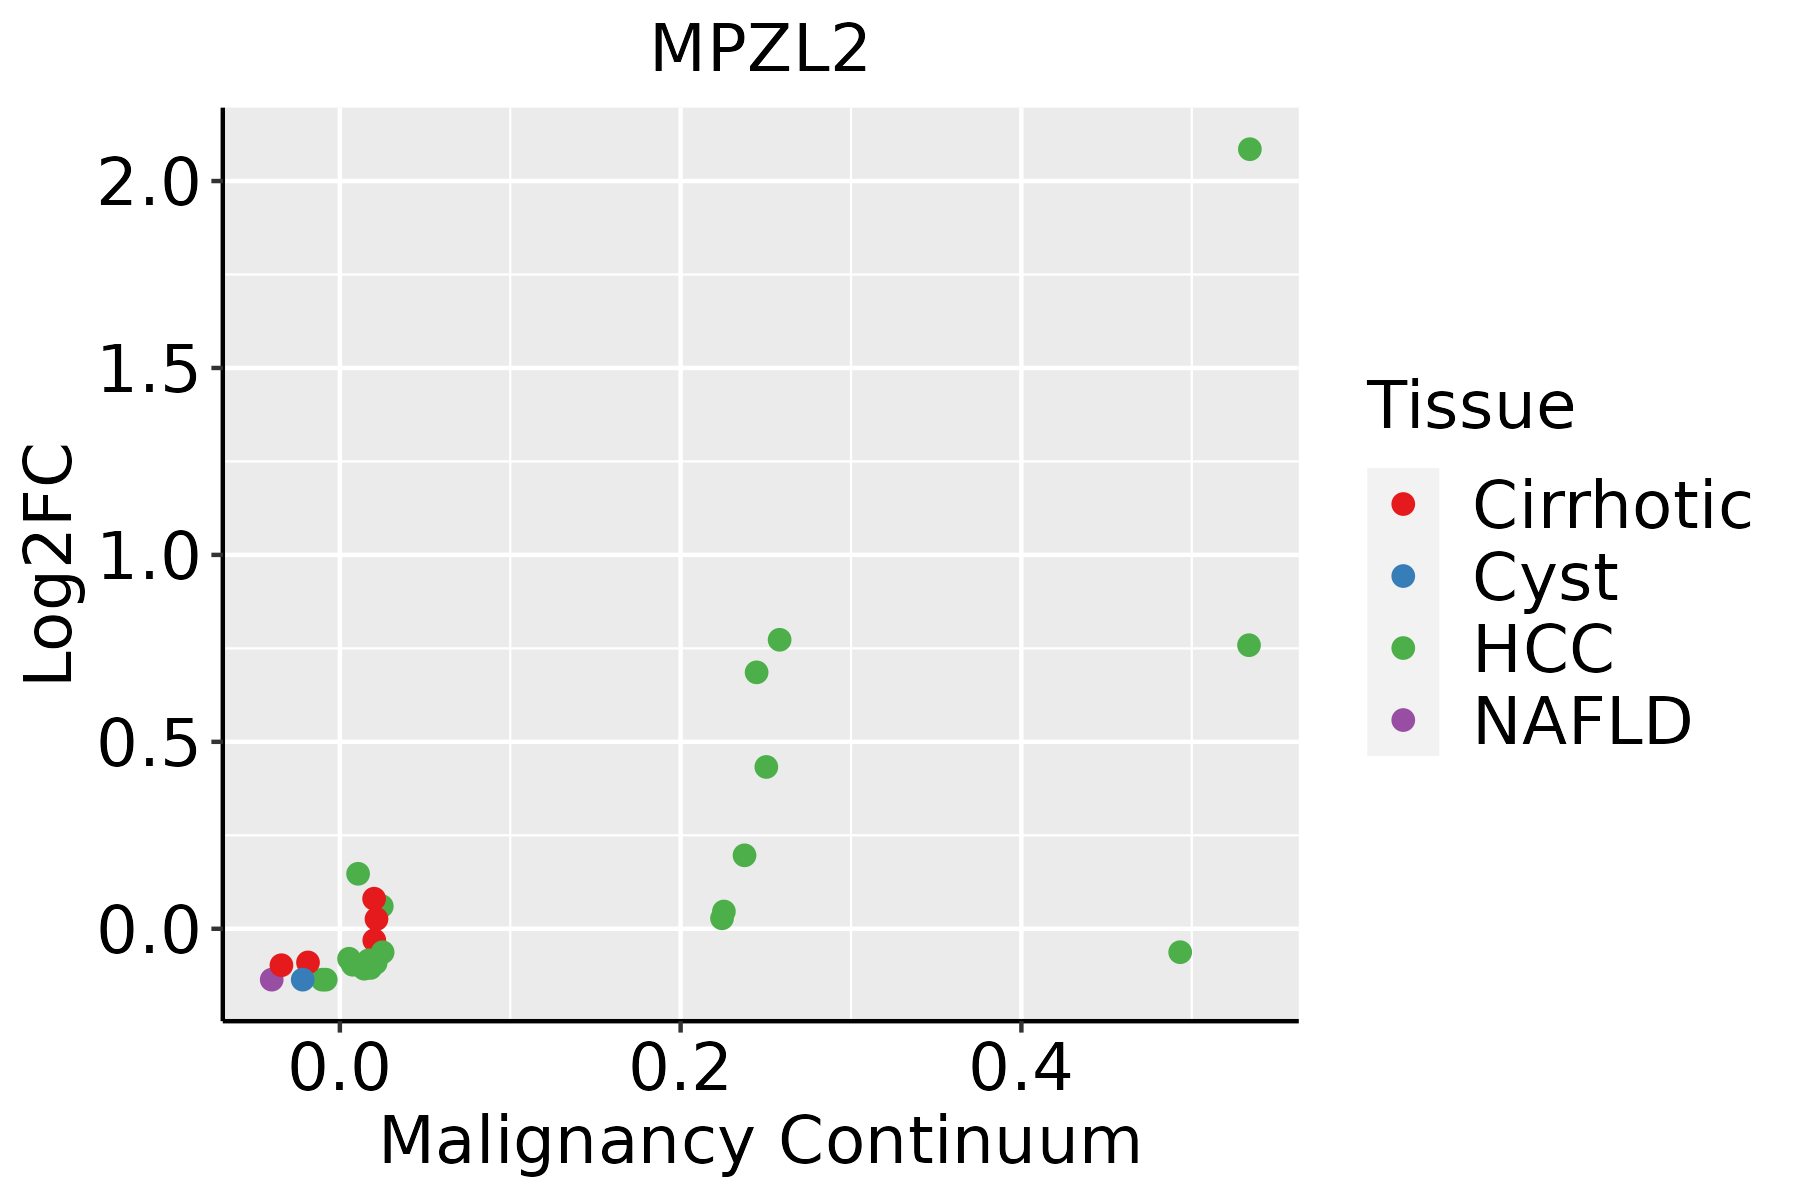 | HCC: Hepatocellular carcinoma |
| NAFLD: Non-alcoholic fatty liver disease | ||
| Oral Cavity | 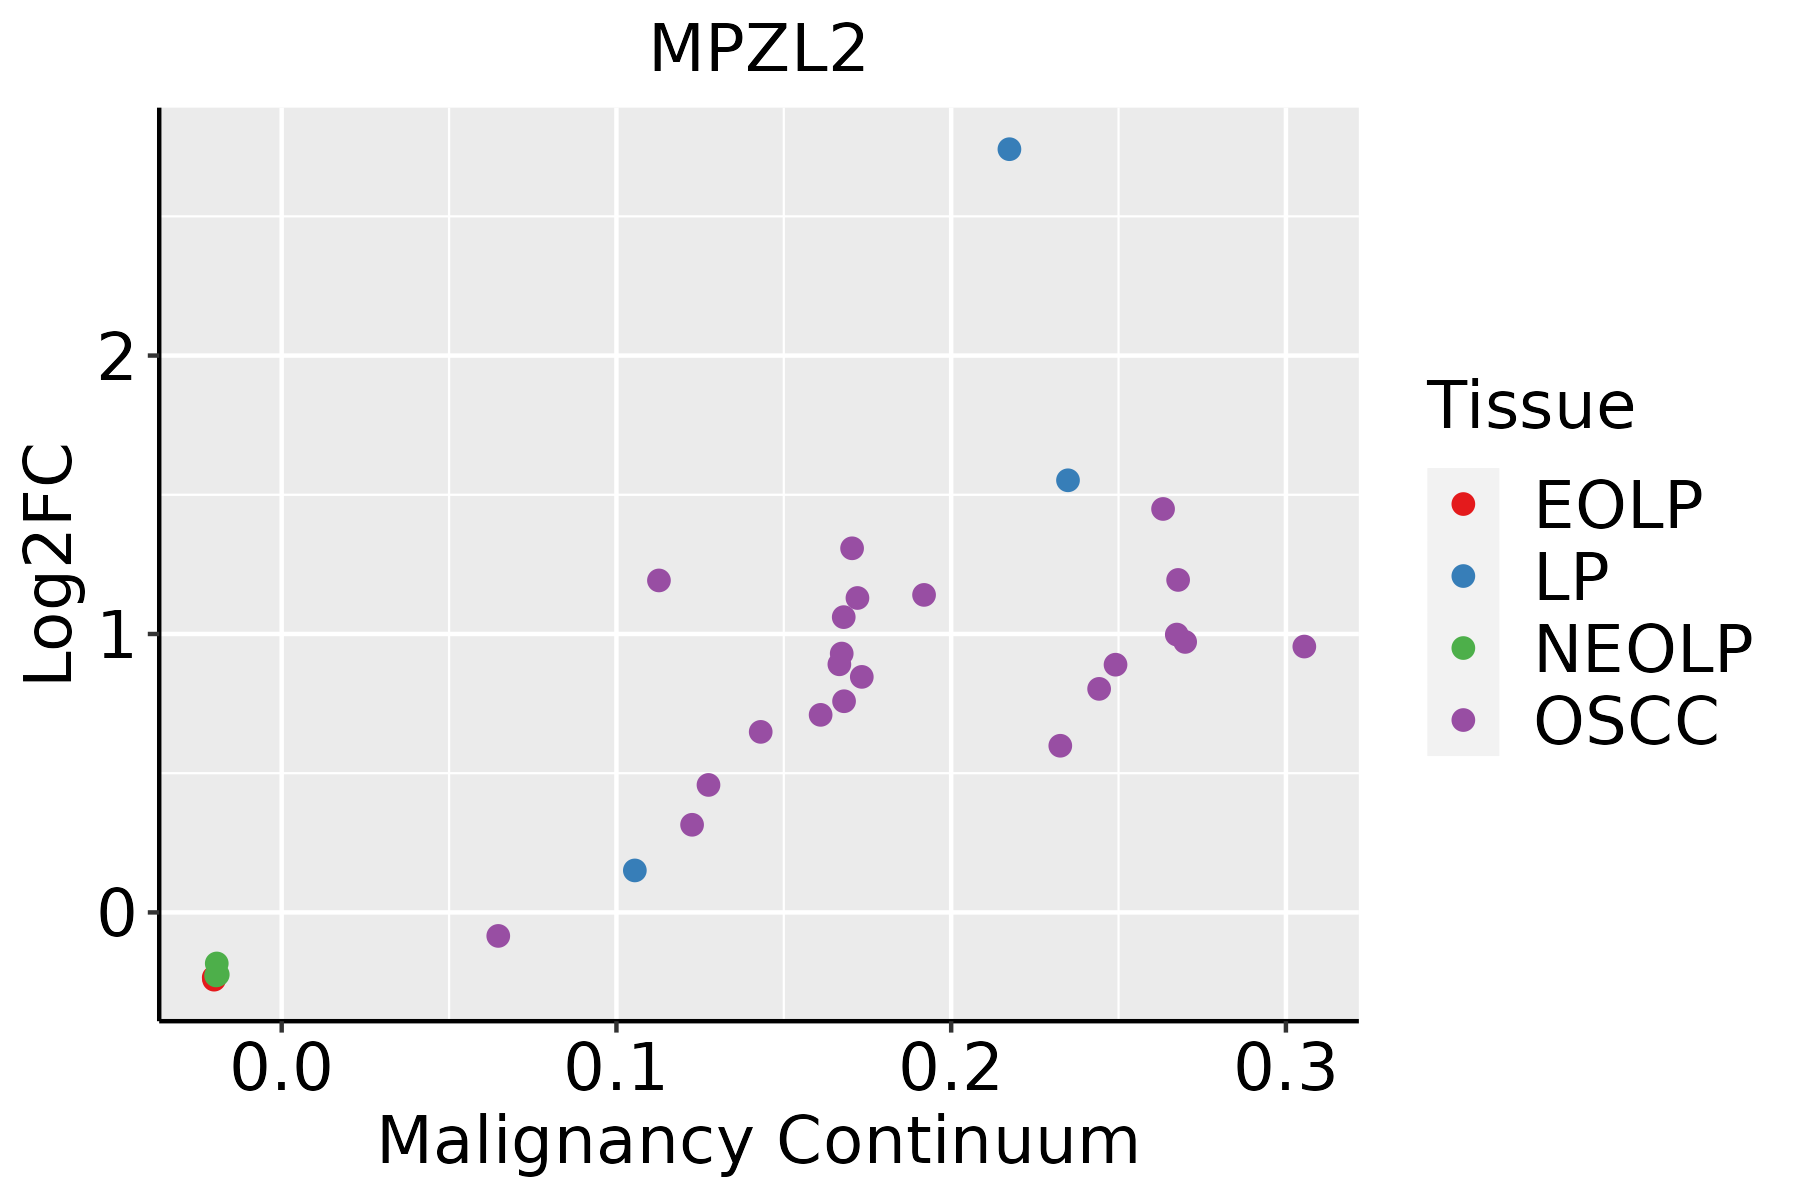 | EOLP: Erosive Oral lichen planus |
| LP: leukoplakia | ||
| NEOLP: Non-erosive oral lichen planus | ||
| OSCC: Oral squamous cell carcinoma | ||
| Prostate | 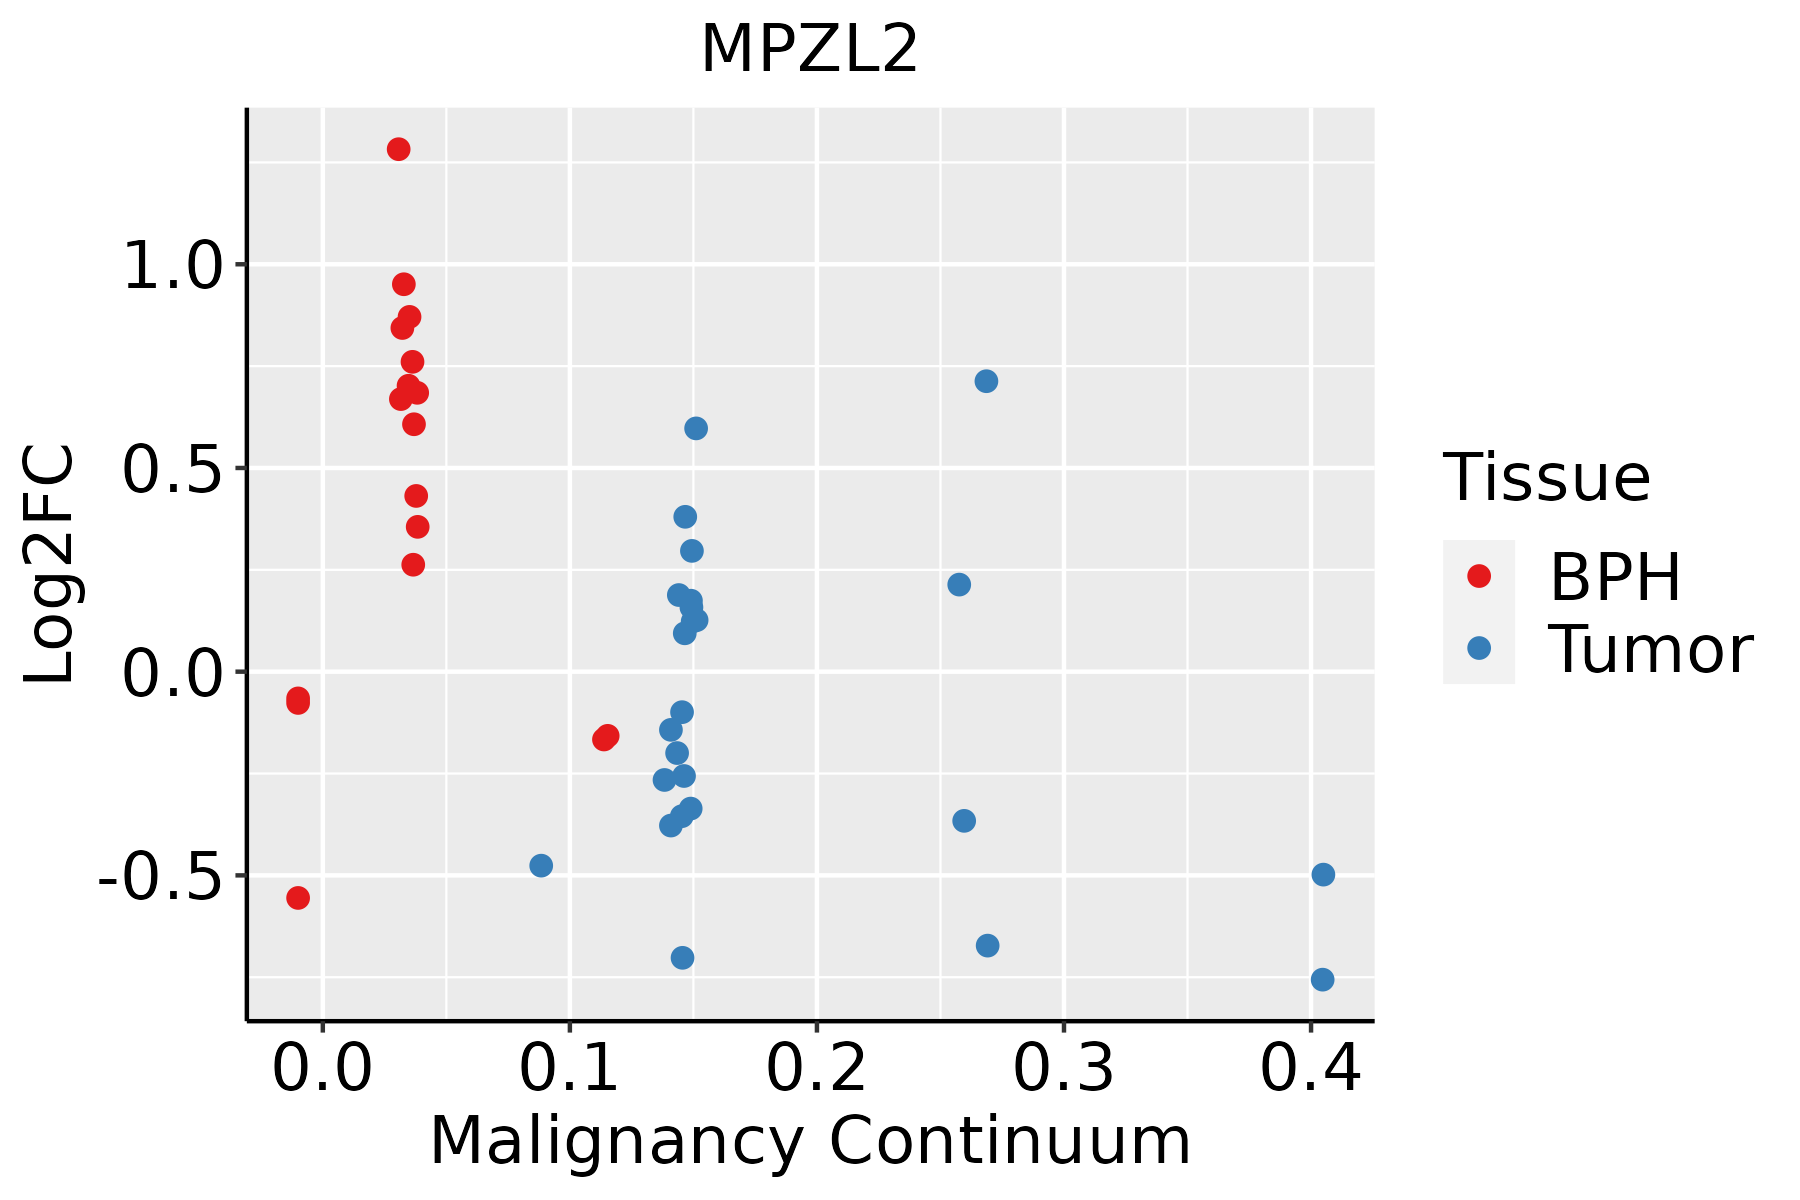 | BPH: Benign Prostatic Hyperplasia |
| Skin | 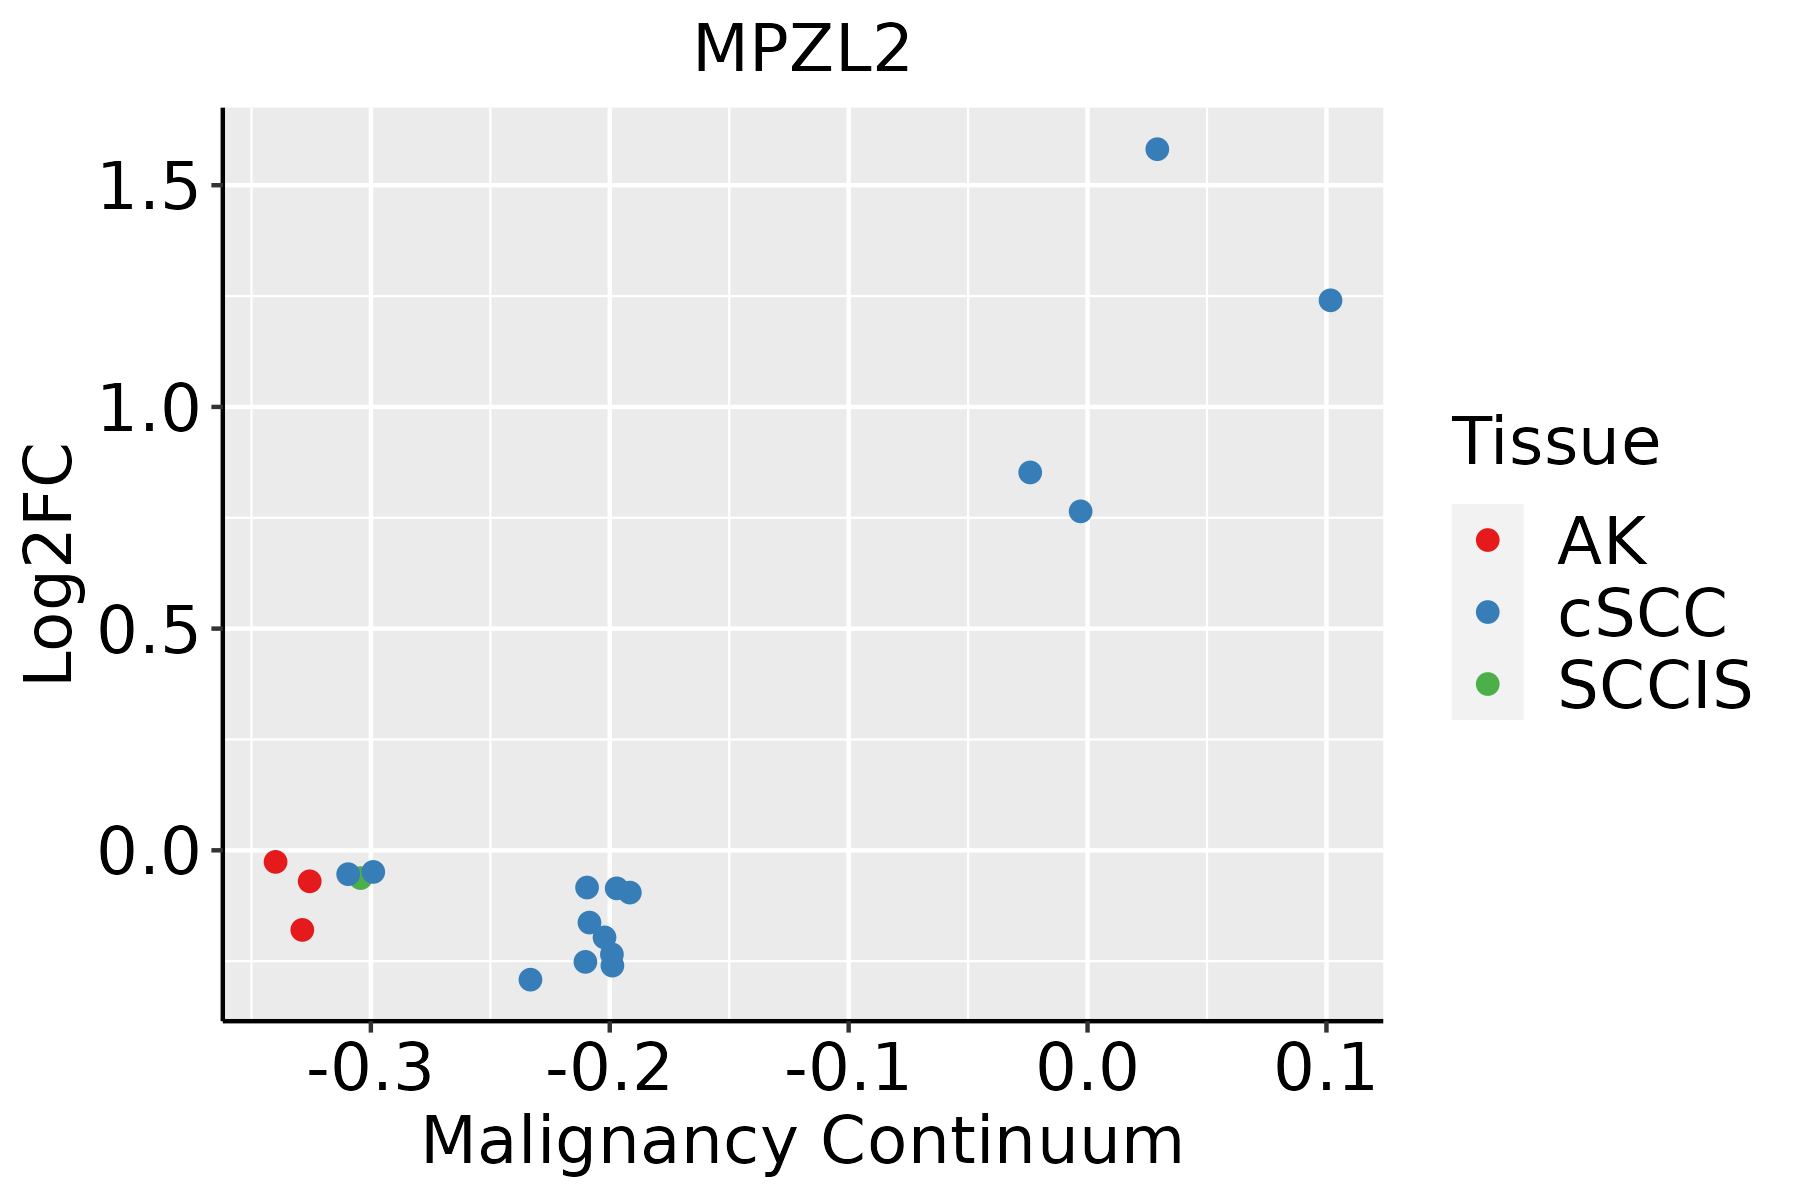 | AK: Actinic keratosis |
| cSCC: Cutaneous squamous cell carcinoma | ||
| SCCIS:squamous cell carcinoma in situ | ||
| Thyroid | 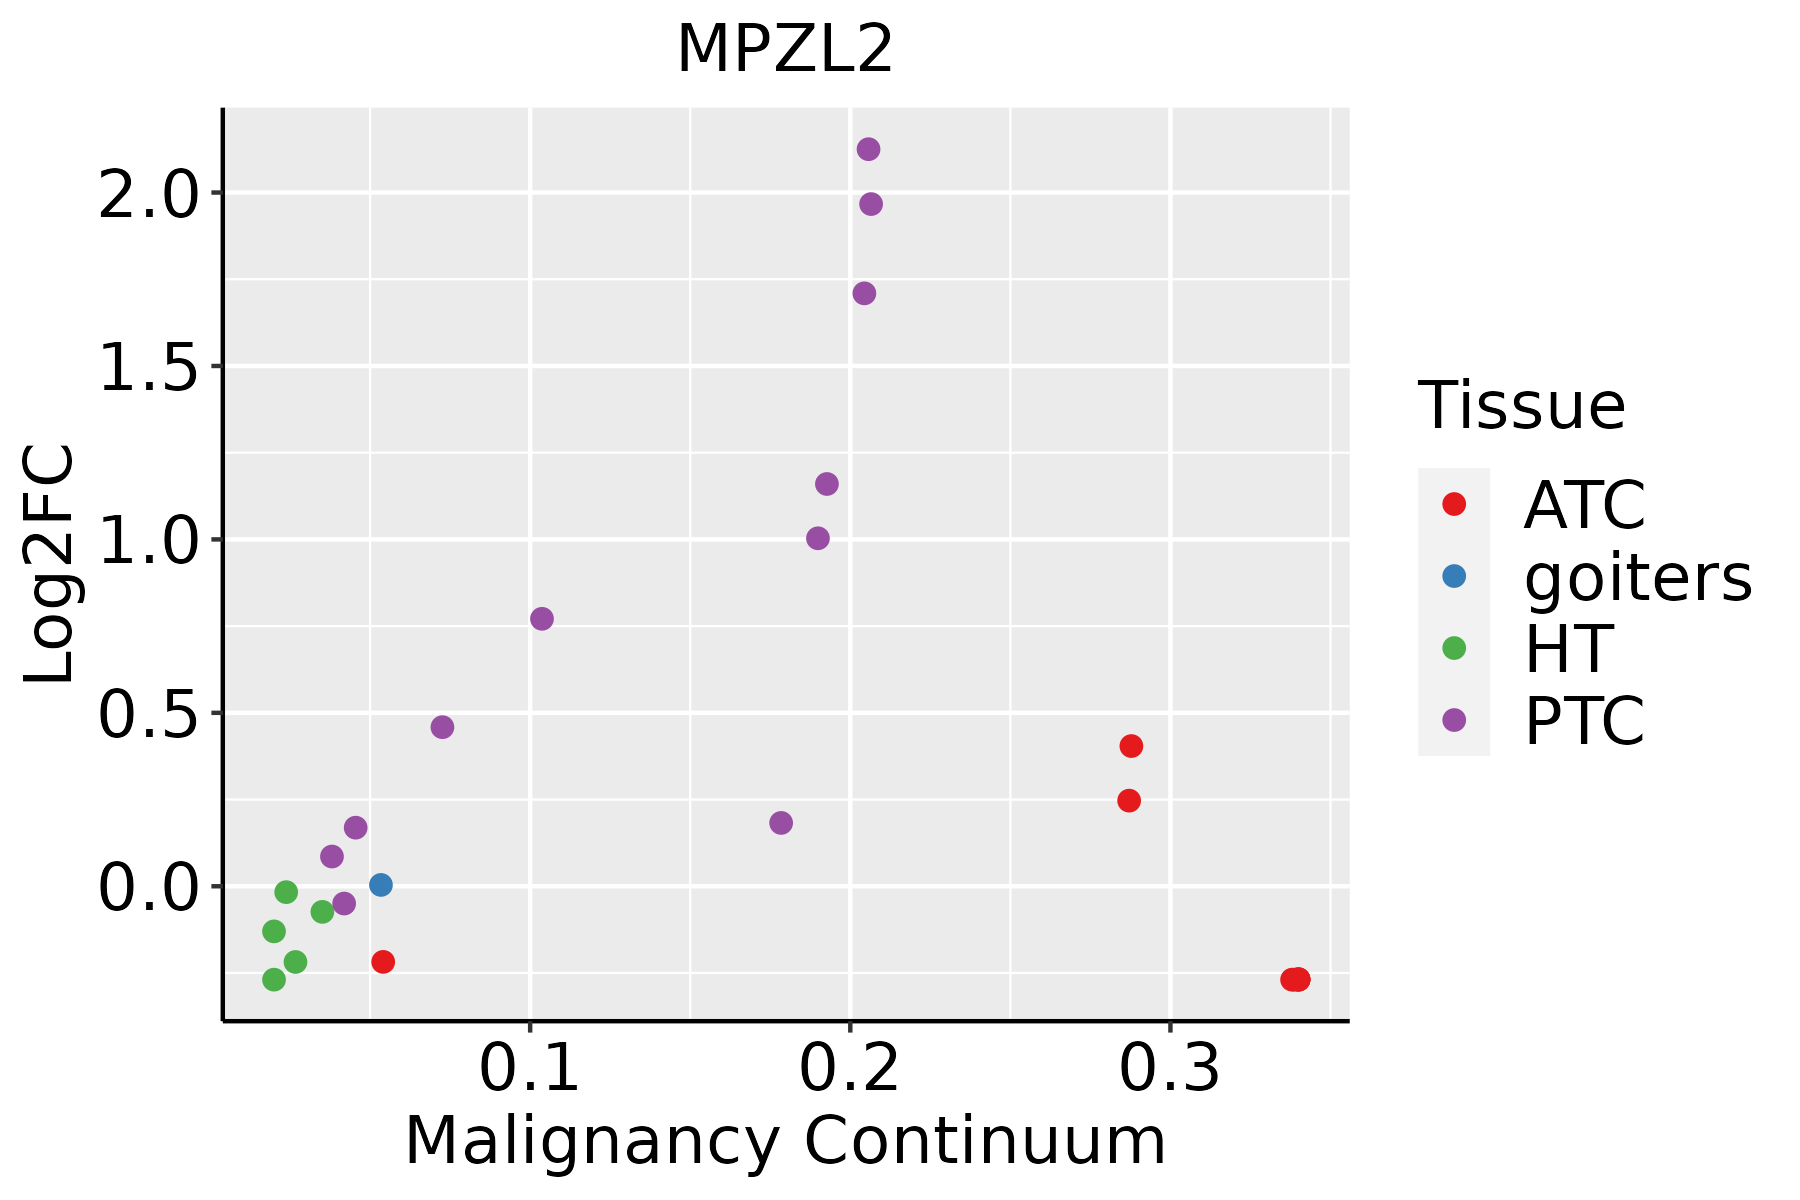 | ATC: Anaplastic thyroid cancer |
| HT: Hashimoto's thyroiditis | ||
| PTC: Papillary thyroid cancer |
| ∗log2FC in expression of this searched gene in stem-like cells from each diseased tissue sample relative to stem-like cells in normal samples in each tissue plotted against the malignancy continuum. Samples are colored based on if they are from different disease stage. |
Top |
Malignant transformation related pathway analysis |
| Find out the enriched GO biological processes and KEGG pathways involved in transition from healthy to precancer to cancer |
| Tissue | Disease Stage | Enriched GO biological Processes |
| Colorectum | AD |  |
| Colorectum | SER |  |
| Colorectum | MSS |  |
| Colorectum | MSI-H |  |
| Colorectum | FAP |  |
| ∗Top 15 enriched GO BP terms are showed in the bar plot of each disease state in each tissue. Each row represents a significant GO biological process which is colored according to the -log10(p.adjust). |
| Page: 1 2 3 4 5 6 7 8 9 |
| GO ID | Tissue | Disease Stage | Description | Gene Ratio | Bg Ratio | pvalue | p.adjust | Count |
| Page: 1 |
| Pathway ID | Tissue | Disease Stage | Description | Gene Ratio | Bg Ratio | pvalue | p.adjust | qvalue | Count |
| Page: 1 |
Top |
Cell-cell communication analysis |
| Identification of potential cell-cell interactions between two cell types and their ligand-receptor pairs for different disease states |
| Ligand | Receptor | LRpair | Pathway | Tissue | Disease Stage |
| Page: 1 |
Top |
Single-cell gene regulatory network inference analysis |
| Find out the significant the regulons (TFs) and the target genes of each regulon across cell types for different disease states |
| TF | Cell Type | Tissue | Disease Stage | Target Gene | RSS | Regulon Activity |
| ∗The dot plots of a searched regulon are shown for all cell subpopulations in each disease state of each tissue based on the regulon specific score inferred using pySCENIC and by calculating the average expression. |
| Page: 1 |
Top |
Somatic mutation of malignant transformation related genes |
| Annotation of somatic variants for genes involved in malignant transformation |
| Hugo Symbol | Variant Class | Variant Classification | dbSNP RS | HGVSc | HGVSp | HGVSp Short | SWISSPROT | BIOTYPE | SIFT | PolyPhen | Tumor Sample Barcode | Tissue | Histology | Sex | Age | Stage | Therapy Types | Drugs | Outcome |
| MPZL2 | SNV | Missense_Mutation | c.239N>G | p.His80Arg | p.H80R | O60487 | protein_coding | tolerated(0.21) | possibly_damaging(0.885) | TCGA-AA-3663-01 | Colorectum | colon adenocarcinoma | Male | <65 | I/II | Unknown | Unknown | SD | |
| MPZL2 | SNV | Missense_Mutation | c.617N>G | p.Lys206Arg | p.K206R | O60487 | protein_coding | tolerated(0.09) | probably_damaging(0.971) | TCGA-CM-6162-01 | Colorectum | colon adenocarcinoma | Female | <65 | III/IV | Chemotherapy | oxaliplatin | SD | |
| MPZL2 | SNV | Missense_Mutation | c.557N>T | p.Arg186Ile | p.R186I | O60487 | protein_coding | deleterious(0.01) | benign(0.143) | TCGA-AG-3892-01 | Colorectum | rectum adenocarcinoma | Female | <65 | I/II | Unknown | Unknown | SD | |
| MPZL2 | SNV | Missense_Mutation | novel | c.12N>T | p.Lys4Asn | p.K4N | O60487 | protein_coding | tolerated_low_confidence(0.27) | benign(0.025) | TCGA-AG-A002-01 | Colorectum | rectum adenocarcinoma | Male | <65 | I/II | Unknown | Unknown | SD |
| MPZL2 | SNV | Missense_Mutation | novel | c.376A>G | p.Lys126Glu | p.K126E | O60487 | protein_coding | deleterious(0.01) | probably_damaging(0.974) | TCGA-A5-A0GG-01 | Endometrium | uterine corpus endometrioid carcinoma | Female | >=65 | I/II | Unknown | Unknown | SD |
| MPZL2 | SNV | Missense_Mutation | novel | c.623N>A | p.Ser208Tyr | p.S208Y | O60487 | protein_coding | tolerated(0.07) | possibly_damaging(0.48) | TCGA-A5-A1OF-01 | Endometrium | uterine corpus endometrioid carcinoma | Female | <65 | I/II | Unknown | Unknown | SD |
| MPZL2 | SNV | Missense_Mutation | rs557493842 | c.439N>T | p.Arg147Cys | p.R147C | O60487 | protein_coding | deleterious(0.03) | benign(0.431) | TCGA-A5-A1OF-01 | Endometrium | uterine corpus endometrioid carcinoma | Female | <65 | I/II | Unknown | Unknown | SD |
| MPZL2 | SNV | Missense_Mutation | rs754348803 | c.584C>T | p.Ser195Leu | p.S195L | O60487 | protein_coding | tolerated(0.33) | benign(0.015) | TCGA-AP-A0LM-01 | Endometrium | uterine corpus endometrioid carcinoma | Female | <65 | III/IV | Chemotherapy | cisplatin | SD |
| MPZL2 | SNV | Missense_Mutation | novel | c.525N>A | p.Phe175Leu | p.F175L | O60487 | protein_coding | tolerated(0.45) | benign(0.006) | TCGA-AP-A1DV-01 | Endometrium | uterine corpus endometrioid carcinoma | Female | <65 | I/II | Unknown | Unknown | SD |
| MPZL2 | SNV | Missense_Mutation | novel | c.20N>A | p.Thr7Asn | p.T7N | O60487 | protein_coding | tolerated(0.38) | benign(0.034) | TCGA-AX-A2HC-01 | Endometrium | uterine corpus endometrioid carcinoma | Female | <65 | III/IV | Chemotherapy | paclitaxel | PD |
| Page: 1 2 3 |
Top |
Related drugs of malignant transformation related genes |
| Identification of chemicals and drugs interact with genes involved in malignant transfromation |
| (DGIdb 4.0) |
| Entrez ID | Symbol | Category | Interaction Types | Drug Claim Name | Drug Name | PMIDs |
| Page: 1 |

Copyright 2023-Present -The University of Texas Health Science Center at Houston |