
|
|||||
|
 | |
| |
| |
| |
| |
| |
|
Gene: MPZL1 |
Gene summary for MPZL1 |
| Gene information | Species | Human | Gene symbol | MPZL1 | Gene ID | 9019 |
| Gene name | myelin protein zero like 1 | |
| Gene Alias | MPZL1b | |
| Cytomap | 1q24.2 | |
| Gene Type | protein-coding | GO ID | GO:0007154 | UniProtAcc | O95297 |
Top |
Malignant transformation analysis |
| Identification of the aberrant gene expression in precancerous and cancerous lesions by comparing the gene expression of stem-like cells in diseased tissues with normal stem cells |
| Entrez ID | Symbol | Replicates | Species | Organ | Tissue | Adj P-value | Log2FC | Malignancy |
| 9019 | MPZL1 | CA_HPV_3 | Human | Cervix | CC | 9.66e-04 | 1.37e-01 | 0.0414 |
| 9019 | MPZL1 | CCI_1 | Human | Cervix | CC | 1.67e-07 | 8.43e-01 | 0.528 |
| 9019 | MPZL1 | CCI_2 | Human | Cervix | CC | 1.96e-02 | 5.98e-01 | 0.5249 |
| 9019 | MPZL1 | Tumor | Human | Cervix | CC | 1.79e-11 | 3.18e-01 | 0.1241 |
| 9019 | MPZL1 | sample3 | Human | Cervix | CC | 1.63e-11 | 2.92e-01 | 0.1387 |
| 9019 | MPZL1 | T3 | Human | Cervix | CC | 2.39e-08 | 2.91e-01 | 0.1389 |
| 9019 | MPZL1 | HTA11_3410_2000001011 | Human | Colorectum | AD | 2.52e-04 | -3.51e-01 | 0.0155 |
| 9019 | MPZL1 | HTA11_347_2000001011 | Human | Colorectum | AD | 8.91e-04 | 3.53e-01 | -0.1954 |
| 9019 | MPZL1 | HTA11_99999974143_84620 | Human | Colorectum | MSS | 5.96e-06 | -2.75e-01 | 0.3005 |
| 9019 | MPZL1 | F007 | Human | Colorectum | FAP | 7.34e-03 | -2.64e-01 | 0.1176 |
| 9019 | MPZL1 | A001-C-207 | Human | Colorectum | FAP | 2.71e-05 | -3.31e-01 | 0.1278 |
| 9019 | MPZL1 | A015-C-203 | Human | Colorectum | FAP | 1.68e-27 | -4.68e-01 | -0.1294 |
| 9019 | MPZL1 | A015-C-204 | Human | Colorectum | FAP | 1.11e-04 | -2.38e-01 | -0.0228 |
| 9019 | MPZL1 | A014-C-040 | Human | Colorectum | FAP | 1.27e-03 | -4.79e-01 | -0.1184 |
| 9019 | MPZL1 | A002-C-201 | Human | Colorectum | FAP | 1.72e-17 | -4.79e-01 | 0.0324 |
| 9019 | MPZL1 | A002-C-203 | Human | Colorectum | FAP | 2.64e-08 | -2.57e-01 | 0.2786 |
| 9019 | MPZL1 | A001-C-119 | Human | Colorectum | FAP | 4.12e-12 | -5.62e-01 | -0.1557 |
| 9019 | MPZL1 | A001-C-108 | Human | Colorectum | FAP | 7.97e-16 | -4.17e-01 | -0.0272 |
| 9019 | MPZL1 | A002-C-205 | Human | Colorectum | FAP | 2.43e-25 | -5.33e-01 | -0.1236 |
| 9019 | MPZL1 | A001-C-104 | Human | Colorectum | FAP | 2.19e-07 | -2.71e-01 | 0.0184 |
| Page: 1 2 3 4 5 6 7 8 9 |
| Tissue | Expression Dynamics | Abbreviation |
| Cervix | 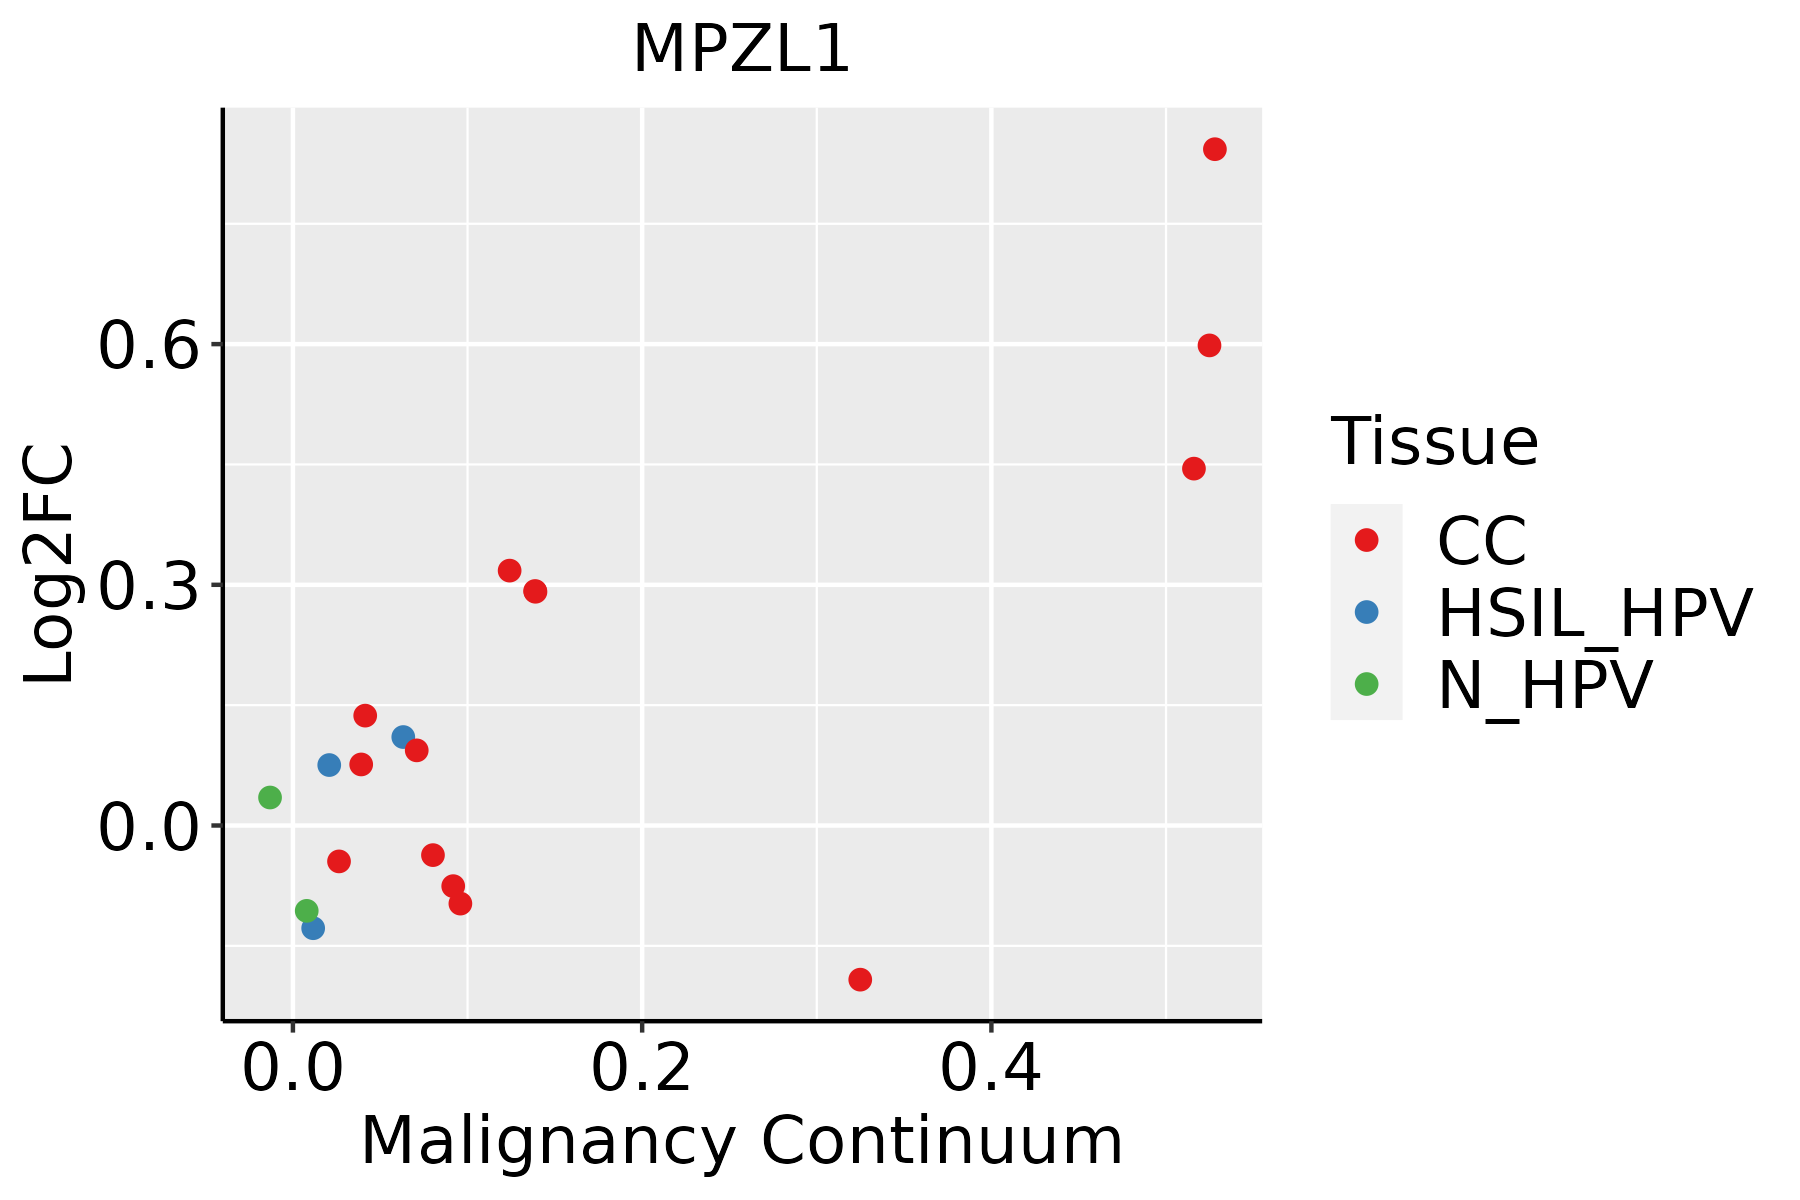 | CC: Cervix cancer |
| HSIL_HPV: HPV-infected high-grade squamous intraepithelial lesions | ||
| N_HPV: HPV-infected normal cervix | ||
| Colorectum (GSE201348) |  | FAP: Familial adenomatous polyposis |
| CRC: Colorectal cancer | ||
| Colorectum (HTA11) |  | AD: Adenomas |
| SER: Sessile serrated lesions | ||
| MSI-H: Microsatellite-high colorectal cancer | ||
| MSS: Microsatellite stable colorectal cancer | ||
| Esophagus | 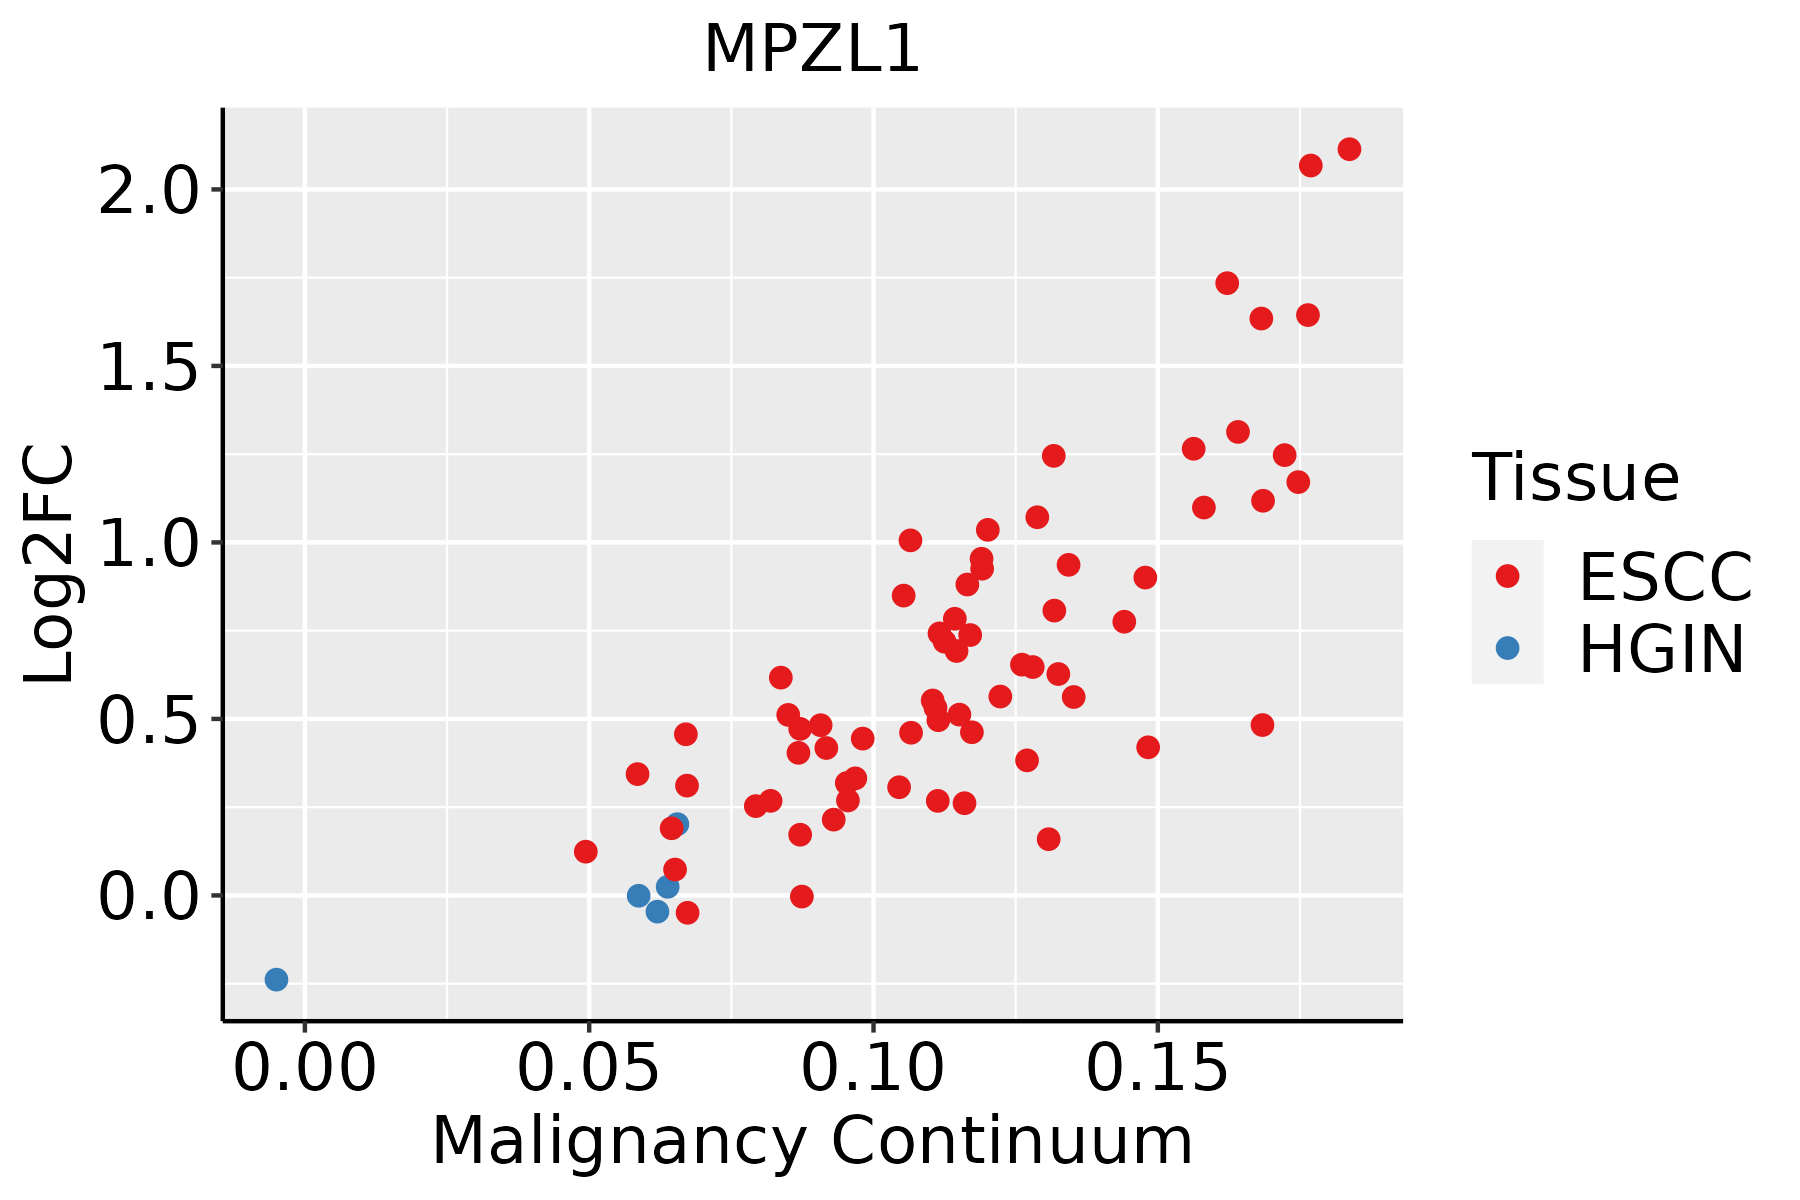 | ESCC: Esophageal squamous cell carcinoma |
| HGIN: High-grade intraepithelial neoplasias | ||
| LGIN: Low-grade intraepithelial neoplasias | ||
| Liver | 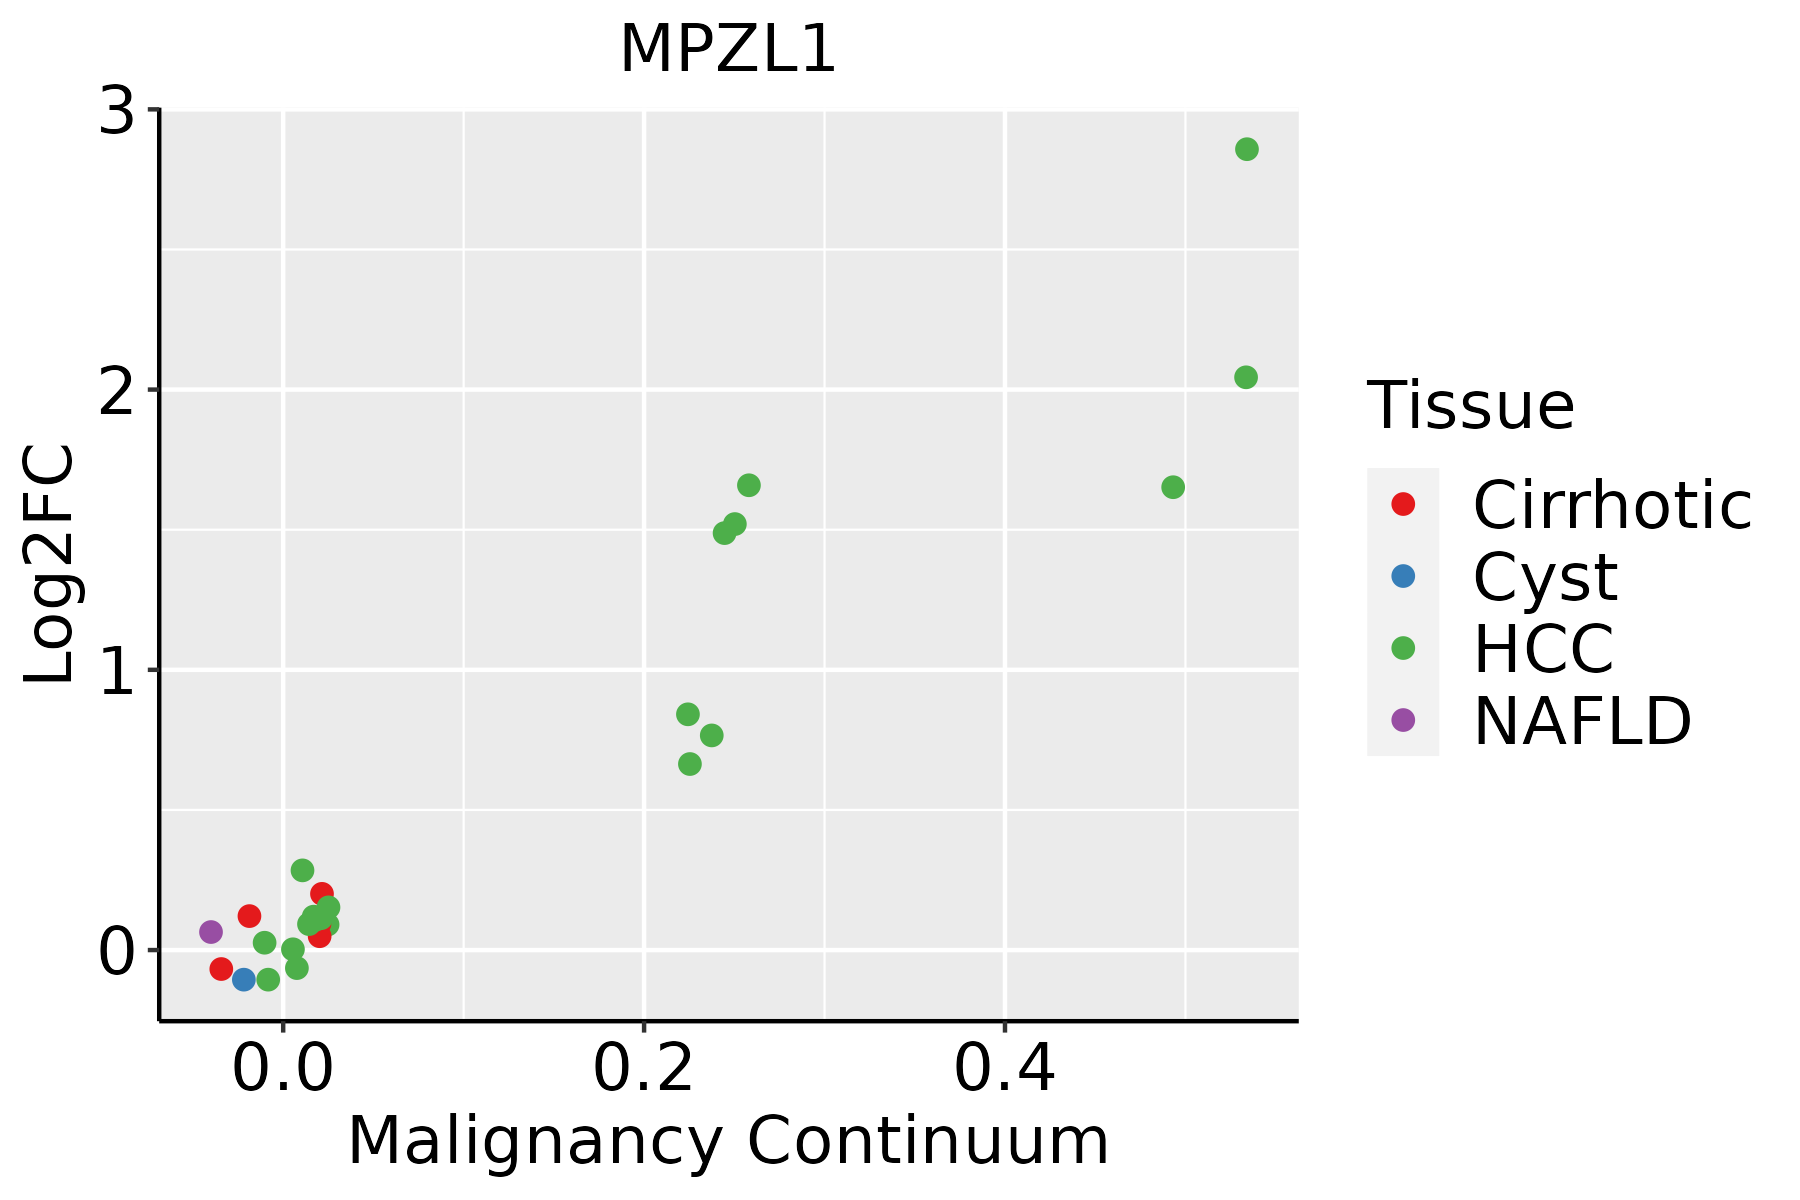 | HCC: Hepatocellular carcinoma |
| NAFLD: Non-alcoholic fatty liver disease | ||
| Oral Cavity | 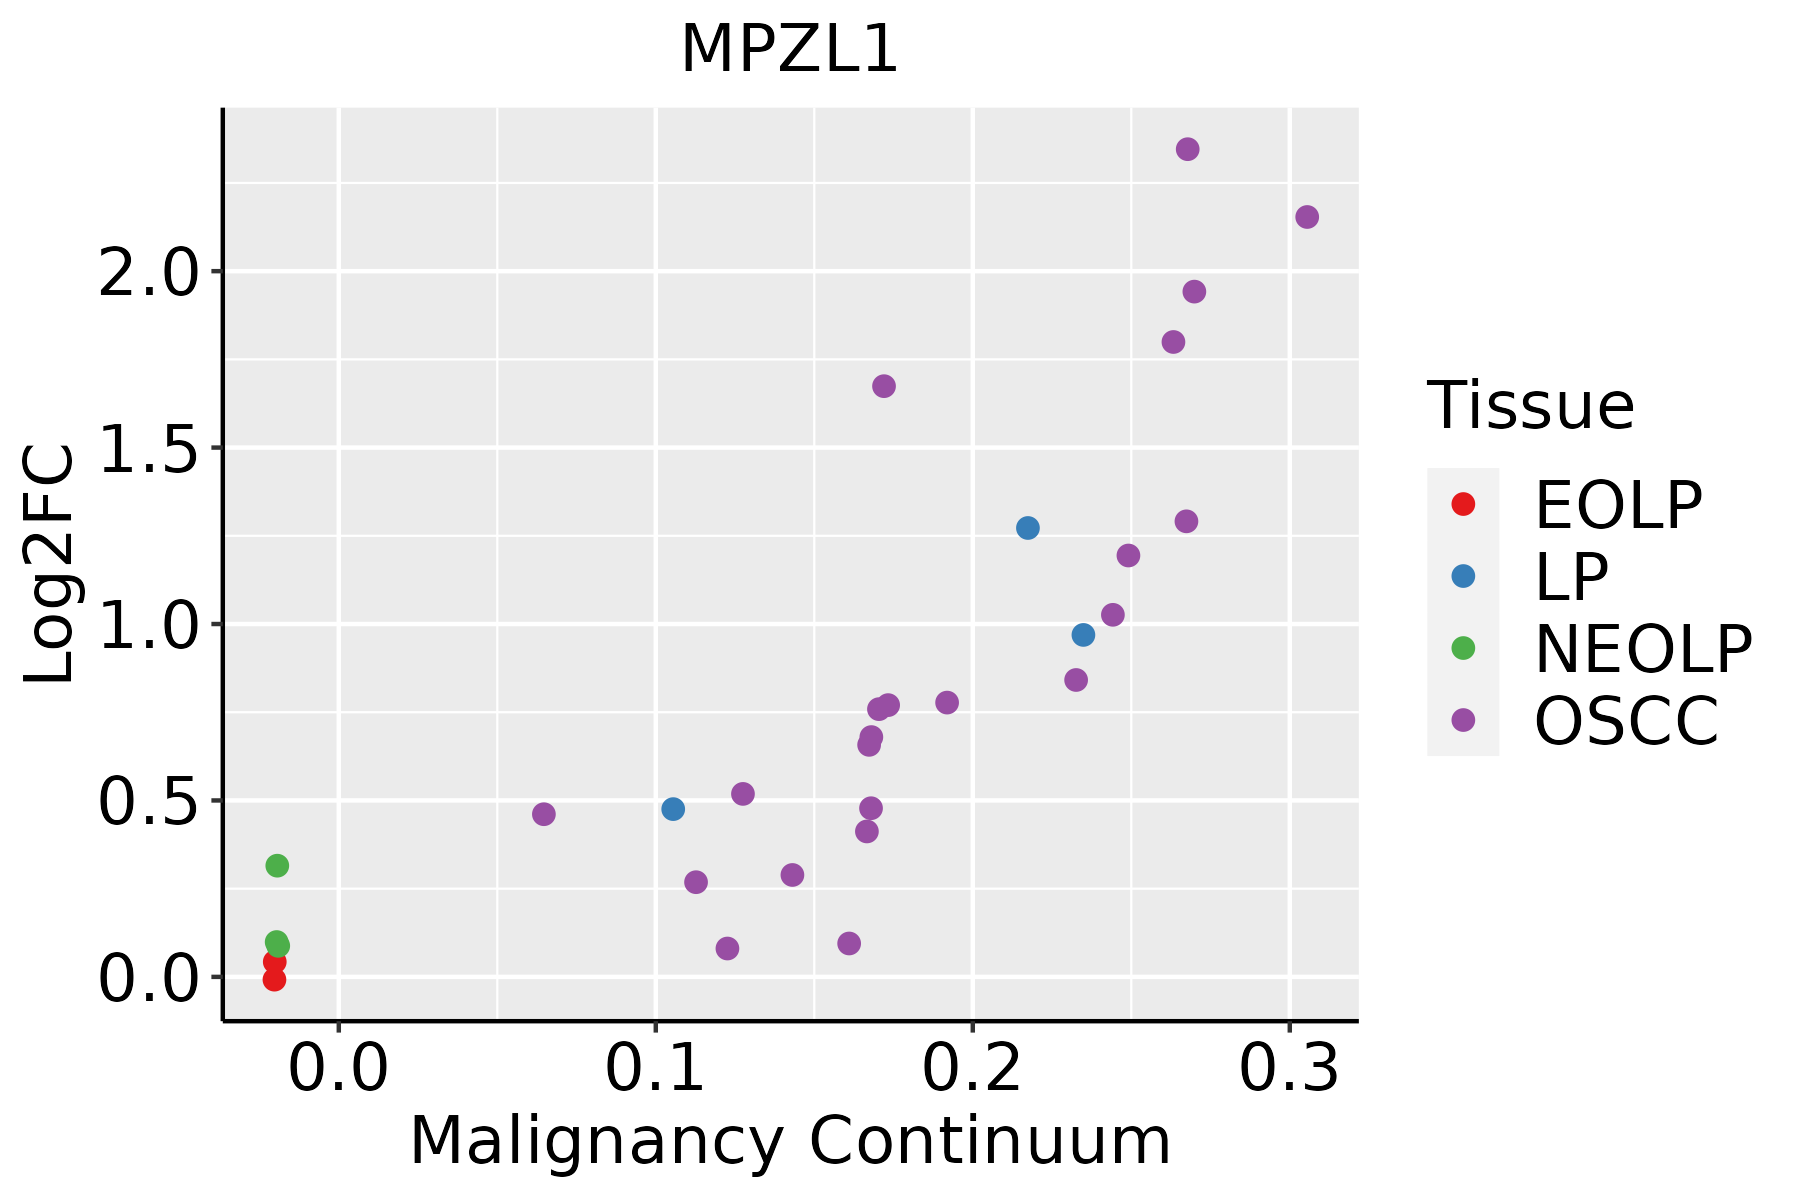 | EOLP: Erosive Oral lichen planus |
| LP: leukoplakia | ||
| NEOLP: Non-erosive oral lichen planus | ||
| OSCC: Oral squamous cell carcinoma | ||
| Prostate | 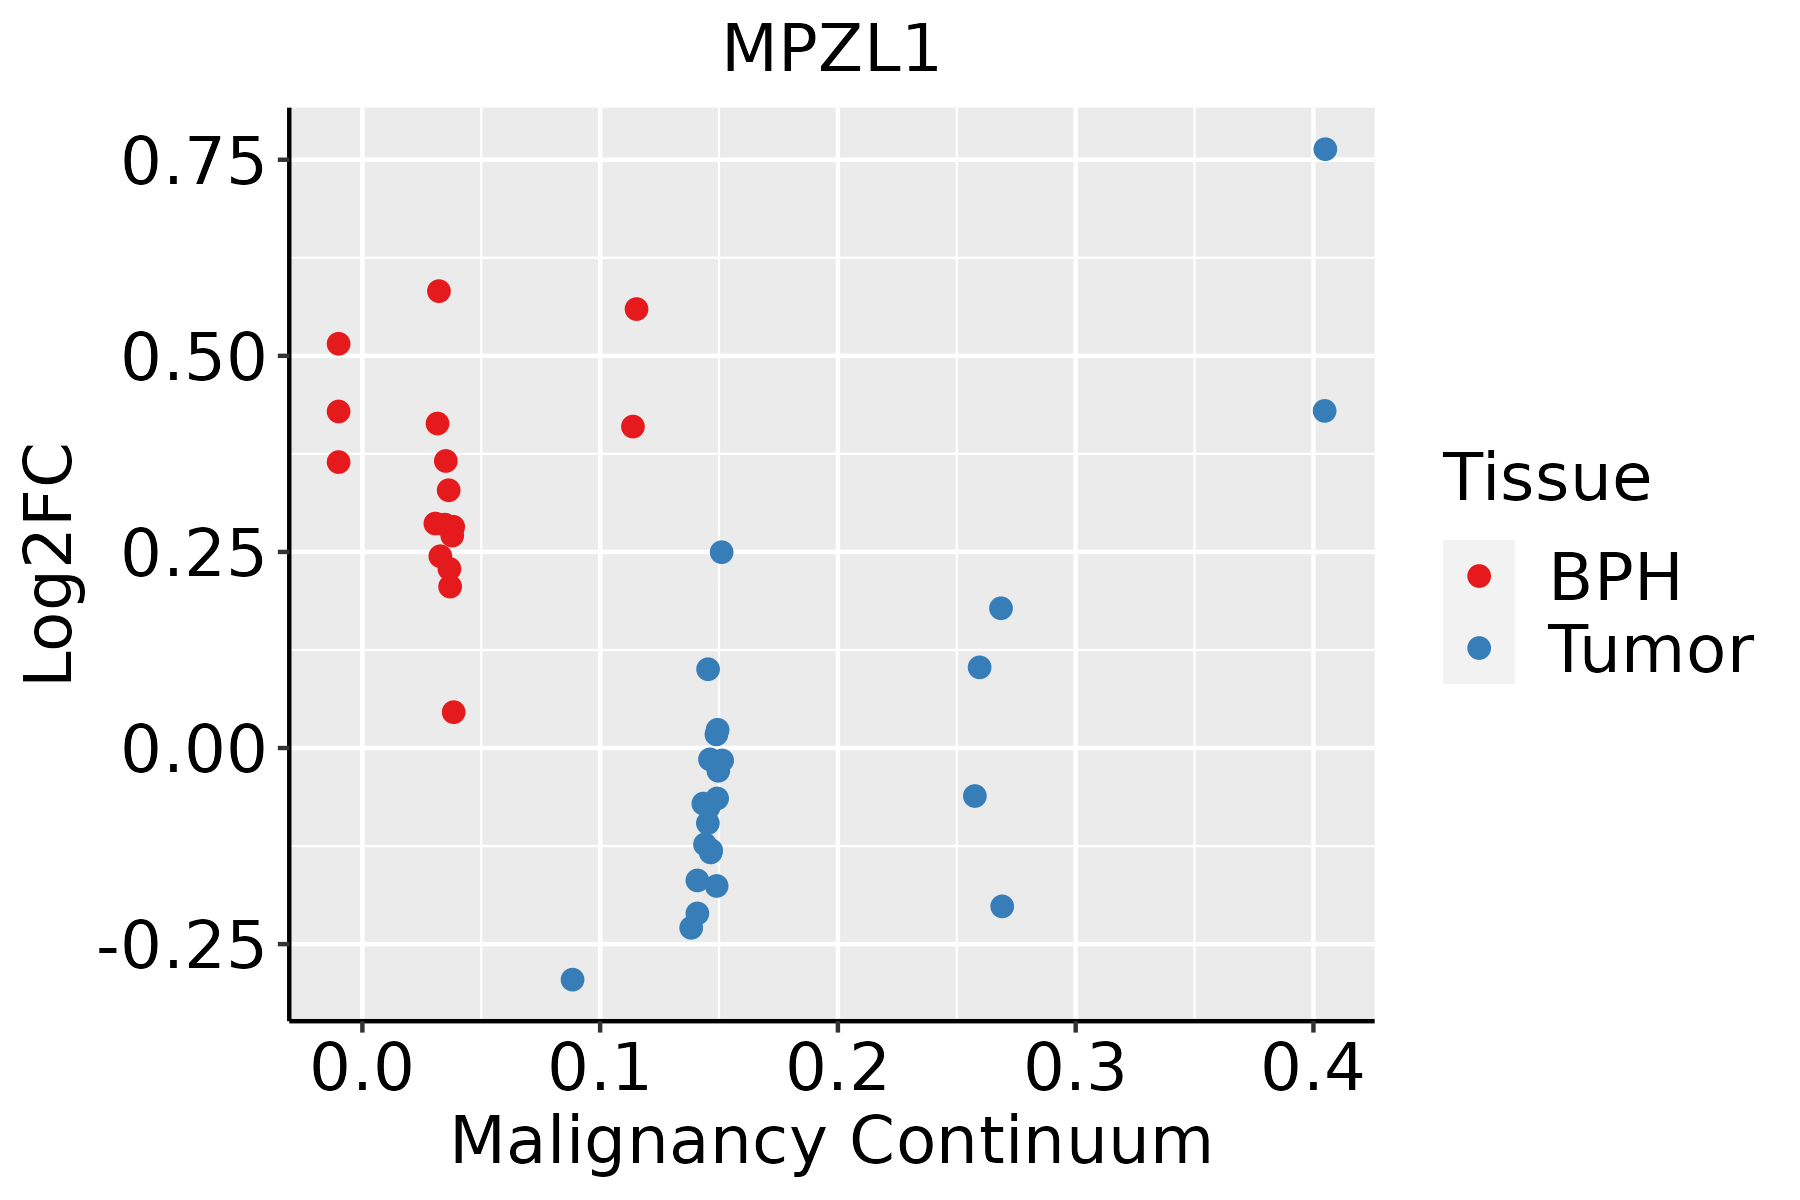 | BPH: Benign Prostatic Hyperplasia |
| Skin | 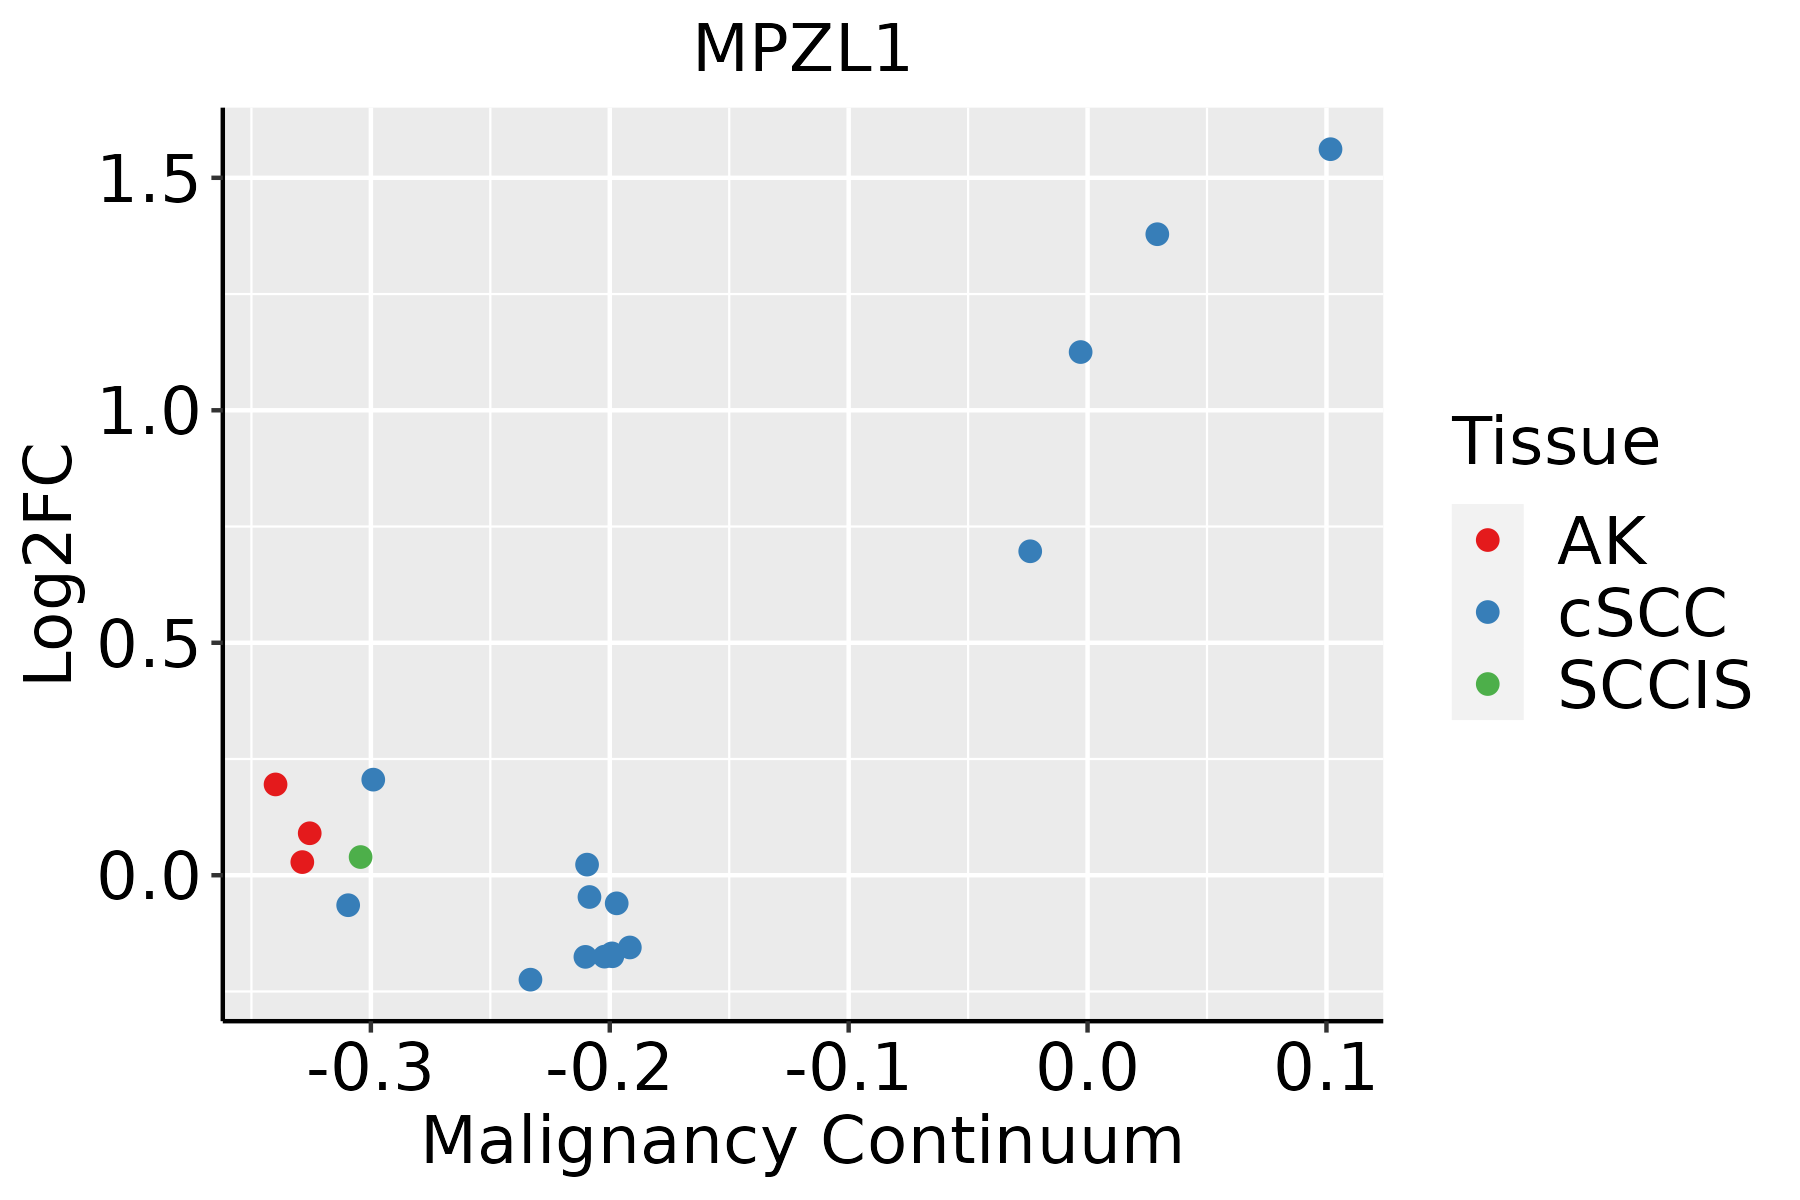 | AK: Actinic keratosis |
| cSCC: Cutaneous squamous cell carcinoma | ||
| SCCIS:squamous cell carcinoma in situ | ||
| Thyroid | 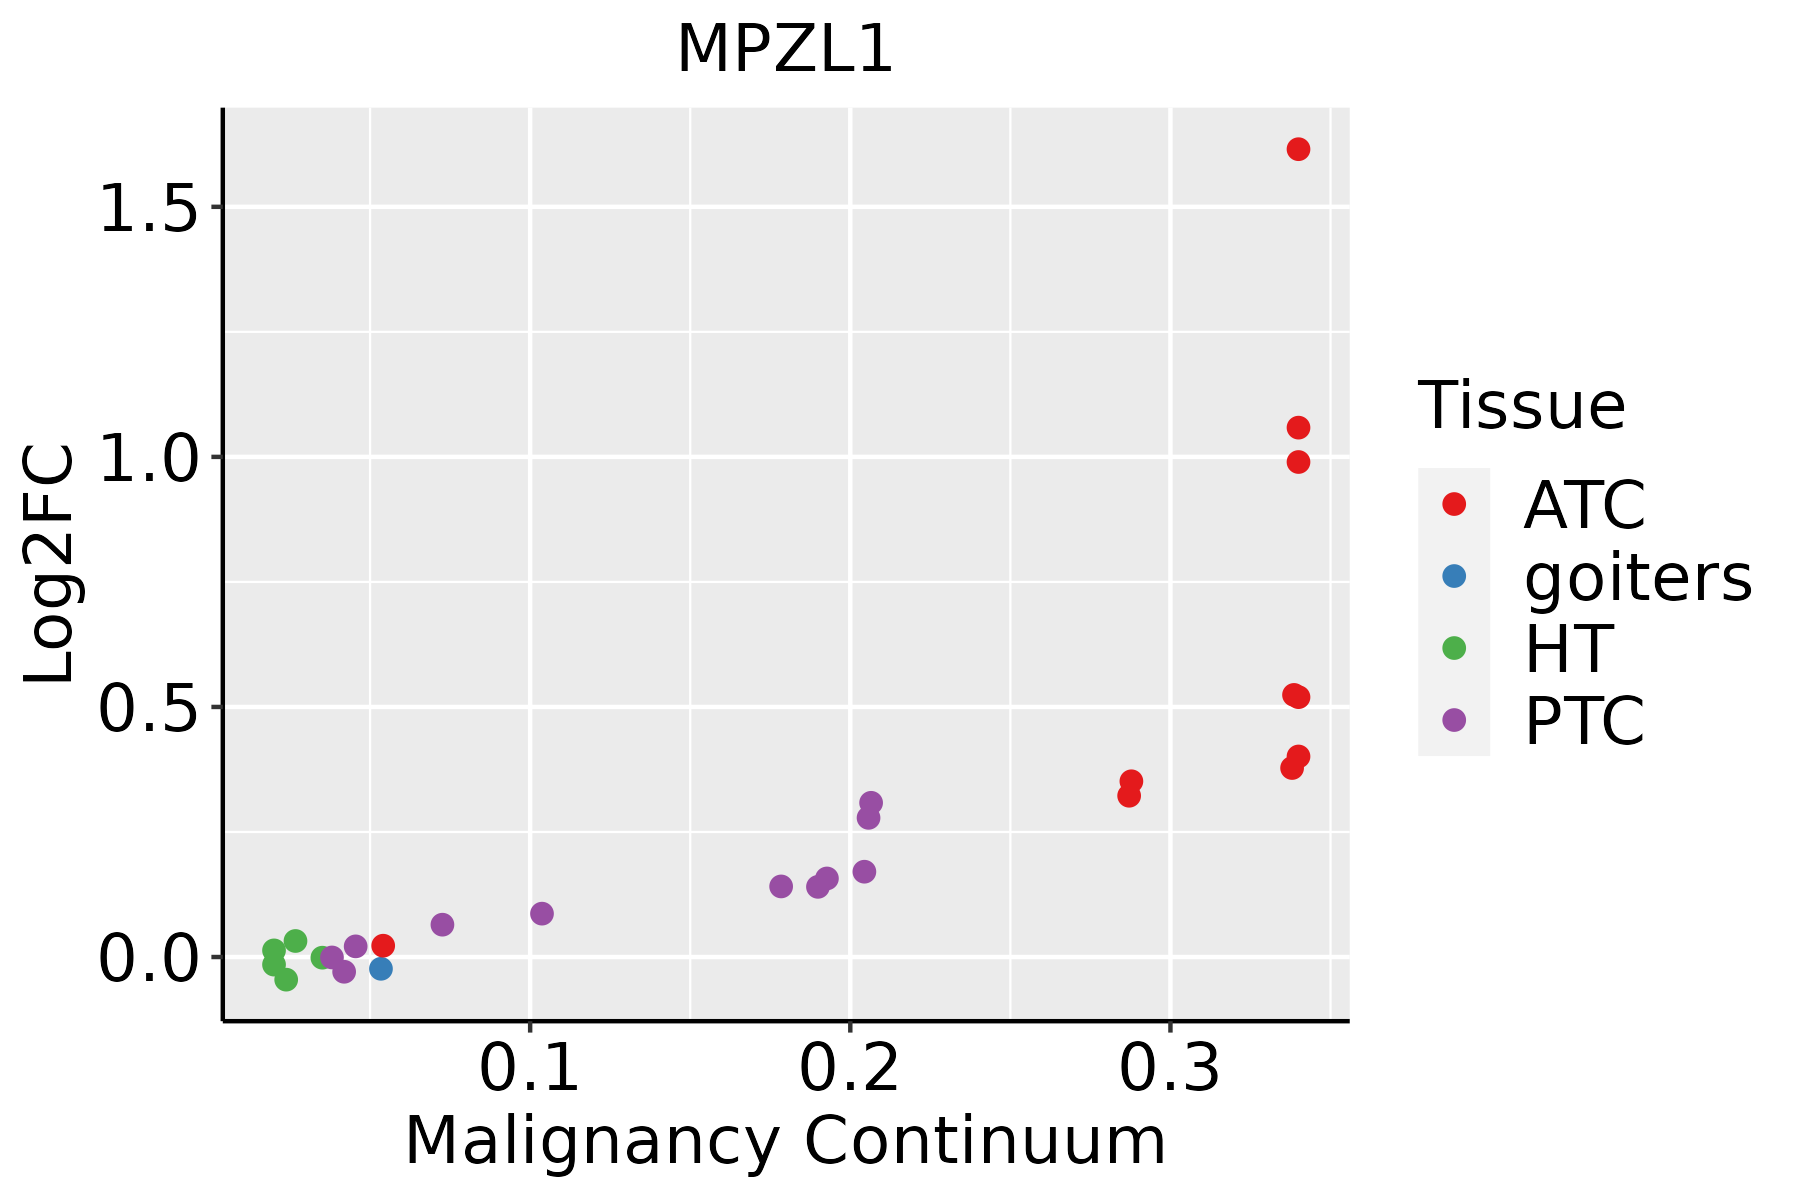 | ATC: Anaplastic thyroid cancer |
| HT: Hashimoto's thyroiditis | ||
| PTC: Papillary thyroid cancer |
| ∗log2FC in expression of this searched gene in stem-like cells from each diseased tissue sample relative to stem-like cells in normal samples in each tissue plotted against the malignancy continuum. Samples are colored based on if they are from different disease stage. |
Top |
Malignant transformation related pathway analysis |
| Find out the enriched GO biological processes and KEGG pathways involved in transition from healthy to precancer to cancer |
| Tissue | Disease Stage | Enriched GO biological Processes |
| Colorectum | AD |  |
| Colorectum | SER |  |
| Colorectum | MSS |  |
| Colorectum | MSI-H |  |
| Colorectum | FAP |  |
| ∗Top 15 enriched GO BP terms are showed in the bar plot of each disease state in each tissue. Each row represents a significant GO biological process which is colored according to the -log10(p.adjust). |
| Page: 1 2 3 4 5 6 7 8 9 |
| GO ID | Tissue | Disease Stage | Description | Gene Ratio | Bg Ratio | pvalue | p.adjust | Count |
| Page: 1 |
| Pathway ID | Tissue | Disease Stage | Description | Gene Ratio | Bg Ratio | pvalue | p.adjust | qvalue | Count |
| hsa045147 | Cervix | CC | Cell adhesion molecules | 36/1267 | 157/8465 | 4.94e-03 | 1.67e-02 | 9.86e-03 | 36 |
| hsa0451412 | Cervix | CC | Cell adhesion molecules | 36/1267 | 157/8465 | 4.94e-03 | 1.67e-02 | 9.86e-03 | 36 |
| Page: 1 |
Top |
Cell-cell communication analysis |
| Identification of potential cell-cell interactions between two cell types and their ligand-receptor pairs for different disease states |
| Ligand | Receptor | LRpair | Pathway | Tissue | Disease Stage |
| MPZL1 | MPZL1 | MPZL1_MPZL1 | MPZ | Breast | ADJ |
| MPZL1 | MPZL1 | MPZL1_MPZL1 | MPZ | Breast | DCIS |
| MPZL1 | MPZL1 | MPZL1_MPZL1 | MPZ | Breast | Healthy |
| MPZL1 | MPZL1 | MPZL1_MPZL1 | MPZ | Breast | IDC |
| MPZL1 | MPZL1 | MPZL1_MPZL1 | MPZ | Breast | Precancer |
| MPZL1 | MPZL1 | MPZL1_MPZL1 | MPZ | Cervix | ADJ |
| MPZL1 | MPZL1 | MPZL1_MPZL1 | MPZ | Cervix | CC |
| MPZL1 | MPZL1 | MPZL1_MPZL1 | MPZ | Cervix | Healthy |
| MPZL1 | MPZL1 | MPZL1_MPZL1 | MPZ | Cervix | Precancer |
| MPZL1 | MPZL1 | MPZL1_MPZL1 | MPZ | CRC | ADJ |
| MPZL1 | MPZL1 | MPZL1_MPZL1 | MPZ | CRC | Healthy |
| MPZL1 | MPZL1 | MPZL1_MPZL1 | MPZ | CRC | MSI-H |
| MPZL1 | MPZL1 | MPZL1_MPZL1 | MPZ | CRC | MSS |
| MPZL1 | MPZL1 | MPZL1_MPZL1 | MPZ | CRC | SER |
| MPZL1 | MPZL1 | MPZL1_MPZL1 | MPZ | Endometrium | ADJ |
| MPZL1 | MPZL1 | MPZL1_MPZL1 | MPZ | Endometrium | AEH |
| MPZL1 | MPZL1 | MPZL1_MPZL1 | MPZ | Endometrium | EEC |
| MPZL1 | MPZL1 | MPZL1_MPZL1 | MPZ | Endometrium | Healthy |
| MPZ | MPZL1 | MPZ_MPZL1 | MPZ | Esophagus | ESCC |
| MPZL1 | MPZL1 | MPZL1_MPZL1 | MPZ | Esophagus | ESCC |
| Page: 1 2 |
Top |
Single-cell gene regulatory network inference analysis |
| Find out the significant the regulons (TFs) and the target genes of each regulon across cell types for different disease states |
| TF | Cell Type | Tissue | Disease Stage | Target Gene | RSS | Regulon Activity |
| ∗The dot plots of a searched regulon are shown for all cell subpopulations in each disease state of each tissue based on the regulon specific score inferred using pySCENIC and by calculating the average expression. |
| Page: 1 |
Top |
Somatic mutation of malignant transformation related genes |
| Annotation of somatic variants for genes involved in malignant transformation |
| Hugo Symbol | Variant Class | Variant Classification | dbSNP RS | HGVSc | HGVSp | HGVSp Short | SWISSPROT | BIOTYPE | SIFT | PolyPhen | Tumor Sample Barcode | Tissue | Histology | Sex | Age | Stage | Therapy Types | Drugs | Outcome |
| MPZL1 | SNV | Missense_Mutation | rs146968580 | c.202N>A | p.Gly68Arg | p.G68R | O95297 | protein_coding | tolerated(0.23) | benign(0) | TCGA-B6-A0RE-01 | Breast | breast invasive carcinoma | Female | <65 | I/II | Unknown | Unknown | SD |
| MPZL1 | SNV | Missense_Mutation | novel | c.142N>C | p.Val48Leu | p.V48L | O95297 | protein_coding | deleterious(0.04) | benign(0.387) | TCGA-B6-A400-01 | Breast | breast invasive carcinoma | Female | <65 | III/IV | Unknown | Unknown | SD |
| MPZL1 | SNV | Missense_Mutation | rs779811233 | c.646C>T | p.Pro216Ser | p.P216S | O95297 | protein_coding | tolerated(0.05) | benign(0.003) | TCGA-2W-A8YY-01 | Cervix | cervical & endocervical cancer | Female | <65 | I/II | Chemotherapy | cisplatin | CR |
| MPZL1 | SNV | Missense_Mutation | c.713N>T | p.Pro238Leu | p.P238L | O95297 | protein_coding | tolerated(0.07) | probably_damaging(0.996) | TCGA-C5-A1BL-01 | Cervix | cervical & endocervical cancer | Female | <65 | I/II | Unknown | Unknown | SD | |
| MPZL1 | SNV | Missense_Mutation | novel | c.703C>T | p.His235Tyr | p.H235Y | O95297 | protein_coding | tolerated(0.78) | benign(0.342) | TCGA-IR-A3LF-01 | Cervix | cervical & endocervical cancer | Female | <65 | I/II | Unknown | Unknown | SD |
| MPZL1 | SNV | Missense_Mutation | rs367767112 | c.463N>A | p.Val155Ile | p.V155I | O95297 | protein_coding | deleterious(0.03) | benign(0.005) | TCGA-A6-2672-01 | Colorectum | colon adenocarcinoma | Female | >=65 | III/IV | Unknown | Unknown | SD |
| MPZL1 | SNV | Missense_Mutation | c.364N>G | p.Ile122Val | p.I122V | O95297 | protein_coding | tolerated(0.23) | benign(0.426) | TCGA-A6-3809-01 | Colorectum | colon adenocarcinoma | Female | >=65 | I/II | Unknown | Unknown | SD | |
| MPZL1 | SNV | Missense_Mutation | novel | c.391G>A | p.Gly131Ser | p.G131S | O95297 | protein_coding | deleterious(0) | probably_damaging(1) | TCGA-A6-5665-01 | Colorectum | colon adenocarcinoma | Female | >=65 | I/II | Unknown | Unknown | PD |
| MPZL1 | SNV | Missense_Mutation | rs764835005 | c.232N>T | p.Pro78Ser | p.P78S | O95297 | protein_coding | tolerated(0.27) | possibly_damaging(0.629) | TCGA-AA-A01R-01 | Colorectum | colon adenocarcinoma | Male | <65 | III/IV | Chemotherapy | 5-fluorouracil | PD |
| MPZL1 | SNV | Missense_Mutation | c.314N>G | p.Asp105Gly | p.D105G | O95297 | protein_coding | tolerated(0.09) | benign(0.027) | TCGA-CA-6718-01 | Colorectum | colon adenocarcinoma | Male | <65 | I/II | Unknown | Unknown | PD |
| Page: 1 2 3 |
Top |
Related drugs of malignant transformation related genes |
| Identification of chemicals and drugs interact with genes involved in malignant transfromation |
| (DGIdb 4.0) |
| Entrez ID | Symbol | Category | Interaction Types | Drug Claim Name | Drug Name | PMIDs |
| Page: 1 |

Copyright 2023-Present -The University of Texas Health Science Center at Houston |