
|
|||||
|
 | |
| |
| |
| |
| |
| |
|
Gene: MPZ |
Gene summary for MPZ |
| Gene information | Species | Human | Gene symbol | MPZ | Gene ID | 4359 |
| Gene name | myelin protein zero | |
| Gene Alias | CHM | |
| Cytomap | 1q23.3 | |
| Gene Type | protein-coding | GO ID | GO:0006915 | UniProtAcc | P25189 |
Top |
Malignant transformation analysis |
| Identification of the aberrant gene expression in precancerous and cancerous lesions by comparing the gene expression of stem-like cells in diseased tissues with normal stem cells |
| Entrez ID | Symbol | Replicates | Species | Organ | Tissue | Adj P-value | Log2FC | Malignancy |
| 4359 | MPZ | P8T-E | Human | Esophagus | ESCC | 3.50e-02 | 1.60e-01 | 0.0889 |
| 4359 | MPZ | P16T-E | Human | Esophagus | ESCC | 4.24e-18 | 9.39e-01 | 0.1153 |
| 4359 | MPZ | P49T-E | Human | Esophagus | ESCC | 7.48e-03 | 3.12e-01 | 0.1768 |
| 4359 | MPZ | P56T-E | Human | Esophagus | ESCC | 5.84e-10 | 3.03e+00 | 0.1613 |
| 4359 | MPZ | P76T-E | Human | Esophagus | ESCC | 2.05e-07 | 5.05e-01 | 0.1207 |
| Page: 1 |
| Tissue | Expression Dynamics | Abbreviation |
| Esophagus | 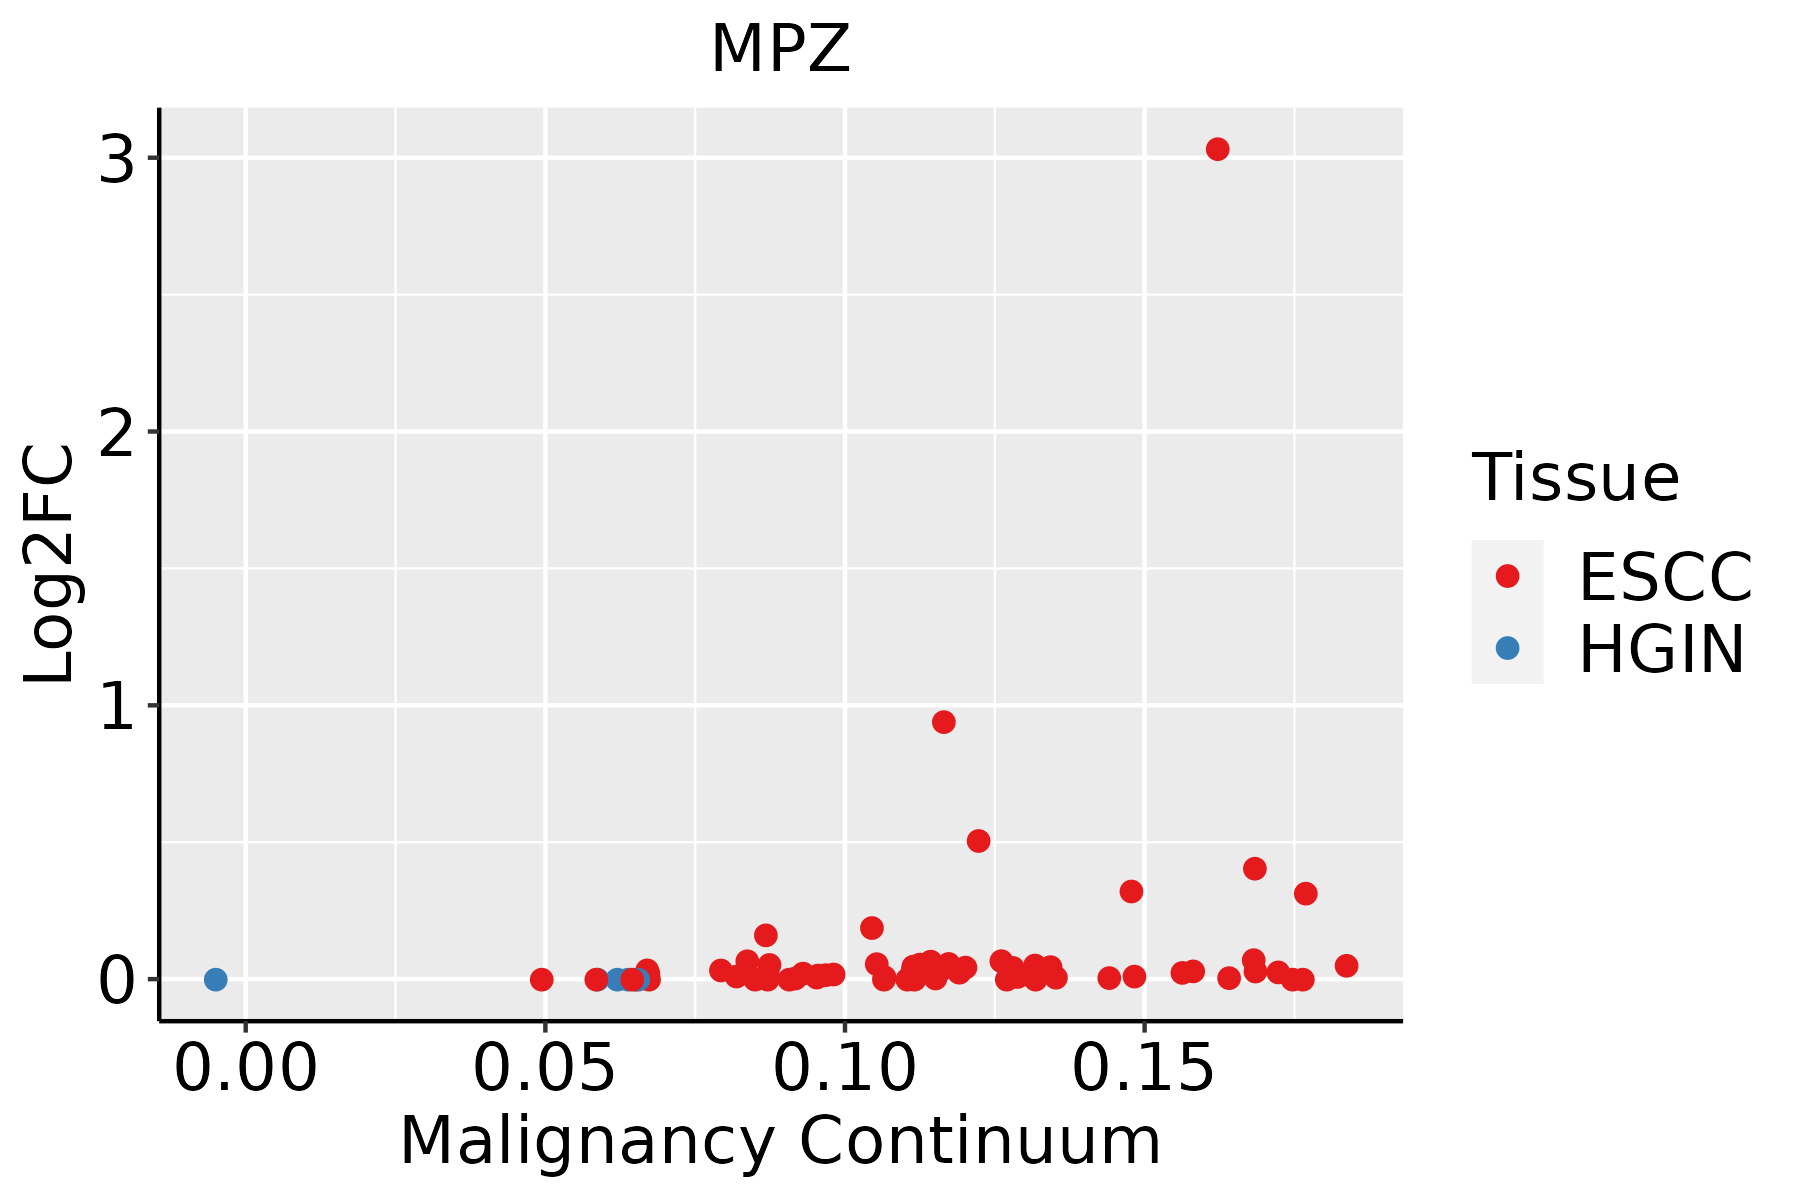 | ESCC: Esophageal squamous cell carcinoma |
| HGIN: High-grade intraepithelial neoplasias | ||
| LGIN: Low-grade intraepithelial neoplasias |
| ∗log2FC in expression of this searched gene in stem-like cells from each diseased tissue sample relative to stem-like cells in normal samples in each tissue plotted against the malignancy continuum. Samples are colored based on if they are from different disease stage. |
Top |
Malignant transformation related pathway analysis |
| Find out the enriched GO biological processes and KEGG pathways involved in transition from healthy to precancer to cancer |
| Tissue | Disease Stage | Enriched GO biological Processes |
| Colorectum | AD |  |
| Colorectum | SER |  |
| Colorectum | MSS |  |
| Colorectum | MSI-H |  |
| Colorectum | FAP |  |
| ∗Top 15 enriched GO BP terms are showed in the bar plot of each disease state in each tissue. Each row represents a significant GO biological process which is colored according to the -log10(p.adjust). |
| Page: 1 2 3 4 5 6 7 8 9 |
| GO ID | Tissue | Disease Stage | Description | Gene Ratio | Bg Ratio | pvalue | p.adjust | Count |
| GO:00425524 | Esophagus | ESCC | myelination | 85/8552 | 134/18723 | 2.51e-05 | 2.13e-04 | 85 |
| GO:00072724 | Esophagus | ESCC | ensheathment of neurons | 86/8552 | 136/18723 | 2.68e-05 | 2.24e-04 | 86 |
| GO:00083664 | Esophagus | ESCC | axon ensheathment | 86/8552 | 136/18723 | 2.68e-05 | 2.24e-04 | 86 |
| GO:00301984 | Esophagus | ESCC | extracellular matrix organization | 171/8552 | 301/18723 | 6.08e-05 | 4.67e-04 | 171 |
| GO:00430624 | Esophagus | ESCC | extracellular structure organization | 171/8552 | 302/18723 | 7.73e-05 | 5.76e-04 | 171 |
| GO:00452294 | Esophagus | ESCC | external encapsulating structure organization | 172/8552 | 304/18723 | 7.80e-05 | 5.80e-04 | 172 |
| GO:00423033 | Esophagus | ESCC | molting cycle | 64/8552 | 107/18723 | 2.24e-03 | 9.85e-03 | 64 |
| GO:00426333 | Esophagus | ESCC | hair cycle | 64/8552 | 107/18723 | 2.24e-03 | 9.85e-03 | 64 |
| Page: 1 |
| Pathway ID | Tissue | Disease Stage | Description | Gene Ratio | Bg Ratio | pvalue | p.adjust | qvalue | Count |
| Page: 1 |
Top |
Cell-cell communication analysis |
| Identification of potential cell-cell interactions between two cell types and their ligand-receptor pairs for different disease states |
| Ligand | Receptor | LRpair | Pathway | Tissue | Disease Stage |
| MPZL1 | MPZL1 | MPZL1_MPZL1 | MPZ | Breast | ADJ |
| MPZL1 | MPZL1 | MPZL1_MPZL1 | MPZ | Breast | DCIS |
| MPZL1 | MPZL1 | MPZL1_MPZL1 | MPZ | Breast | Healthy |
| MPZL1 | MPZL1 | MPZL1_MPZL1 | MPZ | Breast | IDC |
| MPZL1 | MPZL1 | MPZL1_MPZL1 | MPZ | Breast | Precancer |
| MPZL1 | MPZL1 | MPZL1_MPZL1 | MPZ | Cervix | ADJ |
| MPZL1 | MPZL1 | MPZL1_MPZL1 | MPZ | Cervix | CC |
| MPZL1 | MPZL1 | MPZL1_MPZL1 | MPZ | Cervix | Healthy |
| MPZL1 | MPZL1 | MPZL1_MPZL1 | MPZ | Cervix | Precancer |
| MPZL1 | MPZL1 | MPZL1_MPZL1 | MPZ | CRC | ADJ |
| MPZL1 | MPZL1 | MPZL1_MPZL1 | MPZ | CRC | Healthy |
| MPZL1 | MPZL1 | MPZL1_MPZL1 | MPZ | CRC | MSI-H |
| MPZL1 | MPZL1 | MPZL1_MPZL1 | MPZ | CRC | MSS |
| MPZL1 | MPZL1 | MPZL1_MPZL1 | MPZ | CRC | SER |
| MPZL1 | MPZL1 | MPZL1_MPZL1 | MPZ | Endometrium | ADJ |
| MPZL1 | MPZL1 | MPZL1_MPZL1 | MPZ | Endometrium | AEH |
| MPZL1 | MPZL1 | MPZL1_MPZL1 | MPZ | Endometrium | EEC |
| MPZL1 | MPZL1 | MPZL1_MPZL1 | MPZ | Endometrium | Healthy |
| MPZ | MPZL1 | MPZ_MPZL1 | MPZ | Esophagus | ESCC |
| MPZ | MPZ | MPZ_MPZ | MPZ | Esophagus | ESCC |
| Page: 1 |
Top |
Single-cell gene regulatory network inference analysis |
| Find out the significant the regulons (TFs) and the target genes of each regulon across cell types for different disease states |
| TF | Cell Type | Tissue | Disease Stage | Target Gene | RSS | Regulon Activity |
| ∗The dot plots of a searched regulon are shown for all cell subpopulations in each disease state of each tissue based on the regulon specific score inferred using pySCENIC and by calculating the average expression. |
| Page: 1 |
Top |
Somatic mutation of malignant transformation related genes |
| Annotation of somatic variants for genes involved in malignant transformation |
| Hugo Symbol | Variant Class | Variant Classification | dbSNP RS | HGVSc | HGVSp | HGVSp Short | SWISSPROT | BIOTYPE | SIFT | PolyPhen | Tumor Sample Barcode | Tissue | Histology | Sex | Age | Stage | Therapy Types | Drugs | Outcome |
| MPZ | SNV | Missense_Mutation | c.227N>T | p.Ala76Val | p.A76V | P25189 | protein_coding | tolerated(0.32) | benign(0.081) | TCGA-IR-A3LH-01 | Cervix | cervical & endocervical cancer | Female | <65 | I/II | Chemotherapy | cisplatin | CR | |
| MPZ | SNV | Missense_Mutation | novel | c.496N>A | p.Leu166Ile | p.L166I | P25189 | protein_coding | tolerated(0.08) | benign(0.01) | TCGA-AA-3984-01 | Colorectum | colon adenocarcinoma | Female | <65 | I/II | Unknown | Unknown | SD |
| MPZ | SNV | Missense_Mutation | rs121913589 | c.293G>A | p.Arg98His | p.R98H | P25189 | protein_coding | deleterious(0) | probably_damaging(1) | TCGA-AA-A02R-01 | Colorectum | colon adenocarcinoma | Female | >=65 | I/II | Unknown | Unknown | PD |
| MPZ | SNV | Missense_Mutation | novel | c.76N>T | p.Pro26Ser | p.P26S | P25189 | protein_coding | tolerated(0.16) | benign(0.017) | TCGA-AZ-6605-01 | Colorectum | colon adenocarcinoma | Male | >=65 | III/IV | Chemotherapy | folfox | SD |
| MPZ | SNV | Missense_Mutation | novel | c.280N>G | p.Thr94Ala | p.T94A | P25189 | protein_coding | tolerated(0.29) | benign(0) | TCGA-A5-A0G2-01 | Endometrium | uterine corpus endometrioid carcinoma | Female | <65 | III/IV | Unknown | Unknown | SD |
| MPZ | SNV | Missense_Mutation | c.86C>T | p.Ala29Val | p.A29V | P25189 | protein_coding | deleterious(0) | probably_damaging(0.977) | TCGA-AP-A051-01 | Endometrium | uterine corpus endometrioid carcinoma | Female | >=65 | I/II | Unknown | Unknown | SD | |
| MPZ | SNV | Missense_Mutation | rs775916243 | c.466N>A | p.Val156Ile | p.V156I | P25189 | protein_coding | deleterious(0.04) | benign(0.017) | TCGA-AP-A059-01 | Endometrium | uterine corpus endometrioid carcinoma | Female | >=65 | I/II | Unknown | Unknown | SD |
| MPZ | SNV | Missense_Mutation | c.427A>G | p.Thr143Ala | p.T143A | P25189 | protein_coding | tolerated(0.12) | benign(0.057) | TCGA-B5-A11E-01 | Endometrium | uterine corpus endometrioid carcinoma | Female | <65 | I/II | Unknown | Unknown | SD | |
| MPZ | SNV | Missense_Mutation | rs573007540 | c.211N>A | p.Glu71Lys | p.E71K | P25189 | protein_coding | deleterious(0.01) | possibly_damaging(0.762) | TCGA-55-A48Y-01 | Lung | lung adenocarcinoma | Male | >=65 | I/II | Chemotherapy | carboplatin | CR |
| MPZ | SNV | Missense_Mutation | c.346N>G | p.Asn116Asp | p.N116D | P25189 | protein_coding | tolerated(0.07) | benign(0.353) | TCGA-CN-A6V6-01 | Oral cavity | head & neck squamous cell carcinoma | Male | <65 | I/II | Chemotherapy | cisplatin | CR |
| Page: 1 2 |
Top |
Related drugs of malignant transformation related genes |
| Identification of chemicals and drugs interact with genes involved in malignant transfromation |
| (DGIdb 4.0) |
| Entrez ID | Symbol | Category | Interaction Types | Drug Claim Name | Drug Name | PMIDs |
| Page: 1 |

Copyright 2023-Present -The University of Texas Health Science Center at Houston |