
|
|||||
|
 | |
| |
| |
| |
| |
| |
|
Gene: MPV17L2 |
Gene summary for MPV17L2 |
| Gene information | Species | Human | Gene symbol | MPV17L2 | Gene ID | 84769 |
| Gene name | MPV17 mitochondrial inner membrane protein like 2 | |
| Gene Alias | FKSG24 | |
| Cytomap | 19p13.11 | |
| Gene Type | protein-coding | GO ID | GO:0006412 | UniProtAcc | A0A024R7K6 |
Top |
Malignant transformation analysis |
| Identification of the aberrant gene expression in precancerous and cancerous lesions by comparing the gene expression of stem-like cells in diseased tissues with normal stem cells |
| Entrez ID | Symbol | Replicates | Species | Organ | Tissue | Adj P-value | Log2FC | Malignancy |
| 84769 | MPV17L2 | LZE4T | Human | Esophagus | ESCC | 4.83e-03 | 2.29e-01 | 0.0811 |
| 84769 | MPV17L2 | LZE7T | Human | Esophagus | ESCC | 3.78e-08 | 3.02e-01 | 0.0667 |
| 84769 | MPV17L2 | LZE20T | Human | Esophagus | ESCC | 4.65e-03 | 1.21e-01 | 0.0662 |
| 84769 | MPV17L2 | LZE24T | Human | Esophagus | ESCC | 1.87e-05 | 1.86e-01 | 0.0596 |
| 84769 | MPV17L2 | LZE6T | Human | Esophagus | ESCC | 1.87e-03 | 2.64e-01 | 0.0845 |
| 84769 | MPV17L2 | P1T-E | Human | Esophagus | ESCC | 3.29e-04 | 2.45e-01 | 0.0875 |
| 84769 | MPV17L2 | P2T-E | Human | Esophagus | ESCC | 7.27e-09 | 1.60e-01 | 0.1177 |
| 84769 | MPV17L2 | P4T-E | Human | Esophagus | ESCC | 7.50e-16 | 4.96e-01 | 0.1323 |
| 84769 | MPV17L2 | P5T-E | Human | Esophagus | ESCC | 1.86e-16 | 4.75e-01 | 0.1327 |
| 84769 | MPV17L2 | P8T-E | Human | Esophagus | ESCC | 7.36e-08 | 1.55e-01 | 0.0889 |
| 84769 | MPV17L2 | P9T-E | Human | Esophagus | ESCC | 5.34e-14 | 3.64e-01 | 0.1131 |
| 84769 | MPV17L2 | P10T-E | Human | Esophagus | ESCC | 9.03e-15 | 3.95e-01 | 0.116 |
| 84769 | MPV17L2 | P11T-E | Human | Esophagus | ESCC | 9.09e-09 | 4.33e-01 | 0.1426 |
| 84769 | MPV17L2 | P12T-E | Human | Esophagus | ESCC | 7.40e-15 | 3.46e-01 | 0.1122 |
| 84769 | MPV17L2 | P15T-E | Human | Esophagus | ESCC | 1.60e-12 | 1.76e-01 | 0.1149 |
| 84769 | MPV17L2 | P16T-E | Human | Esophagus | ESCC | 7.96e-03 | 1.72e-01 | 0.1153 |
| 84769 | MPV17L2 | P19T-E | Human | Esophagus | ESCC | 8.80e-03 | 3.43e-01 | 0.1662 |
| 84769 | MPV17L2 | P20T-E | Human | Esophagus | ESCC | 2.12e-06 | 1.76e-01 | 0.1124 |
| 84769 | MPV17L2 | P21T-E | Human | Esophagus | ESCC | 5.72e-17 | 4.27e-01 | 0.1617 |
| 84769 | MPV17L2 | P22T-E | Human | Esophagus | ESCC | 6.65e-11 | 2.32e-01 | 0.1236 |
| Page: 1 2 3 4 5 |
| Tissue | Expression Dynamics | Abbreviation |
| Esophagus | 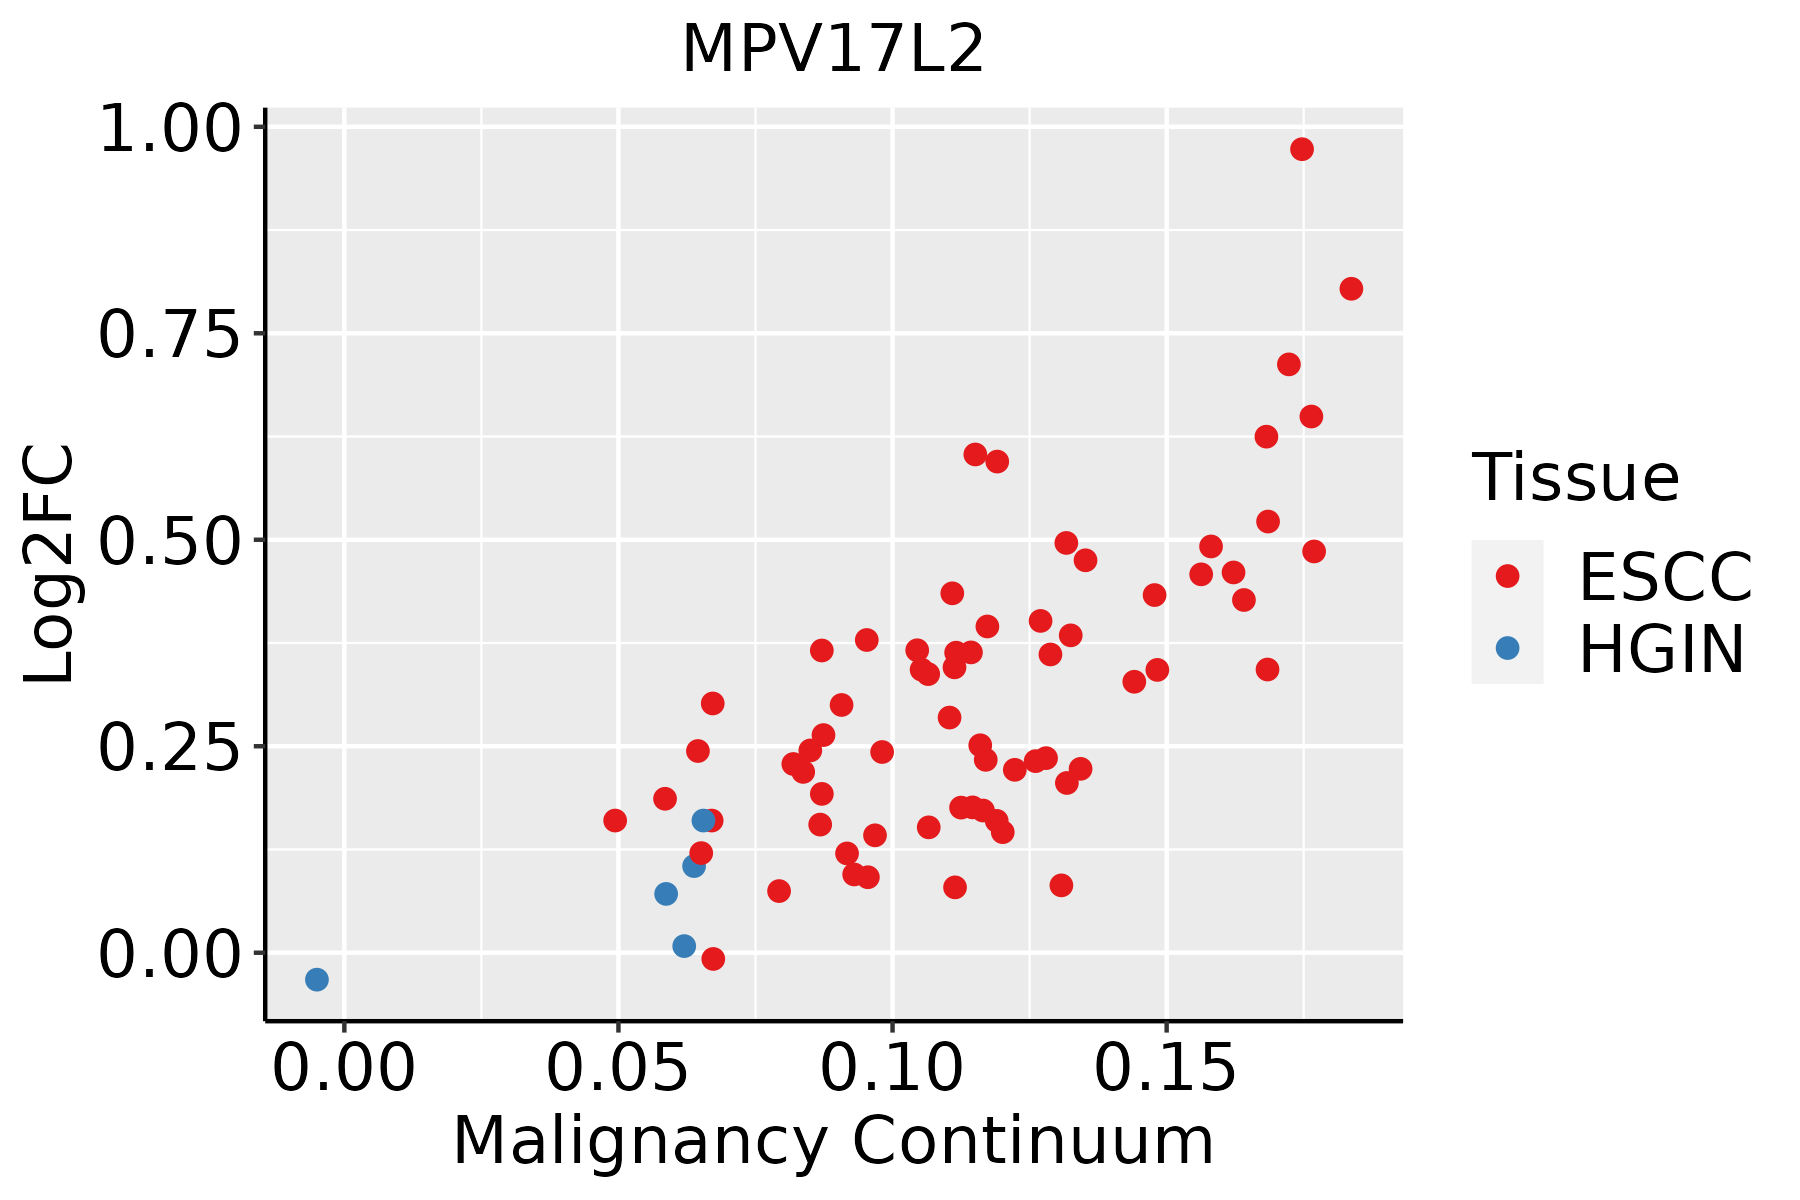 | ESCC: Esophageal squamous cell carcinoma |
| HGIN: High-grade intraepithelial neoplasias | ||
| LGIN: Low-grade intraepithelial neoplasias | ||
| Liver | 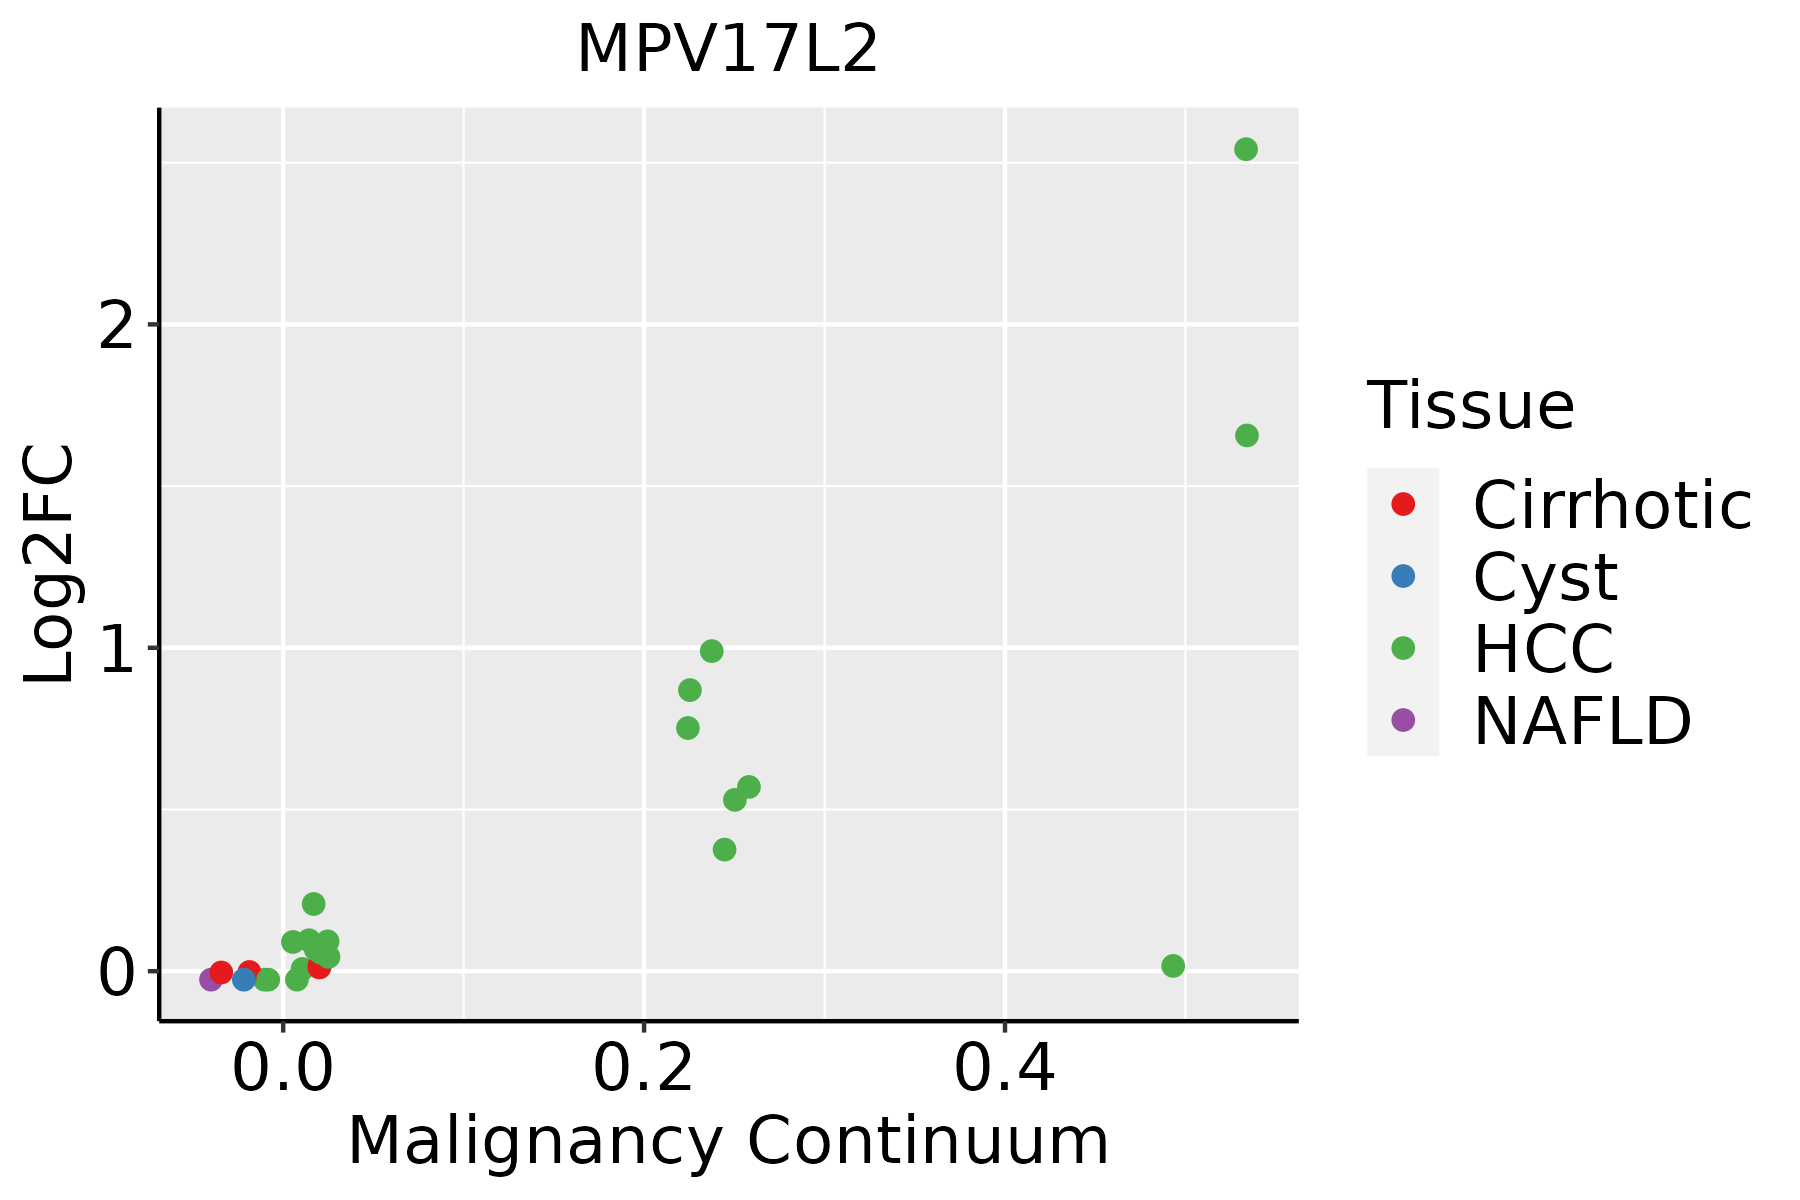 | HCC: Hepatocellular carcinoma |
| NAFLD: Non-alcoholic fatty liver disease | ||
| Oral Cavity |  | EOLP: Erosive Oral lichen planus |
| LP: leukoplakia | ||
| NEOLP: Non-erosive oral lichen planus | ||
| OSCC: Oral squamous cell carcinoma |
| ∗log2FC in expression of this searched gene in stem-like cells from each diseased tissue sample relative to stem-like cells in normal samples in each tissue plotted against the malignancy continuum. Samples are colored based on if they are from different disease stage. |
Top |
Malignant transformation related pathway analysis |
| Find out the enriched GO biological processes and KEGG pathways involved in transition from healthy to precancer to cancer |
| Tissue | Disease Stage | Enriched GO biological Processes |
| Colorectum | AD |  |
| Colorectum | SER |  |
| Colorectum | MSS |  |
| Colorectum | MSI-H |  |
| Colorectum | FAP |  |
| ∗Top 15 enriched GO BP terms are showed in the bar plot of each disease state in each tissue. Each row represents a significant GO biological process which is colored according to the -log10(p.adjust). |
| Page: 1 2 3 4 5 6 7 8 9 |
| GO ID | Tissue | Disease Stage | Description | Gene Ratio | Bg Ratio | pvalue | p.adjust | Count |
| GO:0022613111 | Esophagus | ESCC | ribonucleoprotein complex biogenesis | 365/8552 | 463/18723 | 1.74e-49 | 1.11e-45 | 365 |
| GO:0042254111 | Esophagus | ESCC | ribosome biogenesis | 252/8552 | 299/18723 | 3.27e-44 | 1.04e-40 | 252 |
| GO:014005313 | Esophagus | ESCC | mitochondrial gene expression | 93/8552 | 108/18723 | 1.96e-18 | 2.03e-16 | 93 |
| GO:0006417111 | Esophagus | ESCC | regulation of translation | 304/8552 | 468/18723 | 1.53e-17 | 1.33e-15 | 304 |
| GO:003254314 | Esophagus | ESCC | mitochondrial translation | 68/8552 | 76/18723 | 1.02e-15 | 6.86e-14 | 68 |
| GO:0045727111 | Esophagus | ESCC | positive regulation of translation | 107/8552 | 136/18723 | 2.79e-15 | 1.68e-13 | 107 |
| GO:0034250111 | Esophagus | ESCC | positive regulation of cellular amide metabolic process | 123/8552 | 162/18723 | 3.32e-15 | 1.93e-13 | 123 |
| GO:0042255111 | Esophagus | ESCC | ribosome assembly | 50/8552 | 61/18723 | 5.66e-09 | 1.17e-07 | 50 |
| GO:00701292 | Esophagus | ESCC | regulation of mitochondrial translation | 22/8552 | 24/18723 | 2.82e-06 | 3.21e-05 | 22 |
| GO:00621252 | Esophagus | ESCC | regulation of mitochondrial gene expression | 24/8552 | 28/18723 | 1.37e-05 | 1.25e-04 | 24 |
| GO:00701312 | Esophagus | ESCC | positive regulation of mitochondrial translation | 14/8552 | 15/18723 | 1.47e-04 | 9.85e-04 | 14 |
| GO:002261322 | Liver | HCC | ribonucleoprotein complex biogenesis | 355/7958 | 463/18723 | 7.76e-52 | 4.92e-48 | 355 |
| GO:004225422 | Liver | HCC | ribosome biogenesis | 246/7958 | 299/18723 | 4.99e-46 | 1.58e-42 | 246 |
| GO:000641722 | Liver | HCC | regulation of translation | 287/7958 | 468/18723 | 8.79e-17 | 8.08e-15 | 287 |
| GO:01400531 | Liver | HCC | mitochondrial gene expression | 82/7958 | 108/18723 | 1.49e-12 | 7.20e-11 | 82 |
| GO:00325431 | Liver | HCC | mitochondrial translation | 62/7958 | 76/18723 | 2.95e-12 | 1.34e-10 | 62 |
| GO:004572712 | Liver | HCC | positive regulation of translation | 97/7958 | 136/18723 | 8.51e-12 | 3.55e-10 | 97 |
| GO:003425022 | Liver | HCC | positive regulation of cellular amide metabolic process | 110/7958 | 162/18723 | 5.14e-11 | 1.92e-09 | 110 |
| GO:004225522 | Liver | HCC | ribosome assembly | 50/7958 | 61/18723 | 2.79e-10 | 9.50e-09 | 50 |
| GO:0070129 | Liver | HCC | regulation of mitochondrial translation | 19/7958 | 24/18723 | 2.80e-04 | 2.02e-03 | 19 |
| Page: 1 2 |
| Pathway ID | Tissue | Disease Stage | Description | Gene Ratio | Bg Ratio | pvalue | p.adjust | qvalue | Count |
| hsa041467 | Esophagus | ESCC | Peroxisome | 55/4205 | 82/8465 | 1.04e-03 | 3.27e-03 | 1.68e-03 | 55 |
| hsa0414612 | Esophagus | ESCC | Peroxisome | 55/4205 | 82/8465 | 1.04e-03 | 3.27e-03 | 1.68e-03 | 55 |
| hsa041464 | Liver | HCC | Peroxisome | 58/4020 | 82/8465 | 1.57e-05 | 1.05e-04 | 5.85e-05 | 58 |
| hsa041465 | Liver | HCC | Peroxisome | 58/4020 | 82/8465 | 1.57e-05 | 1.05e-04 | 5.85e-05 | 58 |
| hsa041466 | Oral cavity | OSCC | Peroxisome | 47/3704 | 82/8465 | 9.01e-03 | 2.01e-02 | 1.03e-02 | 47 |
| hsa0414611 | Oral cavity | OSCC | Peroxisome | 47/3704 | 82/8465 | 9.01e-03 | 2.01e-02 | 1.03e-02 | 47 |
| Page: 1 |
Top |
Cell-cell communication analysis |
| Identification of potential cell-cell interactions between two cell types and their ligand-receptor pairs for different disease states |
| Ligand | Receptor | LRpair | Pathway | Tissue | Disease Stage |
| Page: 1 |
Top |
Single-cell gene regulatory network inference analysis |
| Find out the significant the regulons (TFs) and the target genes of each regulon across cell types for different disease states |
| TF | Cell Type | Tissue | Disease Stage | Target Gene | RSS | Regulon Activity |
| ∗The dot plots of a searched regulon are shown for all cell subpopulations in each disease state of each tissue based on the regulon specific score inferred using pySCENIC and by calculating the average expression. |
| Page: 1 |
Top |
Somatic mutation of malignant transformation related genes |
| Annotation of somatic variants for genes involved in malignant transformation |
| Hugo Symbol | Variant Class | Variant Classification | dbSNP RS | HGVSc | HGVSp | HGVSp Short | SWISSPROT | BIOTYPE | SIFT | PolyPhen | Tumor Sample Barcode | Tissue | Histology | Sex | Age | Stage | Therapy Types | Drugs | Outcome |
| MPV17L2 | SNV | Missense_Mutation | novel | c.300N>T | p.Lys100Asn | p.K100N | Q567V2 | protein_coding | deleterious(0.01) | benign(0.141) | TCGA-AZ-4315-01 | Colorectum | colon adenocarcinoma | Male | <65 | I/II | Unknown | Unknown | SD |
| MPV17L2 | SNV | Missense_Mutation | c.206N>A | p.Gly69Asp | p.G69D | Q567V2 | protein_coding | deleterious(0) | probably_damaging(1) | TCGA-CK-4951-01 | Colorectum | colon adenocarcinoma | Female | >=65 | I/II | Unknown | Unknown | PD | |
| MPV17L2 | SNV | Missense_Mutation | c.514N>G | p.Asn172Asp | p.N172D | Q567V2 | protein_coding | deleterious(0) | probably_damaging(0.999) | TCGA-EI-6882-01 | Colorectum | rectum adenocarcinoma | Male | <65 | I/II | Unknown | Unknown | SD | |
| MPV17L2 | SNV | Missense_Mutation | novel | c.391N>A | p.Glu131Lys | p.E131K | Q567V2 | protein_coding | tolerated(0.09) | benign(0.056) | TCGA-AJ-A3TW-01 | Endometrium | uterine corpus endometrioid carcinoma | Female | >=65 | I/II | Unknown | Unknown | SD |
| MPV17L2 | SNV | Missense_Mutation | novel | c.589G>A | p.Gly197Ser | p.G197S | Q567V2 | protein_coding | tolerated(0.1) | benign(0.007) | TCGA-EO-A22U-01 | Endometrium | uterine corpus endometrioid carcinoma | Female | >=65 | I/II | Unknown | Unknown | SD |
| MPV17L2 | SNV | Missense_Mutation | c.509N>T | p.Tyr170Phe | p.Y170F | Q567V2 | protein_coding | deleterious(0) | possibly_damaging(0.532) | TCGA-55-8207-01 | Lung | lung adenocarcinoma | Male | >=65 | I/II | Unknown | Unknown | SD | |
| MPV17L2 | SNV | Missense_Mutation | c.499C>G | p.Arg167Gly | p.R167G | Q567V2 | protein_coding | deleterious(0.01) | probably_damaging(0.999) | TCGA-77-7141-01 | Lung | lung squamous cell carcinoma | Male | <65 | I/II | Unknown | Unknown | SD | |
| MPV17L2 | SNV | Missense_Mutation | rs760946540 | c.212N>A | p.Ser71Asn | p.S71N | Q567V2 | protein_coding | deleterious(0.01) | possibly_damaging(0.798) | TCGA-RD-A8N1-01 | Stomach | stomach adenocarcinoma | Male | >=65 | III/IV | Chemotherapy | 5-fluorouracil | SD |
| MPV17L2 | SNV | Missense_Mutation | novel | c.534N>T | p.Trp178Cys | p.W178C | Q567V2 | protein_coding | deleterious(0) | probably_damaging(0.998) | TCGA-VQ-A8E3-01 | Stomach | stomach adenocarcinoma | Male | >=65 | I/II | Unknown | Unknown | PD |
| MPV17L2 | insertion | Frame_Shift_Ins | rs746591385 | c.493dupC | p.Gln165ProfsTer175 | p.Q165Pfs*175 | Q567V2 | protein_coding | TCGA-HU-A4GN-01 | Stomach | stomach adenocarcinoma | Male | <65 | I/II | Chemotherapy | mitomycin | PD |
| Page: 1 2 |
Top |
Related drugs of malignant transformation related genes |
| Identification of chemicals and drugs interact with genes involved in malignant transfromation |
| (DGIdb 4.0) |
| Entrez ID | Symbol | Category | Interaction Types | Drug Claim Name | Drug Name | PMIDs |
| Page: 1 |

Copyright 2023-Present -The University of Texas Health Science Center at Houston |