
|
|||||
|
 | |
| |
| |
| |
| |
| |
|
Gene: MPPED2 |
Gene summary for MPPED2 |
| Gene information | Species | Human | Gene symbol | MPPED2 | Gene ID | 744 |
| Gene name | metallophosphoesterase domain containing 2 | |
| Gene Alias | 239FB | |
| Cytomap | 11p14.1 | |
| Gene Type | protein-coding | GO ID | GO:0000166 | UniProtAcc | Q15777 |
Top |
Malignant transformation analysis |
| Identification of the aberrant gene expression in precancerous and cancerous lesions by comparing the gene expression of stem-like cells in diseased tissues with normal stem cells |
| Entrez ID | Symbol | Replicates | Species | Organ | Tissue | Adj P-value | Log2FC | Malignancy |
| 744 | MPPED2 | AEH-subject1 | Human | Endometrium | AEH | 9.73e-08 | 3.89e-01 | -0.3059 |
| 744 | MPPED2 | AEH-subject3 | Human | Endometrium | AEH | 1.90e-13 | 5.10e-01 | -0.2576 |
| 744 | MPPED2 | AEH-subject4 | Human | Endometrium | AEH | 4.11e-13 | 5.86e-01 | -0.2657 |
| 744 | MPPED2 | AEH-subject5 | Human | Endometrium | AEH | 5.50e-43 | 9.05e-01 | -0.2953 |
| 744 | MPPED2 | EEC-subject2 | Human | Endometrium | EEC | 3.33e-02 | 2.82e-01 | -0.2607 |
| 744 | MPPED2 | EEC-subject3 | Human | Endometrium | EEC | 7.36e-03 | -1.84e-01 | -0.2525 |
| 744 | MPPED2 | EEC-subject4 | Human | Endometrium | EEC | 5.70e-04 | 3.16e-01 | -0.2571 |
| 744 | MPPED2 | EEC-subject5 | Human | Endometrium | EEC | 2.81e-05 | 3.70e-01 | -0.249 |
| 744 | MPPED2 | GSM5276934 | Human | Endometrium | EEC | 4.08e-05 | -2.54e-01 | -0.0913 |
| 744 | MPPED2 | GSM6177622_NYU_UCEC3_lib1_lib1 | Human | Endometrium | EEC | 1.28e-08 | 9.96e-02 | -0.1917 |
| 744 | MPPED2 | HCC1 | Human | Liver | HCC | 1.18e-06 | 1.87e+00 | 0.5336 |
| 744 | MPPED2 | HCC2 | Human | Liver | HCC | 4.66e-04 | 6.98e-01 | 0.5341 |
| 744 | MPPED2 | S014 | Human | Liver | HCC | 1.34e-13 | 5.26e-01 | 0.2254 |
| 744 | MPPED2 | S015 | Human | Liver | HCC | 7.91e-13 | 5.45e-01 | 0.2375 |
| 744 | MPPED2 | S016 | Human | Liver | HCC | 3.16e-19 | 5.77e-01 | 0.2243 |
| 744 | MPPED2 | GSM5252130_BPH340PrGF_Via | Human | Prostate | BPH | 2.12e-02 | -1.51e-01 | -0.1972 |
| 744 | MPPED2 | 047563_1562-all-cells | Human | Prostate | BPH | 1.12e-04 | -1.22e-01 | 0.0791 |
| 744 | MPPED2 | 052095_1628-all-cells | Human | Prostate | BPH | 1.13e-03 | 3.08e-01 | 0.1032 |
| 744 | MPPED2 | Dong_P1 | Human | Prostate | Tumor | 1.24e-05 | -1.03e-01 | 0.035 |
| 744 | MPPED2 | Dong_P3 | Human | Prostate | Tumor | 6.28e-26 | 3.67e-01 | 0.0278 |
| Page: 1 2 |
| Tissue | Expression Dynamics | Abbreviation |
| Endometrium | 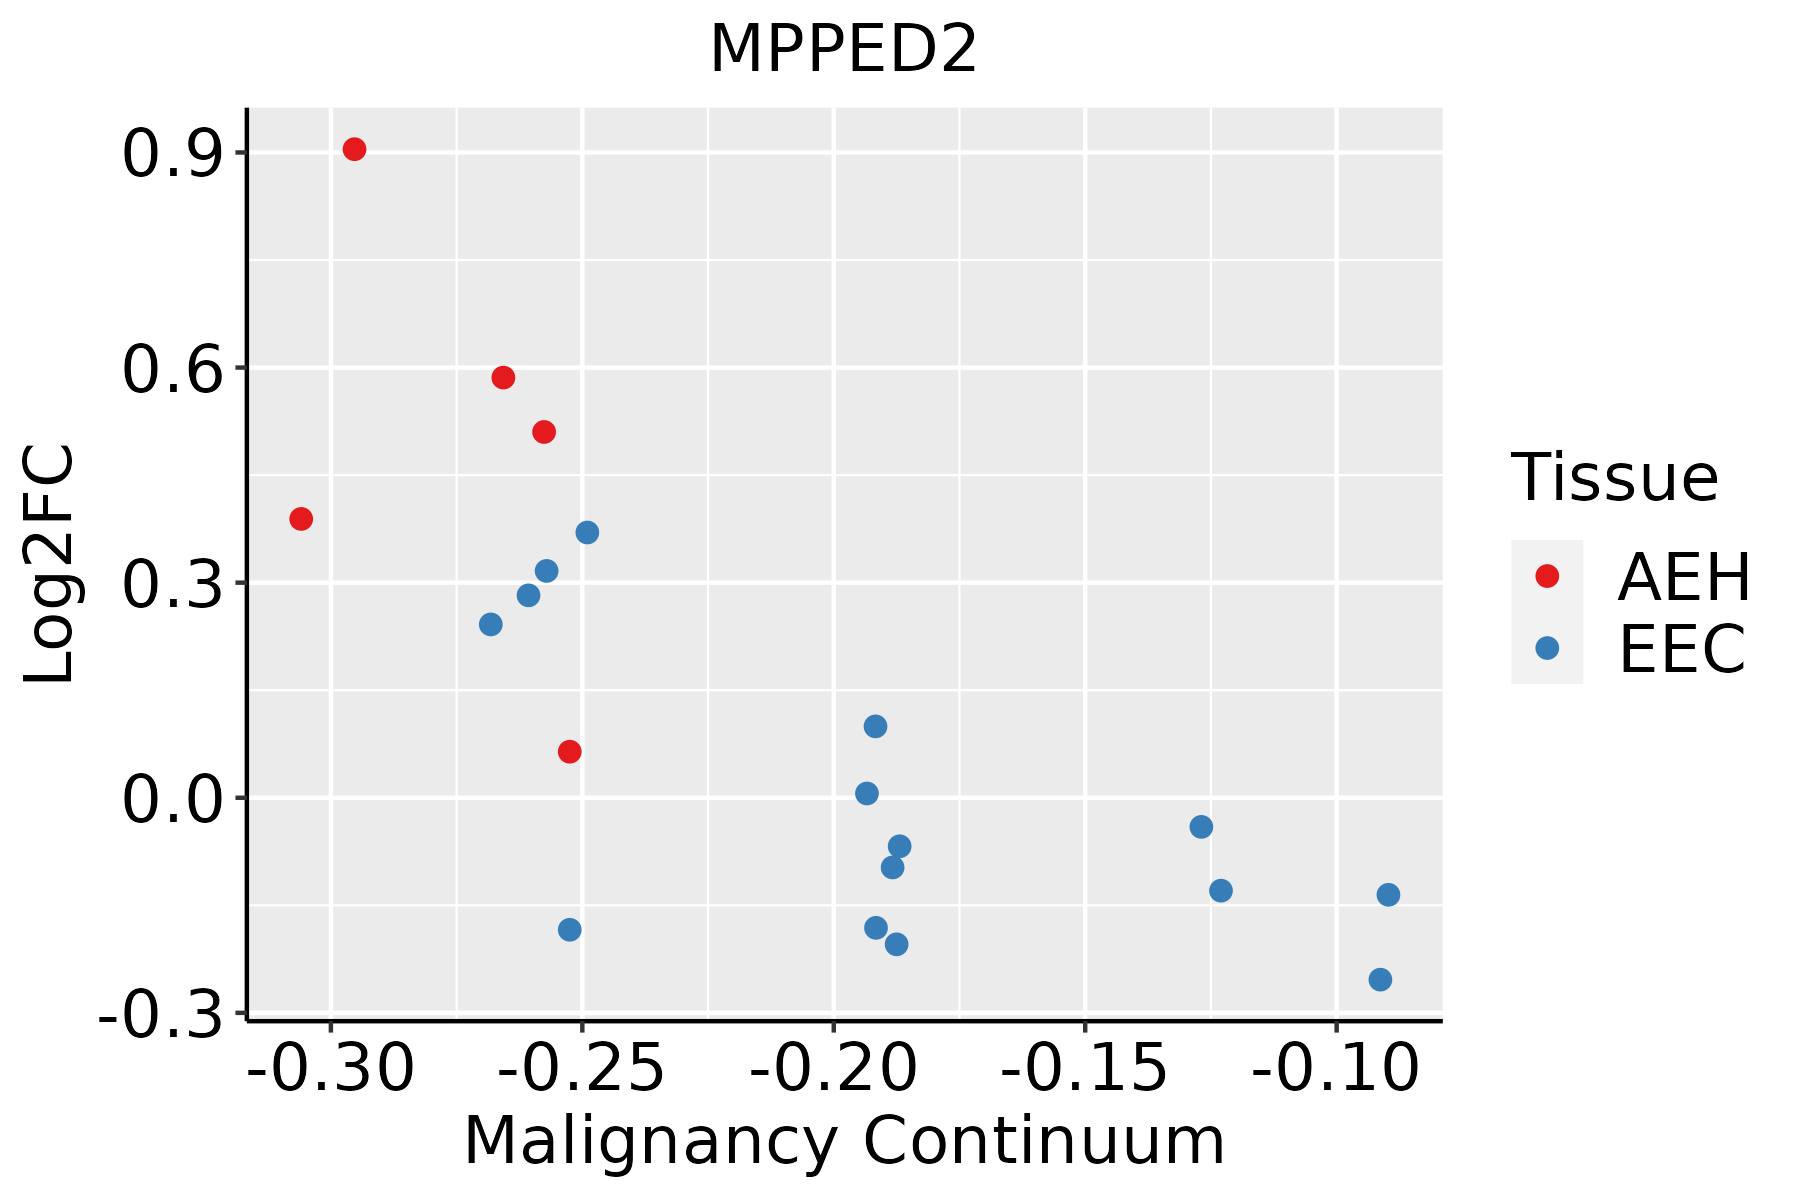 | AEH: Atypical endometrial hyperplasia |
| EEC: Endometrioid Cancer | ||
| Liver |  | HCC: Hepatocellular carcinoma |
| NAFLD: Non-alcoholic fatty liver disease | ||
| Prostate |  | BPH: Benign Prostatic Hyperplasia |
| Thyroid | 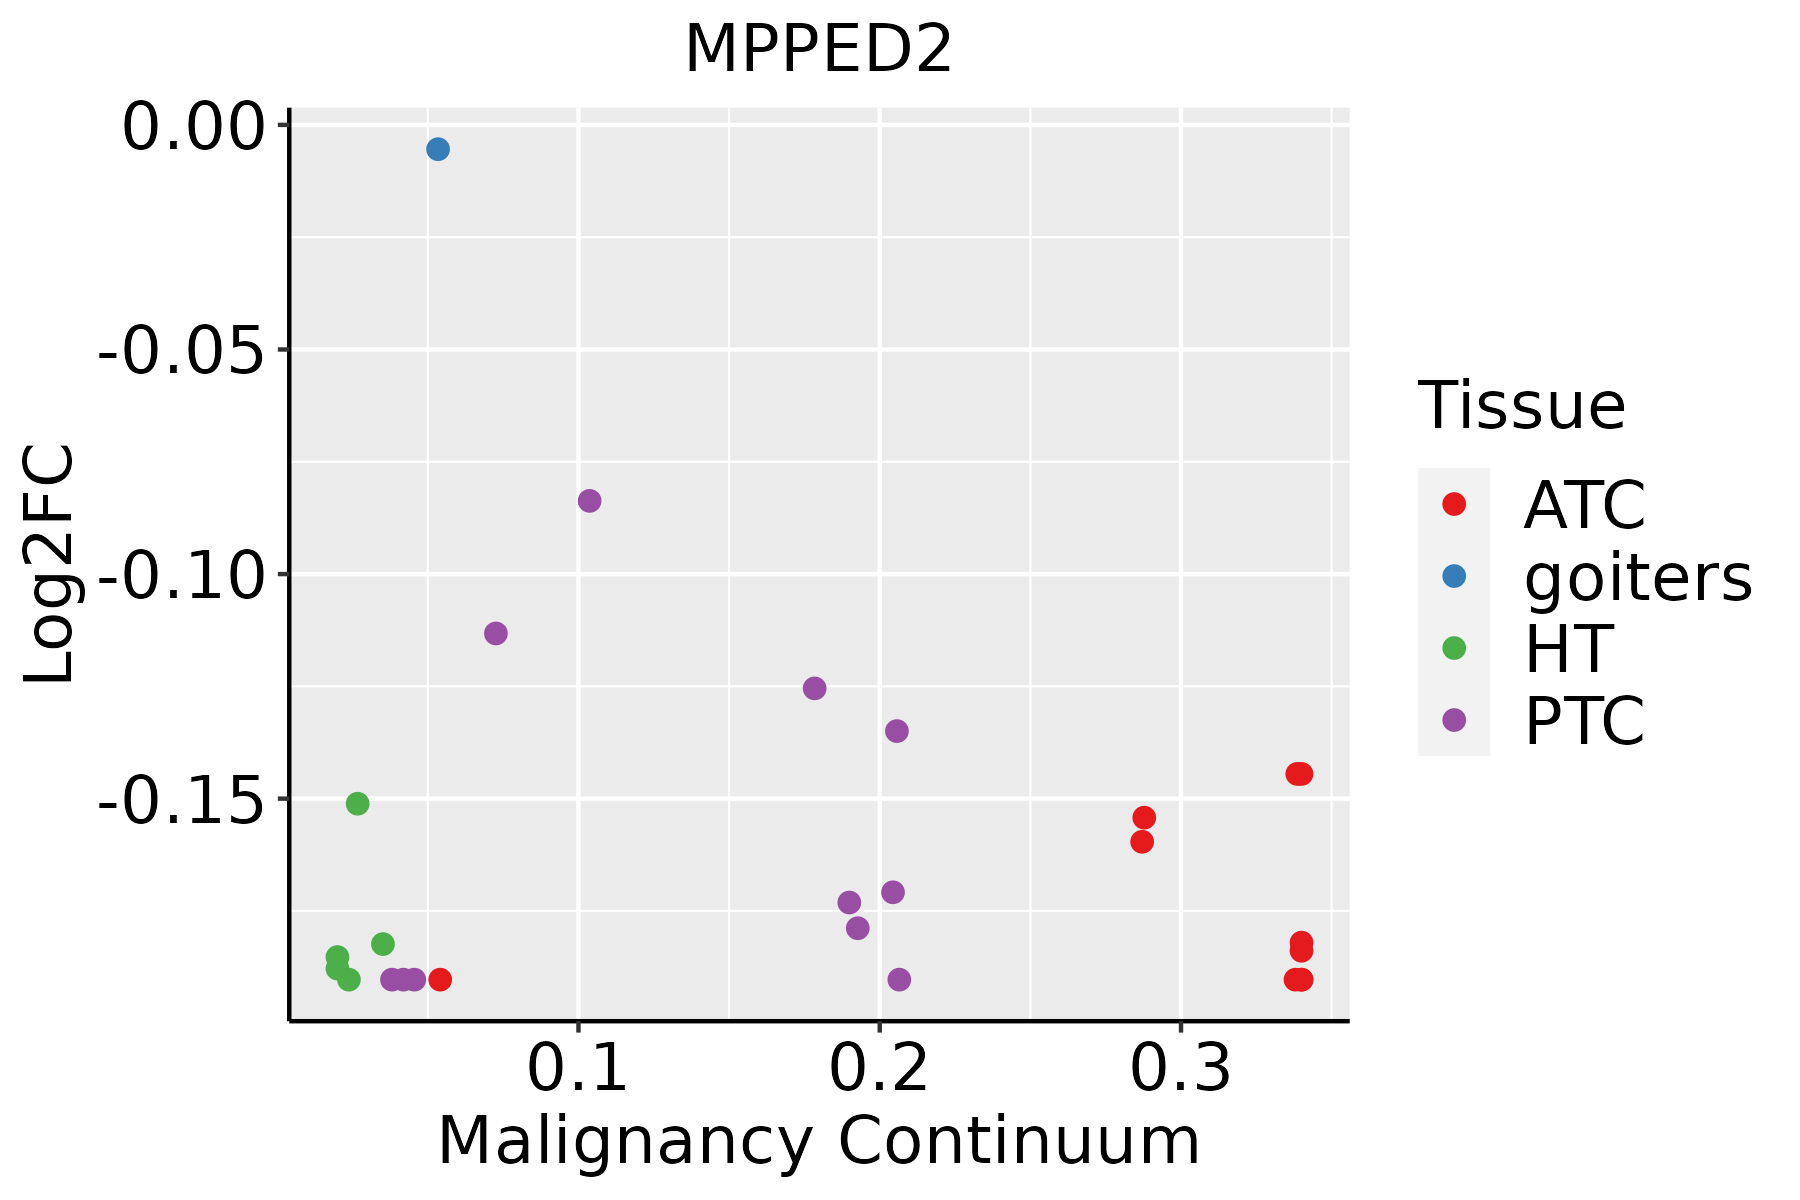 | ATC: Anaplastic thyroid cancer |
| HT: Hashimoto's thyroiditis | ||
| PTC: Papillary thyroid cancer |
| ∗log2FC in expression of this searched gene in stem-like cells from each diseased tissue sample relative to stem-like cells in normal samples in each tissue plotted against the malignancy continuum. Samples are colored based on if they are from different disease stage. |
Top |
Malignant transformation related pathway analysis |
| Find out the enriched GO biological processes and KEGG pathways involved in transition from healthy to precancer to cancer |
| Tissue | Disease Stage | Enriched GO biological Processes |
| Colorectum | AD |  |
| Colorectum | SER |  |
| Colorectum | MSS |  |
| Colorectum | MSI-H |  |
| Colorectum | FAP |  |
| ∗Top 15 enriched GO BP terms are showed in the bar plot of each disease state in each tissue. Each row represents a significant GO biological process which is colored according to the -log10(p.adjust). |
| Page: 1 2 3 4 5 6 7 8 9 |
| GO ID | Tissue | Disease Stage | Description | Gene Ratio | Bg Ratio | pvalue | p.adjust | Count |
| Page: 1 |
| Pathway ID | Tissue | Disease Stage | Description | Gene Ratio | Bg Ratio | pvalue | p.adjust | qvalue | Count |
| Page: 1 |
Top |
Cell-cell communication analysis |
| Identification of potential cell-cell interactions between two cell types and their ligand-receptor pairs for different disease states |
| Ligand | Receptor | LRpair | Pathway | Tissue | Disease Stage |
| Page: 1 |
Top |
Single-cell gene regulatory network inference analysis |
| Find out the significant the regulons (TFs) and the target genes of each regulon across cell types for different disease states |
| TF | Cell Type | Tissue | Disease Stage | Target Gene | RSS | Regulon Activity |
| ∗The dot plots of a searched regulon are shown for all cell subpopulations in each disease state of each tissue based on the regulon specific score inferred using pySCENIC and by calculating the average expression. |
| Page: 1 |
Top |
Somatic mutation of malignant transformation related genes |
| Annotation of somatic variants for genes involved in malignant transformation |
| Hugo Symbol | Variant Class | Variant Classification | dbSNP RS | HGVSc | HGVSp | HGVSp Short | SWISSPROT | BIOTYPE | SIFT | PolyPhen | Tumor Sample Barcode | Tissue | Histology | Sex | Age | Stage | Therapy Types | Drugs | Outcome |
| MPPED2 | SNV | Missense_Mutation | rs749984720 | c.314N>C | p.Asn105Thr | p.N105T | Q15777 | protein_coding | tolerated(0.75) | benign(0) | TCGA-A2-A0CS-01 | Breast | breast invasive carcinoma | Female | >=65 | III/IV | Hormone Therapy | anastrozole | SD |
| MPPED2 | SNV | Missense_Mutation | c.385G>A | p.Asp129Asn | p.D129N | Q15777 | protein_coding | tolerated(0.27) | possibly_damaging(0.616) | TCGA-AC-A23H-01 | Breast | breast invasive carcinoma | Female | >=65 | I/II | Unknown | Unknown | PD | |
| MPPED2 | SNV | Missense_Mutation | novel | c.326N>G | p.Glu109Gly | p.E109G | Q15777 | protein_coding | tolerated(0.07) | benign(0.031) | TCGA-AN-A046-01 | Breast | breast invasive carcinoma | Female | >=65 | I/II | Unknown | Unknown | SD |
| MPPED2 | SNV | Missense_Mutation | rs749984720 | c.314N>C | p.Asn105Thr | p.N105T | Q15777 | protein_coding | tolerated(0.75) | benign(0) | TCGA-C8-A1HO-01 | Breast | breast invasive carcinoma | Female | <65 | III/IV | Chemotherapy | 5-fluorouracil | CR |
| MPPED2 | SNV | Missense_Mutation | rs370487633 | c.784G>A | p.Asp262Asn | p.D262N | Q15777 | protein_coding | deleterious(0.03) | possibly_damaging(0.557) | TCGA-E2-A1AZ-01 | Breast | breast invasive carcinoma | Female | <65 | I/II | Chemotherapy | adriamycin | SD |
| MPPED2 | SNV | Missense_Mutation | novel | c.272N>A | p.Gly91Glu | p.G91E | Q15777 | protein_coding | deleterious(0.02) | probably_damaging(0.998) | TCGA-OL-A5D6-01 | Breast | breast invasive carcinoma | Female | >=65 | I/II | Unknown | Unknown | SD |
| MPPED2 | insertion | Frame_Shift_Ins | novel | c.129_130insT | p.Val44CysfsTer7 | p.V44Cfs*7 | Q15777 | protein_coding | TCGA-A8-A07U-01 | Breast | breast invasive carcinoma | Female | >=65 | III/IV | Chemotherapy | 5-fluorouracil | SD | ||
| MPPED2 | insertion | Frame_Shift_Ins | novel | c.149_150insGT | p.Asp50GlufsTer55 | p.D50Efs*55 | Q15777 | protein_coding | TCGA-BH-A0BR-01 | Breast | breast invasive carcinoma | Female | <65 | I/II | Unknown | Unknown | SD | ||
| MPPED2 | SNV | Missense_Mutation | c.389N>C | p.Leu130Pro | p.L130P | Q15777 | protein_coding | tolerated(0.07) | probably_damaging(1) | TCGA-FU-A3HZ-01 | Cervix | cervical & endocervical cancer | Female | <65 | I/II | Chemotherapy | cisplatin | CR | |
| MPPED2 | SNV | Missense_Mutation | c.559G>T | p.Gly187Cys | p.G187C | Q15777 | protein_coding | deleterious(0) | probably_damaging(0.965) | TCGA-A6-2686-01 | Colorectum | colon adenocarcinoma | Female | >=65 | I/II | Unknown | Unknown | SD |
| Page: 1 2 3 4 5 6 7 |
Top |
Related drugs of malignant transformation related genes |
| Identification of chemicals and drugs interact with genes involved in malignant transfromation |
| (DGIdb 4.0) |
| Entrez ID | Symbol | Category | Interaction Types | Drug Claim Name | Drug Name | PMIDs |
| Page: 1 |

Copyright 2023-Present -The University of Texas Health Science Center at Houston |