Schematic overview of the cellular and molecular mechanisms involved in the cancer progression, including the proposed cellular and molecular mechanisms in cancer cells trajectory. AT1: alveolar type 1 cells; AT2: alveolar type 2 cells; AAH: atypical adenomatous hyperplasia; AIS: adenocarcinoma in situ; MIA: minimally invasive adenocarcinoma; IA: invasive adenocarcinoma; EMT: epithelial-mesenchymal transition

Home

Download

Statistics

Help

Contact

Center for Computational Systems Medicine
leaf

Gene summary

leaf

Malignant transformation analysis

leaf

Malignant transformation related pathway analysis

leaf

Cell-cell communication analysis

leaf

Single-cell gene regulatory network inference analysis

leaf

Somatic mutation of malignant transformation related genes

leaf

Related drugs of malignant transformation related genes

Gene: MPP7

Gene summary for MPP7

check button Gene summary.

Gene informationSpeciesHuman
Gene symbol

MPP7

Gene ID

143098

Gene namemembrane palmitoylated protein 7
Gene AliasMPP7
Cytomap10p12.1
Gene Typeprotein-coding
GO ID

GO:0007043

UniProtAcc

Q5T2T1


Top

Malignant transformation analysis

check button Identification of the aberrant gene expression in precancerous and cancerous lesions by comparing the gene expression of stem-like cells in diseased tissues with normal stem cells
check button Malignant transformation involving gene list.
Entrez IDSymbolReplicatesSpeciesOrganTissueAdj P-valueLog2FCMalignancy
143098MPP7LZE4THumanEsophagusESCC2.43e-037.18e-020.0811
143098MPP7LZE24THumanEsophagusESCC2.24e-105.02e-010.0596
143098MPP7P2T-EHumanEsophagusESCC1.42e-03-9.30e-030.1177
143098MPP7P4T-EHumanEsophagusESCC1.31e-077.31e-020.1323
143098MPP7P5T-EHumanEsophagusESCC1.09e-043.38e-020.1327
143098MPP7P9T-EHumanEsophagusESCC9.41e-078.59e-020.1131
143098MPP7P11T-EHumanEsophagusESCC4.72e-063.19e-010.1426
143098MPP7P12T-EHumanEsophagusESCC7.63e-043.61e-020.1122
143098MPP7P15T-EHumanEsophagusESCC4.97e-051.12e-020.1149
143098MPP7P16T-EHumanEsophagusESCC3.12e-081.12e-010.1153
143098MPP7P21T-EHumanEsophagusESCC3.64e-101.01e-010.1617
143098MPP7P23T-EHumanEsophagusESCC7.89e-034.88e-020.108
143098MPP7P26T-EHumanEsophagusESCC2.63e-102.41e-010.1276
143098MPP7P27T-EHumanEsophagusESCC5.85e-142.37e-010.1055
143098MPP7P28T-EHumanEsophagusESCC3.30e-125.43e-020.1149
143098MPP7P30T-EHumanEsophagusESCC3.54e-112.98e-010.137
143098MPP7P32T-EHumanEsophagusESCC1.57e-048.43e-020.1666
143098MPP7P36T-EHumanEsophagusESCC3.49e-089.89e-020.1187
143098MPP7P37T-EHumanEsophagusESCC2.77e-091.87e-010.1371
143098MPP7P39T-EHumanEsophagusESCC1.94e-032.50e-020.0894
Page: 1 2 3 4 

check button Transcriptomic changes along malignancy continuum.
TissueExpression DynamicsAbbreviation
EsophagusThe image shows the transcriptomic changes along malignancy continuum.log2FC in expression of this searched gene in stem-like cells from each diseased tissue sample relative to stem-like cells in normal samples in each tissue plotted against the malignancy continuum. Samples are colored based on if they are from different disease stage.
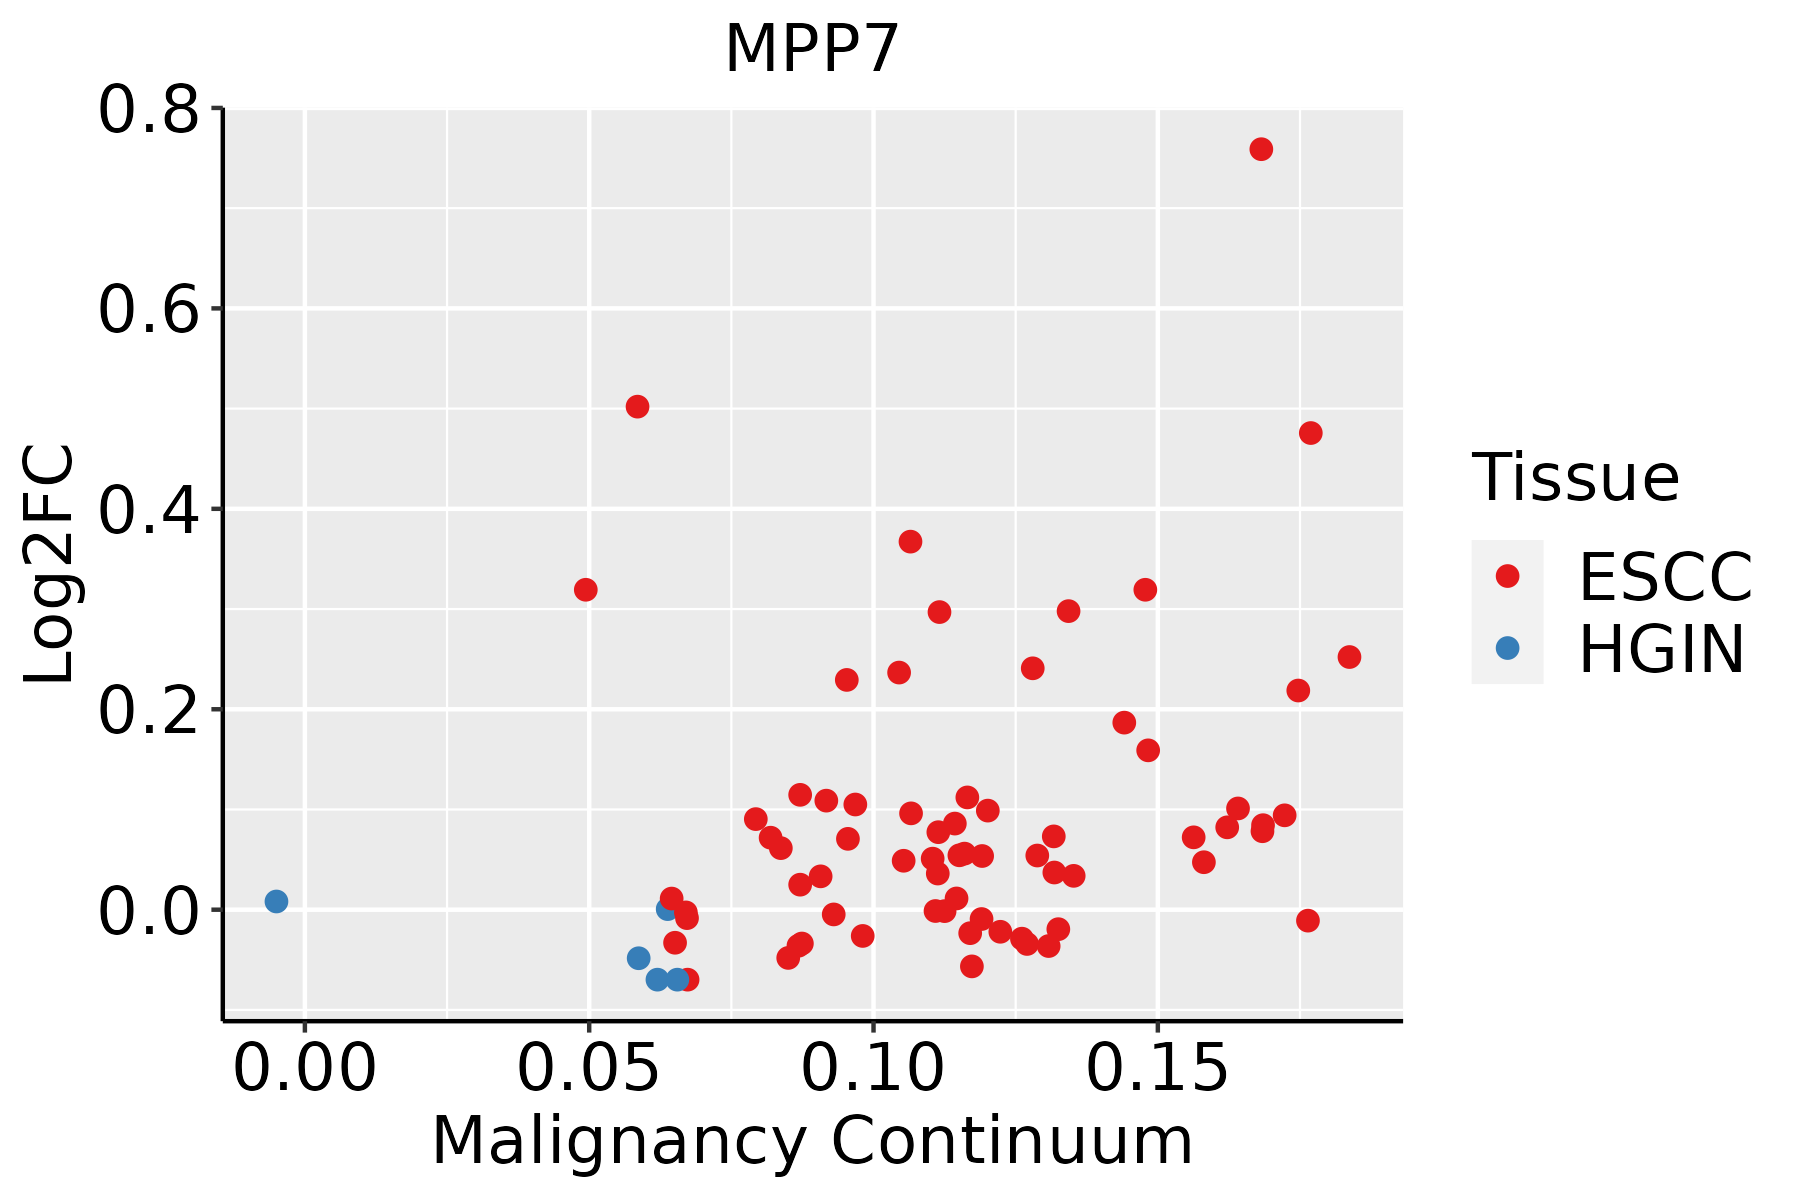
ESCC: Esophageal squamous cell carcinoma
HGIN: High-grade intraepithelial neoplasias
LGIN: Low-grade intraepithelial neoplasias
LiverThe image shows the transcriptomic changes along malignancy continuum.log2FC in expression of this searched gene in stem-like cells from each diseased tissue sample relative to stem-like cells in normal samples in each tissue plotted against the malignancy continuum. Samples are colored based on if they are from different disease stage.
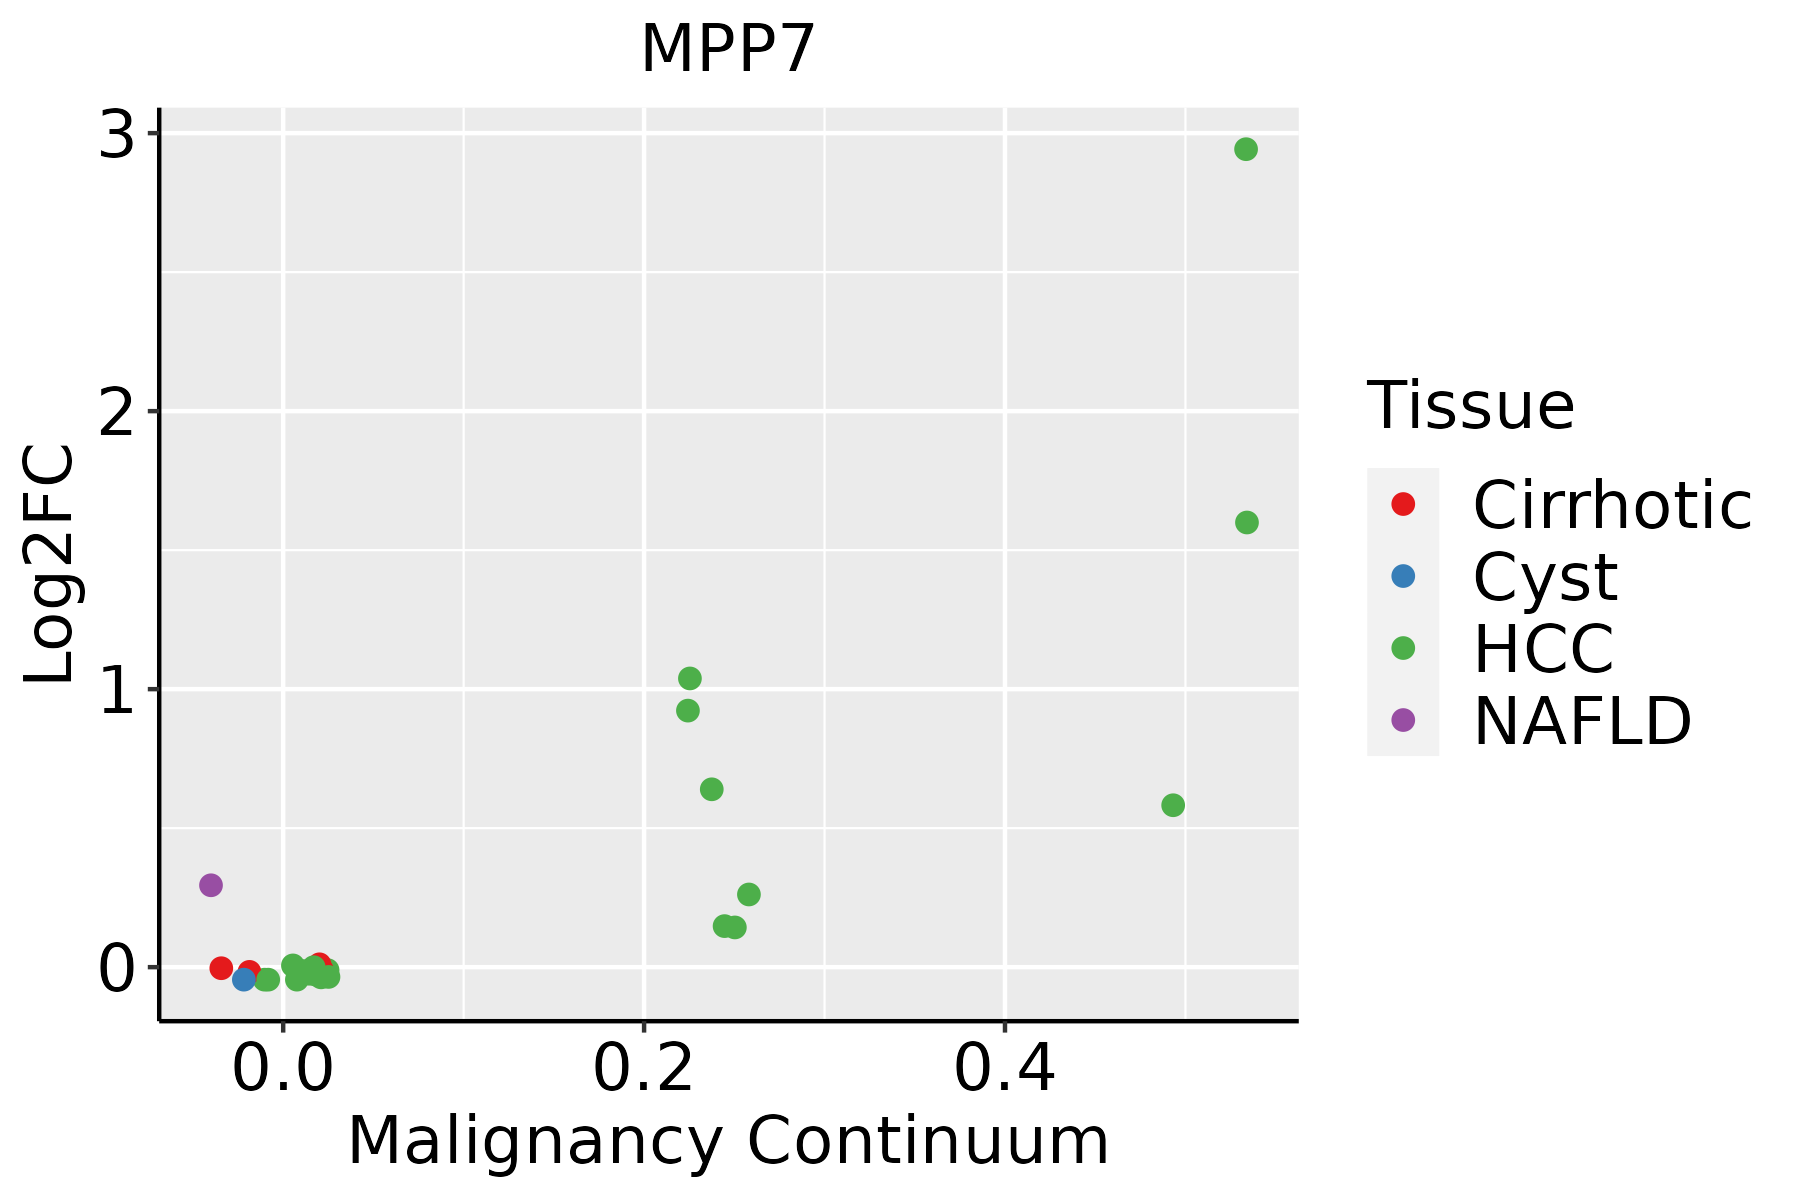
HCC: Hepatocellular carcinoma
NAFLD: Non-alcoholic fatty liver disease
LungThe image shows the transcriptomic changes along malignancy continuum.log2FC in expression of this searched gene in stem-like cells from each diseased tissue sample relative to stem-like cells in normal samples in each tissue plotted against the malignancy continuum. Samples are colored based on if they are from different disease stage.AAH: Atypical adenomatous hyperplasia
AIS: Adenocarcinoma in situ
IAC: Invasive lung adenocarcinoma
MIA: Minimally invasive adenocarcinoma
ThyroidThe image shows the transcriptomic changes along malignancy continuum.log2FC in expression of this searched gene in stem-like cells from each diseased tissue sample relative to stem-like cells in normal samples in each tissue plotted against the malignancy continuum. Samples are colored based on if they are from different disease stage.ATC: Anaplastic thyroid cancer
HT: Hashimoto's thyroiditis
PTC: Papillary thyroid cancer
∗log2FC in expression of this searched gene in stem-like cells from each diseased tissue sample relative to stem-like cells in normal samples in each tissue plotted against the malignancy continuum. Samples are colored based on if they are from different disease stage.

Top

Malignant transformation related pathway analysis

check buttonFind out the enriched GO biological processes and KEGG pathways involved in transition from healthy to precancer to cancer
check button Figure of enriched GO biological processes.
TissueDisease StageEnriched GO biological Processes
ColorectumADGO analysis - Figure of enriched GO biological processes: Top 15 enriched GO BP terms are showed in the bar plot of each disease state in each tissue. Each row represents a significant GO biological process which is colored according to the -log10(p.adjust).
ColorectumSERGO analysis - Figure of enriched GO biological processes: Top 15 enriched GO BP terms are showed in the bar plot of each disease state in each tissue. Each row represents a significant GO biological process which is colored according to the -log10(p.adjust).
ColorectumMSSGO analysis - Figure of enriched GO biological processes: Top 15 enriched GO BP terms are showed in the bar plot of each disease state in each tissue. Each row represents a significant GO biological process which is colored according to the -log10(p.adjust).
ColorectumMSI-HGO analysis - Figure of enriched GO biological processes: Top 15 enriched GO BP terms are showed in the bar plot of each disease state in each tissue. Each row represents a significant GO biological process which is colored according to the -log10(p.adjust).
ColorectumFAPGO analysis - Figure of enriched GO biological processes: Top 15 enriched GO BP terms are showed in the bar plot of each disease state in each tissue. Each row represents a significant GO biological process which is colored according to the -log10(p.adjust).
∗Top 15 enriched GO BP terms are showed in the bar plot of each disease state in each tissue. Each row represents a significant GO biological process which is colored according to the -log10(p.adjust).
Page: 1 2 3 4 5 6 7 8 9 

check button Enriched GO biological processes.
GO IDTissueDisease StageDescriptionGene RatioBg Ratiopvaluep.adjustCount
GO:0043254111EsophagusESCCregulation of protein-containing complex assembly278/8552428/187233.81e-162.77e-14278
GO:0031334111EsophagusESCCpositive regulation of protein-containing complex assembly166/8552237/187232.06e-141.07e-12166
GO:000716320EsophagusESCCestablishment or maintenance of cell polarity143/8552218/187232.05e-094.65e-08143
GO:003001018EsophagusESCCestablishment of cell polarity96/8552143/187231.69e-072.67e-0696
GO:003432918EsophagusESCCcell junction assembly227/8552420/187233.06e-041.83e-03227
GO:004521620EsophagusESCCcell-cell junction organization114/8552200/187238.04e-044.16e-03114
GO:004329718EsophagusESCCapical junction assembly48/855278/187233.45e-031.41e-0248
GO:015010510EsophagusESCCprotein localization to cell-cell junction16/855221/187234.47e-031.76e-0216
GO:004325422LiverHCCregulation of protein-containing complex assembly264/7958428/187235.47e-164.39e-14264
GO:003133412LiverHCCpositive regulation of protein-containing complex assembly150/7958237/187237.35e-112.63e-09150
GO:000716322LiverHCCestablishment or maintenance of cell polarity133/7958218/187232.48e-085.73e-07133
GO:003001022LiverHCCestablishment of cell polarity82/7958143/187232.38e-041.79e-0382
GO:015010511LiverHCCprotein localization to cell-cell junction17/795821/187233.71e-042.56e-0317
GO:004521622LiverHCCcell-cell junction organization107/7958200/187231.06e-036.11e-03107
GO:004329712LiverHCCapical junction assembly45/795878/187234.83e-032.03e-0245
GO:01201935LiverHCCtight junction organization45/795880/187239.02e-033.48e-0245
GO:01201925LiverHCCtight junction assembly42/795874/187239.32e-033.57e-0242
GO:000704312LiverHCCcell-cell junction assembly76/7958146/187231.23e-024.47e-0276
GO:00071637LungIACestablishment or maintenance of cell polarity61/2061218/187233.10e-123.07e-0961
GO:00300107LungIACestablishment of cell polarity46/2061143/187237.70e-124.27e-0946
Page: 1 2 3 4 

check button Enriched KEGG pathways.
Pathway IDTissueDisease StageDescriptionGene RatioBg Ratiopvaluep.adjustqvalueCount
Page: 1 

Top

Cell-cell communication analysis

check buttonIdentification of potential cell-cell interactions between two cell types and their ligand-receptor pairs for different disease states
LigandReceptorLRpairPathwayTissueDisease Stage
Page: 1 

Top

Single-cell gene regulatory network inference analysis

check buttonFind out the significant the regulons (TFs) and the target genes of each regulon across cell types for different disease states
TFCell TypeTissueDisease StageTarget GeneRSSRegulon Activity
∗The dot plots of a searched regulon are shown for all cell subpopulations in each disease state of each tissue based on the regulon specific score inferred using pySCENIC and by calculating the average expression.
Page: 1 

Top

Somatic mutation of malignant transformation related genes

check buttonAnnotation of somatic variants for genes involved in malignant transformation
Hugo SymbolVariant ClassVariant ClassificationdbSNP RSHGVScHGVSpHGVSp ShortSWISSPROTBIOTYPESIFTPolyPhenTumor Sample BarcodeTissueHistologySexAgeStageTherapy TypesDrugsOutcome
MPP7SNVMissense_Mutationc.665N>Gp.Glu222Glyp.E222GQ5T2T1protein_codingtolerated(0.1)possibly_damaging(0.77)TCGA-A8-A08P-01Breastbreast invasive carcinomaFemale>=65III/IVChemotherapy5-fluorouracilCR
MPP7SNVMissense_Mutationrs376428625c.378N>Ap.Met126Ilep.M126IQ5T2T1protein_codingtolerated(0.45)benign(0)TCGA-A8-A09Z-01Breastbreast invasive carcinomaFemale>=65I/IIUnknownUnknownSD
MPP7SNVMissense_Mutationc.298N>Cp.Ser100Prop.S100PQ5T2T1protein_codingdeleterious(0.01)possibly_damaging(0.707)TCGA-B6-A0I5-01Breastbreast invasive carcinomaFemale<65I/IIUnknownUnknownSD
MPP7SNVMissense_Mutationnovelc.824C>Gp.Ala275Glyp.A275GQ5T2T1protein_codingdeleterious(0)probably_damaging(0.999)TCGA-B6-A400-01Breastbreast invasive carcinomaFemale<65III/IVUnknownUnknownSD
MPP7SNVMissense_Mutationc.980N>Cp.Ser327Thrp.S327TQ5T2T1protein_codingdeleterious(0.05)possibly_damaging(0.468)TCGA-EW-A1P4-01Breastbreast invasive carcinomaFemale<65I/IIChemotherapydocetaxelSD
MPP7SNVMissense_Mutationnovelc.163G>Ap.Glu55Lysp.E55KQ5T2T1protein_codingtolerated(0.06)probably_damaging(0.982)TCGA-LD-A74U-01Breastbreast invasive carcinomaFemale>=65III/IVChemotherapytaxotereSD
MPP7insertionIn_Frame_Insnovelc.1054_1055insTAGCATCTATCTTGTGCAp.Pro352delinsLeuAlaSerIleLeuCysThrp.P352delinsLASILCTQ5T2T1protein_codingTCGA-AO-A0JD-01Breastbreast invasive carcinomaFemale<65III/IVChemotherapycyclophosphamideSD
MPP7SNVMissense_Mutationrs142463330c.241G>Ap.Glu81Lysp.E81KQ5T2T1protein_codingdeleterious(0)possibly_damaging(0.597)TCGA-EA-A3HS-01Cervixcervical & endocervical cancerFemale<65I/IIUnknownUnknownSD
MPP7SNVMissense_Mutationnovelc.993N>Cp.Lys331Asnp.K331NQ5T2T1protein_codingtolerated(0.1)benign(0.131)TCGA-IR-A3LI-01Cervixcervical & endocervical cancerFemale<65I/IIChemotherapycisplatinCR
MPP7SNVMissense_Mutationrs775616676c.905N>Ap.Arg302Glnp.R302QQ5T2T1protein_codingtolerated(0.15)benign(0.018)TCGA-JX-A3Q0-01Cervixcervical & endocervical cancerFemale<65III/IVUnknownUnknownSD
Page: 1 2 3 4 5 6 

Top

Related drugs of malignant transformation related genes

check buttonIdentification of chemicals and drugs interact with genes involved in malignant transfromation
(DGIdb 4.0)
Entrez IDSymbolCategoryInteraction TypesDrug Claim NameDrug NamePMIDs
Page: 1