
|
|||||
|
 | |
| |
| |
| |
| |
| |
|
Gene: MPP5 |
Gene summary for MPP5 |
| Gene information | Species | Human | Gene symbol | MPP5 | Gene ID | 64398 |
| Gene name | protein associated with LIN7 1, MAGUK family member | |
| Gene Alias | MPP5 | |
| Cytomap | 14q23.3 | |
| Gene Type | protein-coding | GO ID | GO:0002009 | UniProtAcc | Q8N3R9 |
Top |
Malignant transformation analysis |
| Identification of the aberrant gene expression in precancerous and cancerous lesions by comparing the gene expression of stem-like cells in diseased tissues with normal stem cells |
| Entrez ID | Symbol | Replicates | Species | Organ | Tissue | Adj P-value | Log2FC | Malignancy |
| 64398 | MPP5 | LZE4T | Human | Esophagus | ESCC | 5.59e-04 | 2.33e-01 | 0.0811 |
| 64398 | MPP5 | LZE5T | Human | Esophagus | ESCC | 8.79e-04 | 3.65e-01 | 0.0514 |
| 64398 | MPP5 | LZE7T | Human | Esophagus | ESCC | 1.61e-04 | 1.38e-01 | 0.0667 |
| 64398 | MPP5 | LZE20T | Human | Esophagus | ESCC | 1.76e-06 | 2.06e-01 | 0.0662 |
| 64398 | MPP5 | LZE24T | Human | Esophagus | ESCC | 3.08e-08 | 2.42e-01 | 0.0596 |
| 64398 | MPP5 | P1T-E | Human | Esophagus | ESCC | 1.08e-03 | 2.20e-01 | 0.0875 |
| 64398 | MPP5 | P2T-E | Human | Esophagus | ESCC | 9.02e-10 | 2.12e-01 | 0.1177 |
| 64398 | MPP5 | P4T-E | Human | Esophagus | ESCC | 1.92e-18 | 4.43e-01 | 0.1323 |
| 64398 | MPP5 | P5T-E | Human | Esophagus | ESCC | 1.65e-05 | 9.67e-02 | 0.1327 |
| 64398 | MPP5 | P8T-E | Human | Esophagus | ESCC | 7.73e-21 | 2.92e-01 | 0.0889 |
| 64398 | MPP5 | P9T-E | Human | Esophagus | ESCC | 1.31e-05 | 8.05e-02 | 0.1131 |
| 64398 | MPP5 | P10T-E | Human | Esophagus | ESCC | 1.20e-12 | 2.43e-01 | 0.116 |
| 64398 | MPP5 | P11T-E | Human | Esophagus | ESCC | 2.90e-04 | 3.01e-01 | 0.1426 |
| 64398 | MPP5 | P12T-E | Human | Esophagus | ESCC | 3.61e-12 | 2.31e-01 | 0.1122 |
| 64398 | MPP5 | P15T-E | Human | Esophagus | ESCC | 8.16e-20 | 4.64e-01 | 0.1149 |
| 64398 | MPP5 | P16T-E | Human | Esophagus | ESCC | 2.38e-09 | 1.32e-01 | 0.1153 |
| 64398 | MPP5 | P17T-E | Human | Esophagus | ESCC | 1.50e-02 | 1.15e-01 | 0.1278 |
| 64398 | MPP5 | P19T-E | Human | Esophagus | ESCC | 8.51e-04 | 2.07e-01 | 0.1662 |
| 64398 | MPP5 | P20T-E | Human | Esophagus | ESCC | 1.99e-11 | 2.49e-01 | 0.1124 |
| 64398 | MPP5 | P21T-E | Human | Esophagus | ESCC | 3.91e-07 | 1.88e-01 | 0.1617 |
| Page: 1 2 3 |
| Tissue | Expression Dynamics | Abbreviation |
| Esophagus | 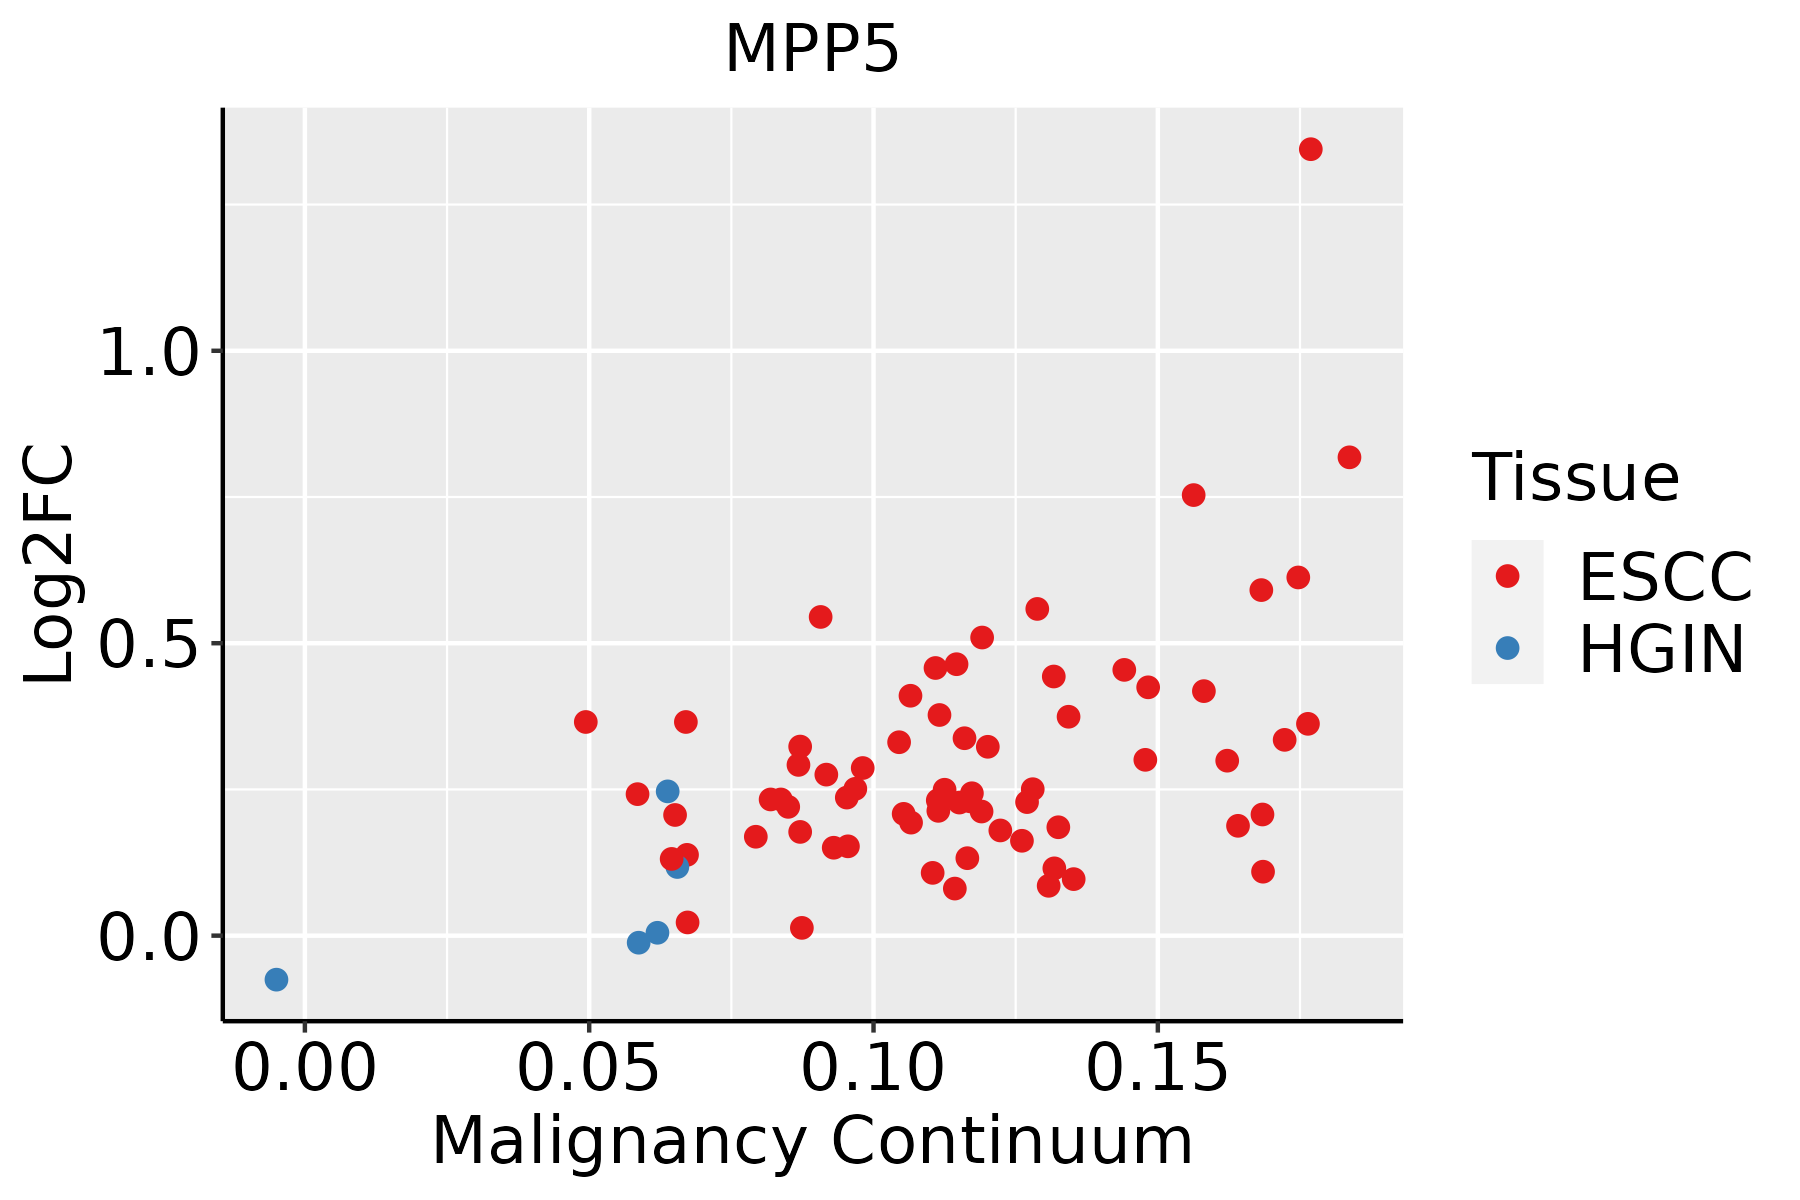 | ESCC: Esophageal squamous cell carcinoma |
| HGIN: High-grade intraepithelial neoplasias | ||
| LGIN: Low-grade intraepithelial neoplasias |
| ∗log2FC in expression of this searched gene in stem-like cells from each diseased tissue sample relative to stem-like cells in normal samples in each tissue plotted against the malignancy continuum. Samples are colored based on if they are from different disease stage. |
Top |
Malignant transformation related pathway analysis |
| Find out the enriched GO biological processes and KEGG pathways involved in transition from healthy to precancer to cancer |
| Tissue | Disease Stage | Enriched GO biological Processes |
| Colorectum | AD |  |
| Colorectum | SER |  |
| Colorectum | MSS |  |
| Colorectum | MSI-H |  |
| Colorectum | FAP |  |
| ∗Top 15 enriched GO BP terms are showed in the bar plot of each disease state in each tissue. Each row represents a significant GO biological process which is colored according to the -log10(p.adjust). |
| Page: 1 2 3 4 5 6 7 8 9 |
| GO ID | Tissue | Disease Stage | Description | Gene Ratio | Bg Ratio | pvalue | p.adjust | Count |
| Page: 1 |
| Pathway ID | Tissue | Disease Stage | Description | Gene Ratio | Bg Ratio | pvalue | p.adjust | qvalue | Count |
| Page: 1 |
Top |
Cell-cell communication analysis |
| Identification of potential cell-cell interactions between two cell types and their ligand-receptor pairs for different disease states |
| Ligand | Receptor | LRpair | Pathway | Tissue | Disease Stage |
| Page: 1 |
Top |
Single-cell gene regulatory network inference analysis |
| Find out the significant the regulons (TFs) and the target genes of each regulon across cell types for different disease states |
| TF | Cell Type | Tissue | Disease Stage | Target Gene | RSS | Regulon Activity |
| ∗The dot plots of a searched regulon are shown for all cell subpopulations in each disease state of each tissue based on the regulon specific score inferred using pySCENIC and by calculating the average expression. |
| Page: 1 |
Top |
Somatic mutation of malignant transformation related genes |
| Annotation of somatic variants for genes involved in malignant transformation |
| Hugo Symbol | Variant Class | Variant Classification | dbSNP RS | HGVSc | HGVSp | HGVSp Short | SWISSPROT | BIOTYPE | SIFT | PolyPhen | Tumor Sample Barcode | Tissue | Histology | Sex | Age | Stage | Therapy Types | Drugs | Outcome |
| MPP5 | SNV | Missense_Mutation | c.1816N>T | p.Arg606Trp | p.R606W | Q8N3R9 | protein_coding | deleterious(0) | possibly_damaging(0.582) | TCGA-AN-A046-01 | Breast | breast invasive carcinoma | Female | >=65 | I/II | Unknown | Unknown | SD | |
| MPP5 | SNV | Missense_Mutation | c.1363N>C | p.Asn455His | p.N455H | Q8N3R9 | protein_coding | deleterious(0.01) | possibly_damaging(0.85) | TCGA-D8-A1JK-01 | Breast | breast invasive carcinoma | Female | >=65 | I/II | Unknown | Unknown | SD | |
| MPP5 | SNV | Missense_Mutation | c.1816N>G | p.Arg606Gly | p.R606G | Q8N3R9 | protein_coding | deleterious(0) | possibly_damaging(0.758) | TCGA-E2-A1IH-01 | Breast | breast invasive carcinoma | Female | >=65 | I/II | Hormone Therapy | aromasin | SD | |
| MPP5 | SNV | Missense_Mutation | novel | c.1069G>A | p.Asp357Asn | p.D357N | Q8N3R9 | protein_coding | deleterious(0) | possibly_damaging(0.591) | TCGA-DS-A1OB-01 | Cervix | cervical & endocervical cancer | Female | <65 | I/II | Chemotherapy | carboplatin | PD |
| MPP5 | SNV | Missense_Mutation | c.1507G>C | p.Glu503Gln | p.E503Q | Q8N3R9 | protein_coding | tolerated(0.09) | benign(0.05) | TCGA-IR-A3LK-01 | Cervix | cervical & endocervical cancer | Female | >=65 | I/II | Chemotherapy | cisplatin | PD | |
| MPP5 | SNV | Missense_Mutation | rs771564286 | c.845N>A | p.Arg282Gln | p.R282Q | Q8N3R9 | protein_coding | deleterious(0) | probably_damaging(0.997) | TCGA-JX-A3Q0-01 | Cervix | cervical & endocervical cancer | Female | <65 | III/IV | Unknown | Unknown | SD |
| MPP5 | SNV | Missense_Mutation | rs778846917 | c.203N>A | p.Arg68His | p.R68H | Q8N3R9 | protein_coding | deleterious(0.01) | possibly_damaging(0.77) | TCGA-AA-3950-01 | Colorectum | colon adenocarcinoma | Female | >=65 | I/II | Unknown | Unknown | SD |
| MPP5 | SNV | Missense_Mutation | rs767964224 | c.155N>A | p.Arg52Gln | p.R52Q | Q8N3R9 | protein_coding | tolerated(0.19) | benign(0.289) | TCGA-AA-3984-01 | Colorectum | colon adenocarcinoma | Female | <65 | I/II | Unknown | Unknown | SD |
| MPP5 | SNV | Missense_Mutation | rs749130375 | c.814N>T | p.Arg272Cys | p.R272C | Q8N3R9 | protein_coding | deleterious(0) | probably_damaging(0.996) | TCGA-AA-A010-01 | Colorectum | colon adenocarcinoma | Female | <65 | I/II | Chemotherapy | folinic | CR |
| MPP5 | SNV | Missense_Mutation | novel | c.1890N>C | p.Glu630Asp | p.E630D | Q8N3R9 | protein_coding | tolerated(0.22) | possibly_damaging(0.631) | TCGA-AA-A01D-01 | Colorectum | colon adenocarcinoma | Female | <65 | III/IV | Chemotherapy | capecitabine | PD |
| Page: 1 2 3 4 5 6 7 |
Top |
Related drugs of malignant transformation related genes |
| Identification of chemicals and drugs interact with genes involved in malignant transfromation |
| (DGIdb 4.0) |
| Entrez ID | Symbol | Category | Interaction Types | Drug Claim Name | Drug Name | PMIDs |
| Page: 1 |

Copyright 2023-Present -The University of Texas Health Science Center at Houston |