
|
|||||
|
 | |
| |
| |
| |
| |
| |
|
Gene: MPP1 |
Gene summary for MPP1 |
| Gene information | Species | Human | Gene symbol | MPP1 | Gene ID | 4354 |
| Gene name | membrane palmitoylated protein 1 | |
| Gene Alias | AAG12 | |
| Cytomap | Xq28 | |
| Gene Type | protein-coding | GO ID | GO:0002376 | UniProtAcc | B4E325 |
Top |
Malignant transformation analysis |
| Identification of the aberrant gene expression in precancerous and cancerous lesions by comparing the gene expression of stem-like cells in diseased tissues with normal stem cells |
| Entrez ID | Symbol | Replicates | Species | Organ | Tissue | Adj P-value | Log2FC | Malignancy |
| 4354 | MPP1 | LZE4T | Human | Esophagus | ESCC | 4.39e-03 | 1.71e-01 | 0.0811 |
| 4354 | MPP1 | LZE7T | Human | Esophagus | ESCC | 1.67e-02 | 2.02e-01 | 0.0667 |
| 4354 | MPP1 | P2T-E | Human | Esophagus | ESCC | 1.64e-15 | 2.62e-01 | 0.1177 |
| 4354 | MPP1 | P9T-E | Human | Esophagus | ESCC | 1.80e-02 | 1.37e-01 | 0.1131 |
| 4354 | MPP1 | P10T-E | Human | Esophagus | ESCC | 1.19e-09 | 1.78e-01 | 0.116 |
| 4354 | MPP1 | P11T-E | Human | Esophagus | ESCC | 1.09e-05 | 2.40e-01 | 0.1426 |
| 4354 | MPP1 | P22T-E | Human | Esophagus | ESCC | 5.10e-57 | 8.91e-01 | 0.1236 |
| 4354 | MPP1 | P23T-E | Human | Esophagus | ESCC | 1.37e-03 | 1.30e-01 | 0.108 |
| 4354 | MPP1 | P24T-E | Human | Esophagus | ESCC | 1.34e-02 | 4.59e-02 | 0.1287 |
| 4354 | MPP1 | P26T-E | Human | Esophagus | ESCC | 2.37e-02 | 1.27e-01 | 0.1276 |
| 4354 | MPP1 | P28T-E | Human | Esophagus | ESCC | 1.07e-02 | 9.66e-02 | 0.1149 |
| 4354 | MPP1 | P32T-E | Human | Esophagus | ESCC | 6.02e-04 | 1.39e-01 | 0.1666 |
| 4354 | MPP1 | P47T-E | Human | Esophagus | ESCC | 2.73e-02 | 7.80e-02 | 0.1067 |
| 4354 | MPP1 | P52T-E | Human | Esophagus | ESCC | 9.38e-09 | 2.09e-01 | 0.1555 |
| 4354 | MPP1 | P76T-E | Human | Esophagus | ESCC | 7.96e-08 | 2.26e-01 | 0.1207 |
| 4354 | MPP1 | P80T-E | Human | Esophagus | ESCC | 6.58e-09 | 2.70e-01 | 0.155 |
| 4354 | MPP1 | P89T-E | Human | Esophagus | ESCC | 4.23e-04 | 2.86e-01 | 0.1752 |
| 4354 | MPP1 | P91T-E | Human | Esophagus | ESCC | 1.43e-05 | 7.05e-01 | 0.1828 |
| 4354 | MPP1 | P107T-E | Human | Esophagus | ESCC | 1.06e-08 | 2.11e-01 | 0.171 |
| 4354 | MPP1 | cirrhotic1 | Human | Liver | Cirrhotic | 2.44e-02 | 9.63e-02 | 0.0202 |
| Page: 1 2 |
| Tissue | Expression Dynamics | Abbreviation |
| Esophagus | 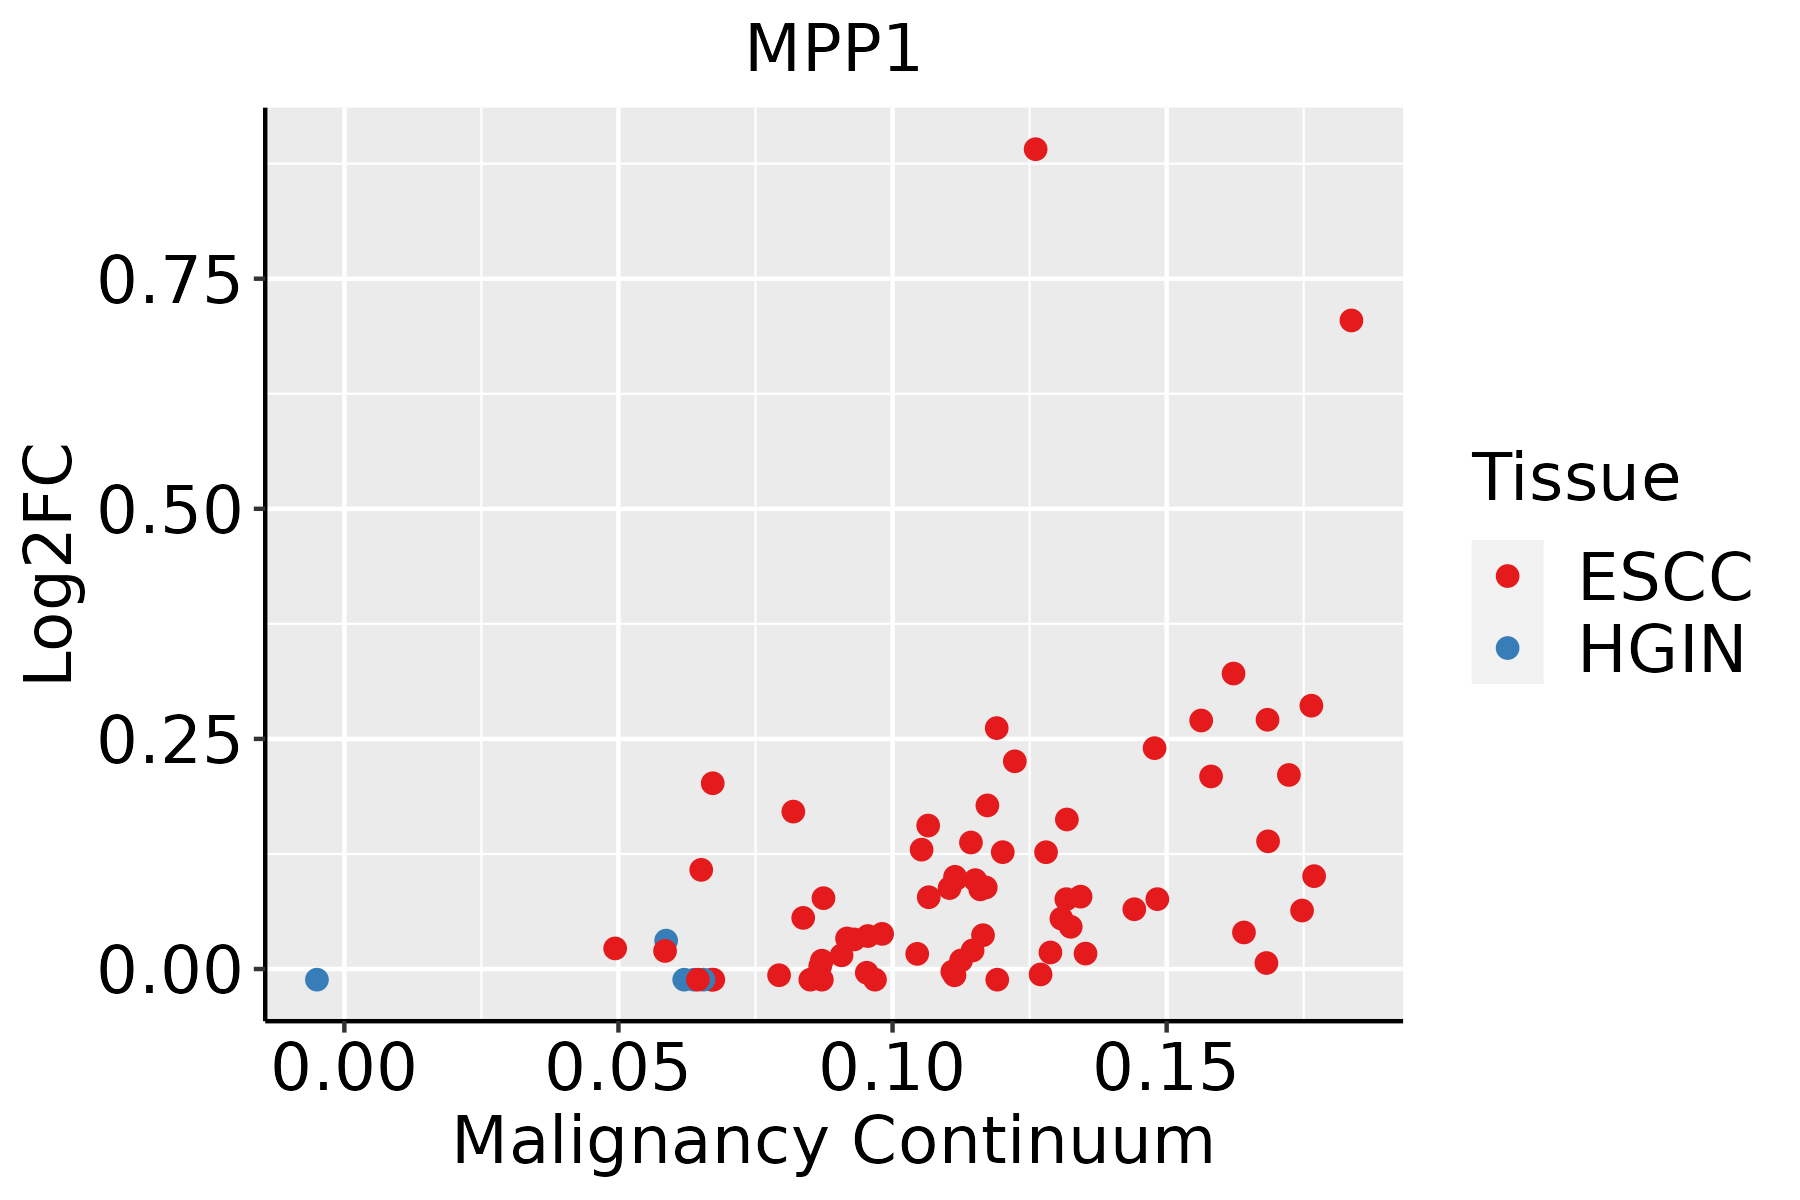 | ESCC: Esophageal squamous cell carcinoma |
| HGIN: High-grade intraepithelial neoplasias | ||
| LGIN: Low-grade intraepithelial neoplasias | ||
| Liver | 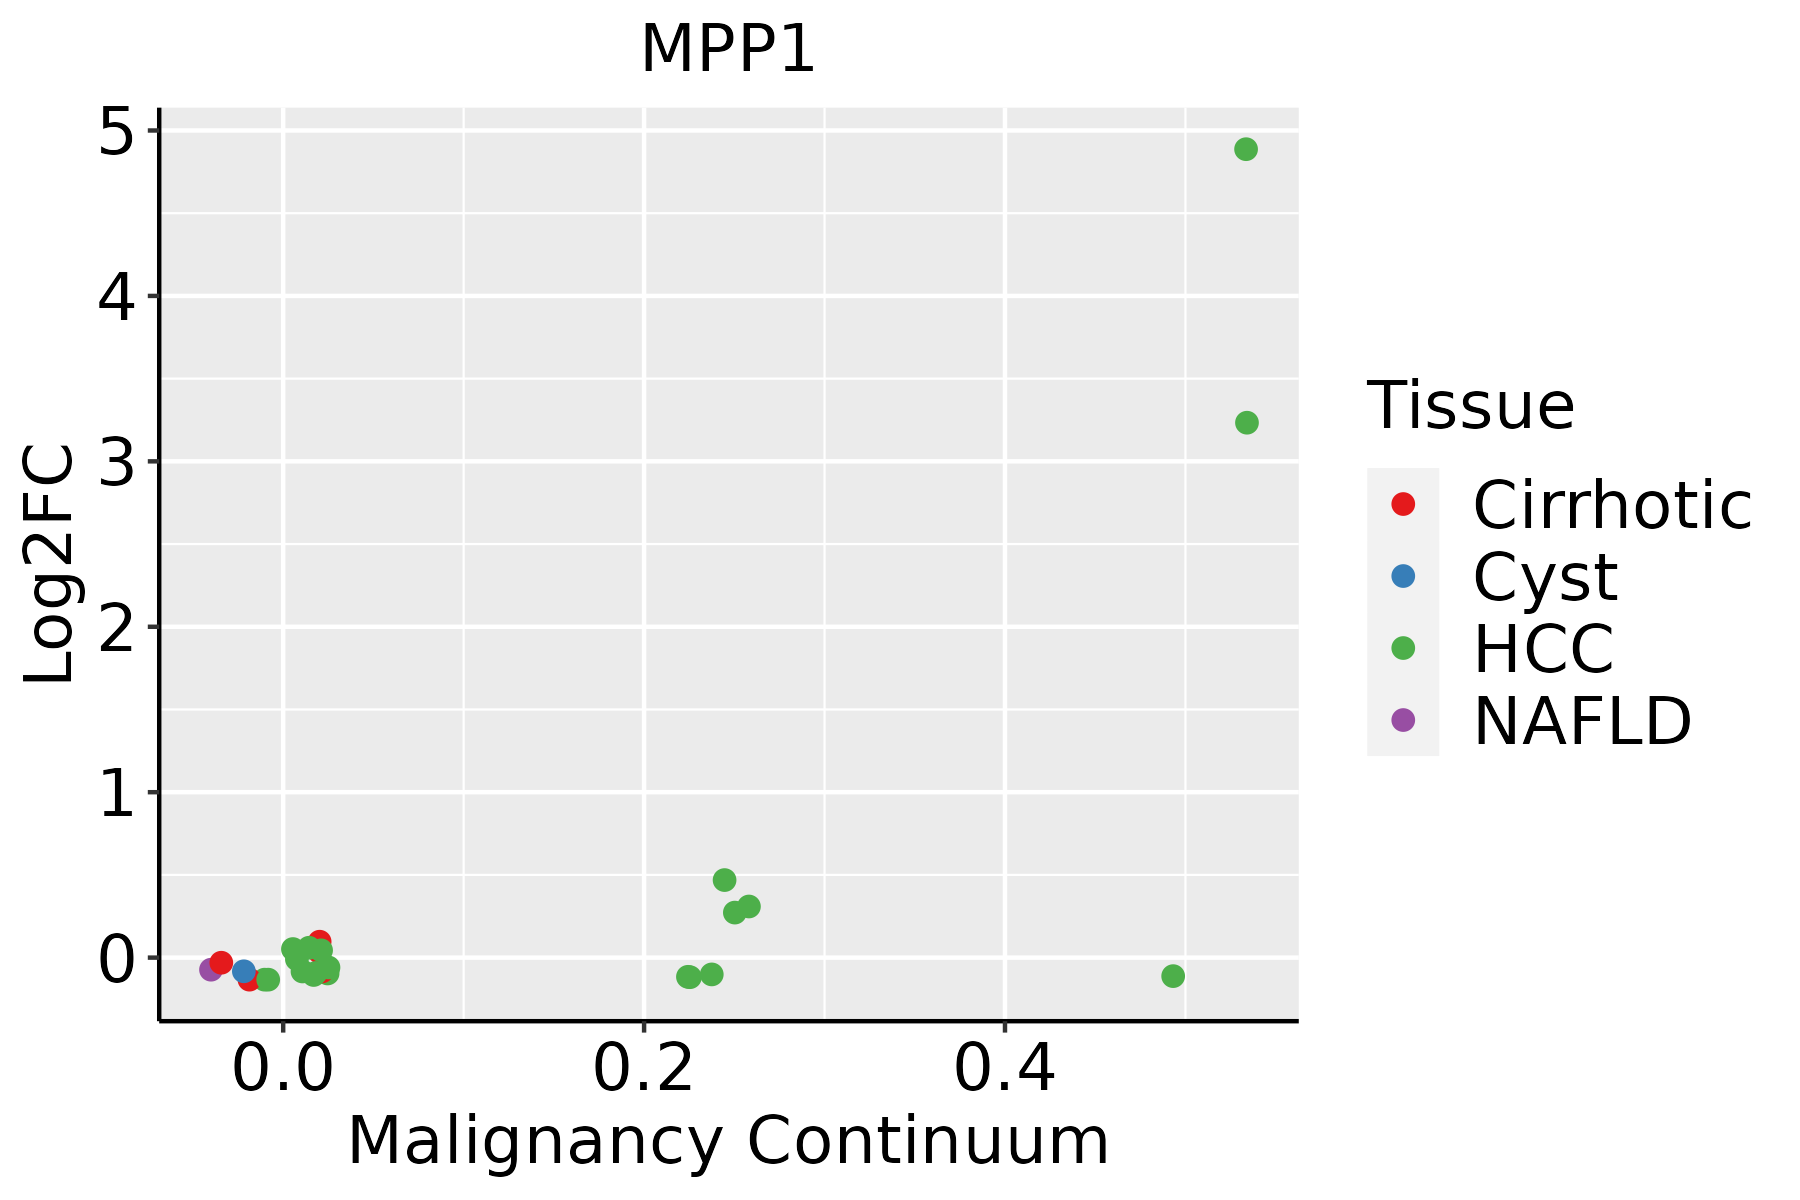 | HCC: Hepatocellular carcinoma |
| NAFLD: Non-alcoholic fatty liver disease |
| ∗log2FC in expression of this searched gene in stem-like cells from each diseased tissue sample relative to stem-like cells in normal samples in each tissue plotted against the malignancy continuum. Samples are colored based on if they are from different disease stage. |
Top |
Malignant transformation related pathway analysis |
| Find out the enriched GO biological processes and KEGG pathways involved in transition from healthy to precancer to cancer |
| Tissue | Disease Stage | Enriched GO biological Processes |
| Colorectum | AD |  |
| Colorectum | SER |  |
| Colorectum | MSS |  |
| Colorectum | MSI-H |  |
| Colorectum | FAP |  |
| ∗Top 15 enriched GO BP terms are showed in the bar plot of each disease state in each tissue. Each row represents a significant GO biological process which is colored according to the -log10(p.adjust). |
| Page: 1 2 3 4 5 6 7 8 9 |
| GO ID | Tissue | Disease Stage | Description | Gene Ratio | Bg Ratio | pvalue | p.adjust | Count |
| GO:0006753110 | Esophagus | ESCC | nucleoside phosphate metabolic process | 288/8552 | 497/18723 | 1.80e-08 | 3.50e-07 | 288 |
| GO:0019693111 | Esophagus | ESCC | ribose phosphate metabolic process | 234/8552 | 396/18723 | 4.24e-08 | 7.76e-07 | 234 |
| GO:0009117111 | Esophagus | ESCC | nucleotide metabolic process | 282/8552 | 489/18723 | 4.70e-08 | 8.50e-07 | 282 |
| GO:0009259111 | Esophagus | ESCC | ribonucleotide metabolic process | 224/8552 | 385/18723 | 4.41e-07 | 6.00e-06 | 224 |
| GO:0072521111 | Esophagus | ESCC | purine-containing compound metabolic process | 238/8552 | 416/18723 | 1.20e-06 | 1.49e-05 | 238 |
| GO:0009150111 | Esophagus | ESCC | purine ribonucleotide metabolic process | 213/8552 | 368/18723 | 1.40e-06 | 1.69e-05 | 213 |
| GO:0006163111 | Esophagus | ESCC | purine nucleotide metabolic process | 226/8552 | 396/18723 | 2.81e-06 | 3.21e-05 | 226 |
| GO:000913219 | Esophagus | ESCC | nucleoside diphosphate metabolic process | 77/8552 | 124/18723 | 1.65e-04 | 1.09e-03 | 77 |
| GO:000918520 | Esophagus | ESCC | ribonucleoside diphosphate metabolic process | 66/8552 | 106/18723 | 4.21e-04 | 2.39e-03 | 66 |
| GO:00091234 | Esophagus | ESCC | nucleoside monophosphate metabolic process | 49/8552 | 76/18723 | 7.30e-04 | 3.80e-03 | 49 |
| GO:000913520 | Esophagus | ESCC | purine nucleoside diphosphate metabolic process | 63/8552 | 103/18723 | 1.10e-03 | 5.52e-03 | 63 |
| GO:000917920 | Esophagus | ESCC | purine ribonucleoside diphosphate metabolic process | 63/8552 | 103/18723 | 1.10e-03 | 5.52e-03 | 63 |
| GO:00091615 | Esophagus | ESCC | ribonucleoside monophosphate metabolic process | 38/8552 | 58/18723 | 1.81e-03 | 8.32e-03 | 38 |
| GO:00091269 | Esophagus | ESCC | purine nucleoside monophosphate metabolic process | 30/8552 | 44/18723 | 2.14e-03 | 9.54e-03 | 30 |
| GO:000268515 | Esophagus | ESCC | regulation of leukocyte migration | 114/8552 | 210/18723 | 7.26e-03 | 2.63e-02 | 114 |
| GO:00091678 | Esophagus | ESCC | purine ribonucleoside monophosphate metabolic process | 27/8552 | 41/18723 | 7.31e-03 | 2.63e-02 | 27 |
| GO:000675312 | Liver | Cirrhotic | nucleoside phosphate metabolic process | 190/4634 | 497/18723 | 1.10e-11 | 6.96e-10 | 190 |
| GO:000911712 | Liver | Cirrhotic | nucleotide metabolic process | 187/4634 | 489/18723 | 1.55e-11 | 9.63e-10 | 187 |
| GO:001969312 | Liver | Cirrhotic | ribose phosphate metabolic process | 156/4634 | 396/18723 | 5.83e-11 | 3.23e-09 | 156 |
| GO:000925912 | Liver | Cirrhotic | ribonucleotide metabolic process | 151/4634 | 385/18723 | 1.72e-10 | 8.70e-09 | 151 |
| Page: 1 2 3 |
| Pathway ID | Tissue | Disease Stage | Description | Gene Ratio | Bg Ratio | pvalue | p.adjust | qvalue | Count |
| Page: 1 |
Top |
Cell-cell communication analysis |
| Identification of potential cell-cell interactions between two cell types and their ligand-receptor pairs for different disease states |
| Ligand | Receptor | LRpair | Pathway | Tissue | Disease Stage |
| Page: 1 |
Top |
Single-cell gene regulatory network inference analysis |
| Find out the significant the regulons (TFs) and the target genes of each regulon across cell types for different disease states |
| TF | Cell Type | Tissue | Disease Stage | Target Gene | RSS | Regulon Activity |
| ∗The dot plots of a searched regulon are shown for all cell subpopulations in each disease state of each tissue based on the regulon specific score inferred using pySCENIC and by calculating the average expression. |
| Page: 1 |
Top |
Somatic mutation of malignant transformation related genes |
| Annotation of somatic variants for genes involved in malignant transformation |
| Hugo Symbol | Variant Class | Variant Classification | dbSNP RS | HGVSc | HGVSp | HGVSp Short | SWISSPROT | BIOTYPE | SIFT | PolyPhen | Tumor Sample Barcode | Tissue | Histology | Sex | Age | Stage | Therapy Types | Drugs | Outcome |
| MPP1 | SNV | Missense_Mutation | c.39N>A | p.Ser13Arg | p.S13R | Q00013 | protein_coding | deleterious_low_confidence(0) | benign(0.134) | TCGA-A2-A3XT-01 | Breast | breast invasive carcinoma | Female | <65 | I/II | Chemotherapy | cyclophosphamide | PR | |
| MPP1 | SNV | Missense_Mutation | c.1061N>G | p.Tyr354Cys | p.Y354C | Q00013 | protein_coding | deleterious(0) | probably_damaging(0.919) | TCGA-AN-A0FL-01 | Breast | breast invasive carcinoma | Female | <65 | I/II | Unknown | Unknown | SD | |
| MPP1 | SNV | Missense_Mutation | novel | c.617N>T | p.Arg206Leu | p.R206L | Q00013 | protein_coding | tolerated(0.05) | benign(0.05) | TCGA-BH-A0HA-01 | Breast | breast invasive carcinoma | Female | <65 | I/II | Unknown | Unknown | SD |
| MPP1 | SNV | Missense_Mutation | rs782458500 | c.1364N>A | p.Ser455Asn | p.S455N | Q00013 | protein_coding | tolerated(0.1) | benign(0.012) | TCGA-D8-A1JA-01 | Breast | breast invasive carcinoma | Female | <65 | III/IV | Chemotherapy | adriamycin | PD |
| MPP1 | SNV | Missense_Mutation | novel | c.1238N>G | p.Gln413Arg | p.Q413R | Q00013 | protein_coding | tolerated(0.31) | benign(0.021) | TCGA-EW-A1IZ-01 | Breast | breast invasive carcinoma | Female | <65 | III/IV | Chemotherapy | taxotere | SD |
| MPP1 | SNV | Missense_Mutation | c.843N>C | p.Lys281Asn | p.K281N | Q00013 | protein_coding | tolerated(0.1) | benign(0.071) | TCGA-GM-A2D9-01 | Breast | breast invasive carcinoma | Female | >=65 | I/II | Hormone Therapy | arimidex | SD | |
| MPP1 | insertion | Nonsense_Mutation | novel | c.331_332insCTTTCCTCAATGGAGAACATAGTGACGACAGGAGTAGAGAATGAAT | p.Leu111ProfsTer15 | p.L111Pfs*15 | Q00013 | protein_coding | TCGA-A8-A07J-01 | Breast | breast invasive carcinoma | Female | <65 | I/II | Chemotherapy | 5-fluorouracil | CR | ||
| MPP1 | SNV | Missense_Mutation | novel | c.1079N>A | p.Gly360Asp | p.G360D | Q00013 | protein_coding | deleterious(0) | probably_damaging(1) | TCGA-2W-A8YY-01 | Cervix | cervical & endocervical cancer | Female | <65 | I/II | Chemotherapy | cisplatin | CR |
| MPP1 | SNV | Missense_Mutation | novel | c.146N>T | p.Thr49Ile | p.T49I | Q00013 | protein_coding | tolerated(0.12) | benign(0.313) | TCGA-MA-AA42-01 | Cervix | cervical & endocervical cancer | Female | >=65 | I/II | Unknown | Unknown | SD |
| MPP1 | SNV | Missense_Mutation | rs782396777 | c.1198A>G | p.Ile400Val | p.I400V | Q00013 | protein_coding | tolerated(0.09) | benign(0.024) | TCGA-VS-A8QM-01 | Cervix | cervical & endocervical cancer | Female | <65 | I/II | Chemotherapy | cisplatin | PD |
| Page: 1 2 3 4 5 6 7 |
Top |
Related drugs of malignant transformation related genes |
| Identification of chemicals and drugs interact with genes involved in malignant transfromation |
| (DGIdb 4.0) |
| Entrez ID | Symbol | Category | Interaction Types | Drug Claim Name | Drug Name | PMIDs |
| Page: 1 |

Copyright 2023-Present -The University of Texas Health Science Center at Houston |