
|
|||||
|
 | |
| |
| |
| |
| |
| |
|
Gene: MPND |
Gene summary for MPND |
| Gene information | Species | Human | Gene symbol | MPND | Gene ID | 84954 |
| Gene name | MPN domain containing | |
| Gene Alias | MPND | |
| Cytomap | 19p13.3 | |
| Gene Type | protein-coding | GO ID | GO:0006139 | UniProtAcc | Q8N594 |
Top |
Malignant transformation analysis |
| Identification of the aberrant gene expression in precancerous and cancerous lesions by comparing the gene expression of stem-like cells in diseased tissues with normal stem cells |
| Entrez ID | Symbol | Replicates | Species | Organ | Tissue | Adj P-value | Log2FC | Malignancy |
| 84954 | MPND | HCC1_Meng | Human | Liver | HCC | 2.60e-22 | 5.85e-02 | 0.0246 |
| 84954 | MPND | HCC2_Meng | Human | Liver | HCC | 1.21e-15 | 1.05e-01 | 0.0107 |
| 84954 | MPND | HCC1 | Human | Liver | HCC | 2.20e-02 | 1.84e+00 | 0.5336 |
| 84954 | MPND | HCC2 | Human | Liver | HCC | 1.11e-05 | 2.49e+00 | 0.5341 |
| 84954 | MPND | S027 | Human | Liver | HCC | 4.86e-05 | 3.93e-01 | 0.2446 |
| 84954 | MPND | S028 | Human | Liver | HCC | 1.44e-06 | 2.64e-01 | 0.2503 |
| 84954 | MPND | S029 | Human | Liver | HCC | 3.69e-09 | 2.86e-01 | 0.2581 |
| 84954 | MPND | C21 | Human | Oral cavity | OSCC | 1.28e-16 | 5.62e-01 | 0.2678 |
| 84954 | MPND | C30 | Human | Oral cavity | OSCC | 2.76e-09 | 5.18e-01 | 0.3055 |
| 84954 | MPND | C46 | Human | Oral cavity | OSCC | 5.37e-04 | 2.49e-01 | 0.1673 |
| 84954 | MPND | C08 | Human | Oral cavity | OSCC | 4.49e-21 | 3.71e-01 | 0.1919 |
| 84954 | MPND | LN46 | Human | Oral cavity | OSCC | 4.84e-04 | 3.34e-01 | 0.1666 |
| 84954 | MPND | SYSMH1 | Human | Oral cavity | OSCC | 3.25e-03 | 1.82e-01 | 0.1127 |
| 84954 | MPND | SYSMH2 | Human | Oral cavity | OSCC | 1.03e-03 | 1.40e-01 | 0.2326 |
| 84954 | MPND | SYSMH3 | Human | Oral cavity | OSCC | 1.09e-04 | 2.06e-01 | 0.2442 |
| 84954 | MPND | SYSMH6 | Human | Oral cavity | OSCC | 2.81e-07 | 1.16e-01 | 0.1275 |
| Page: 1 |
| Tissue | Expression Dynamics | Abbreviation |
| Liver | 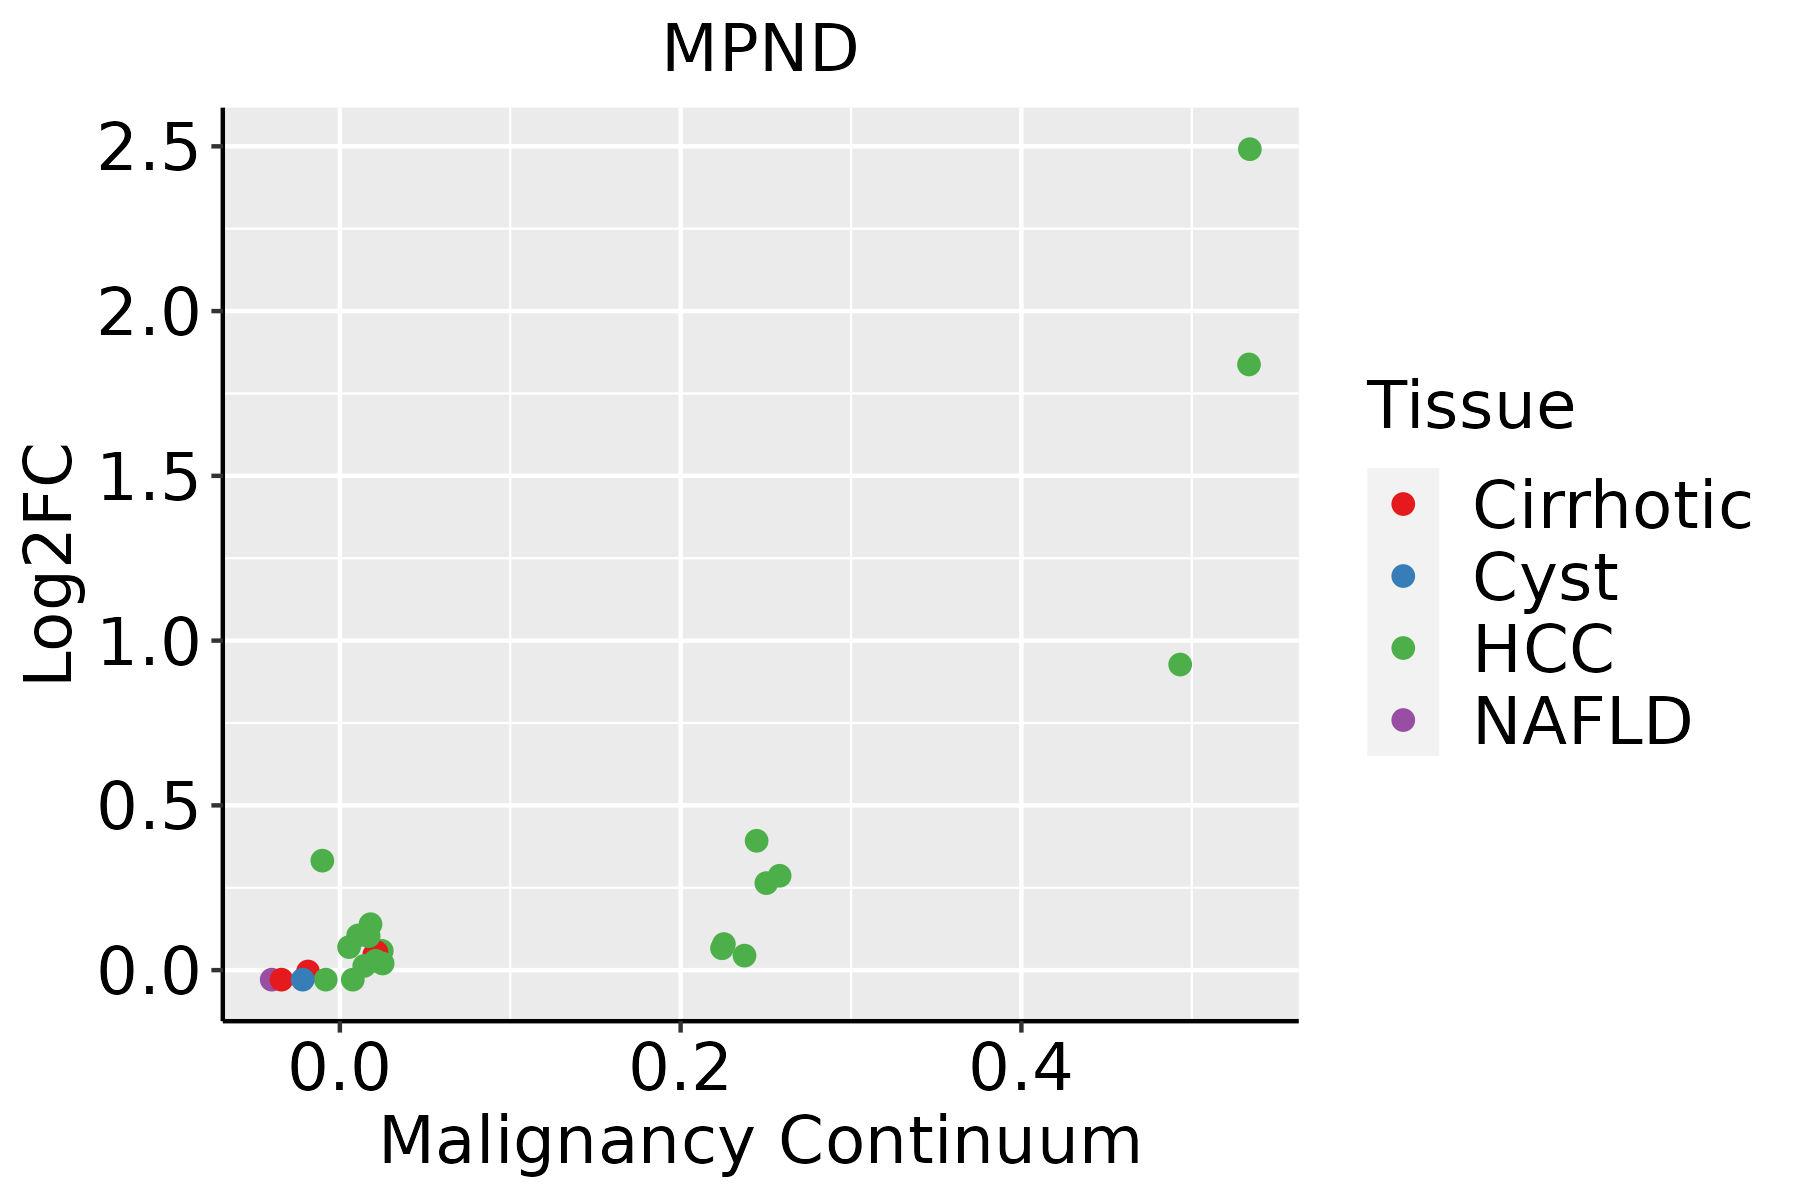 | HCC: Hepatocellular carcinoma |
| NAFLD: Non-alcoholic fatty liver disease | ||
| Oral Cavity | 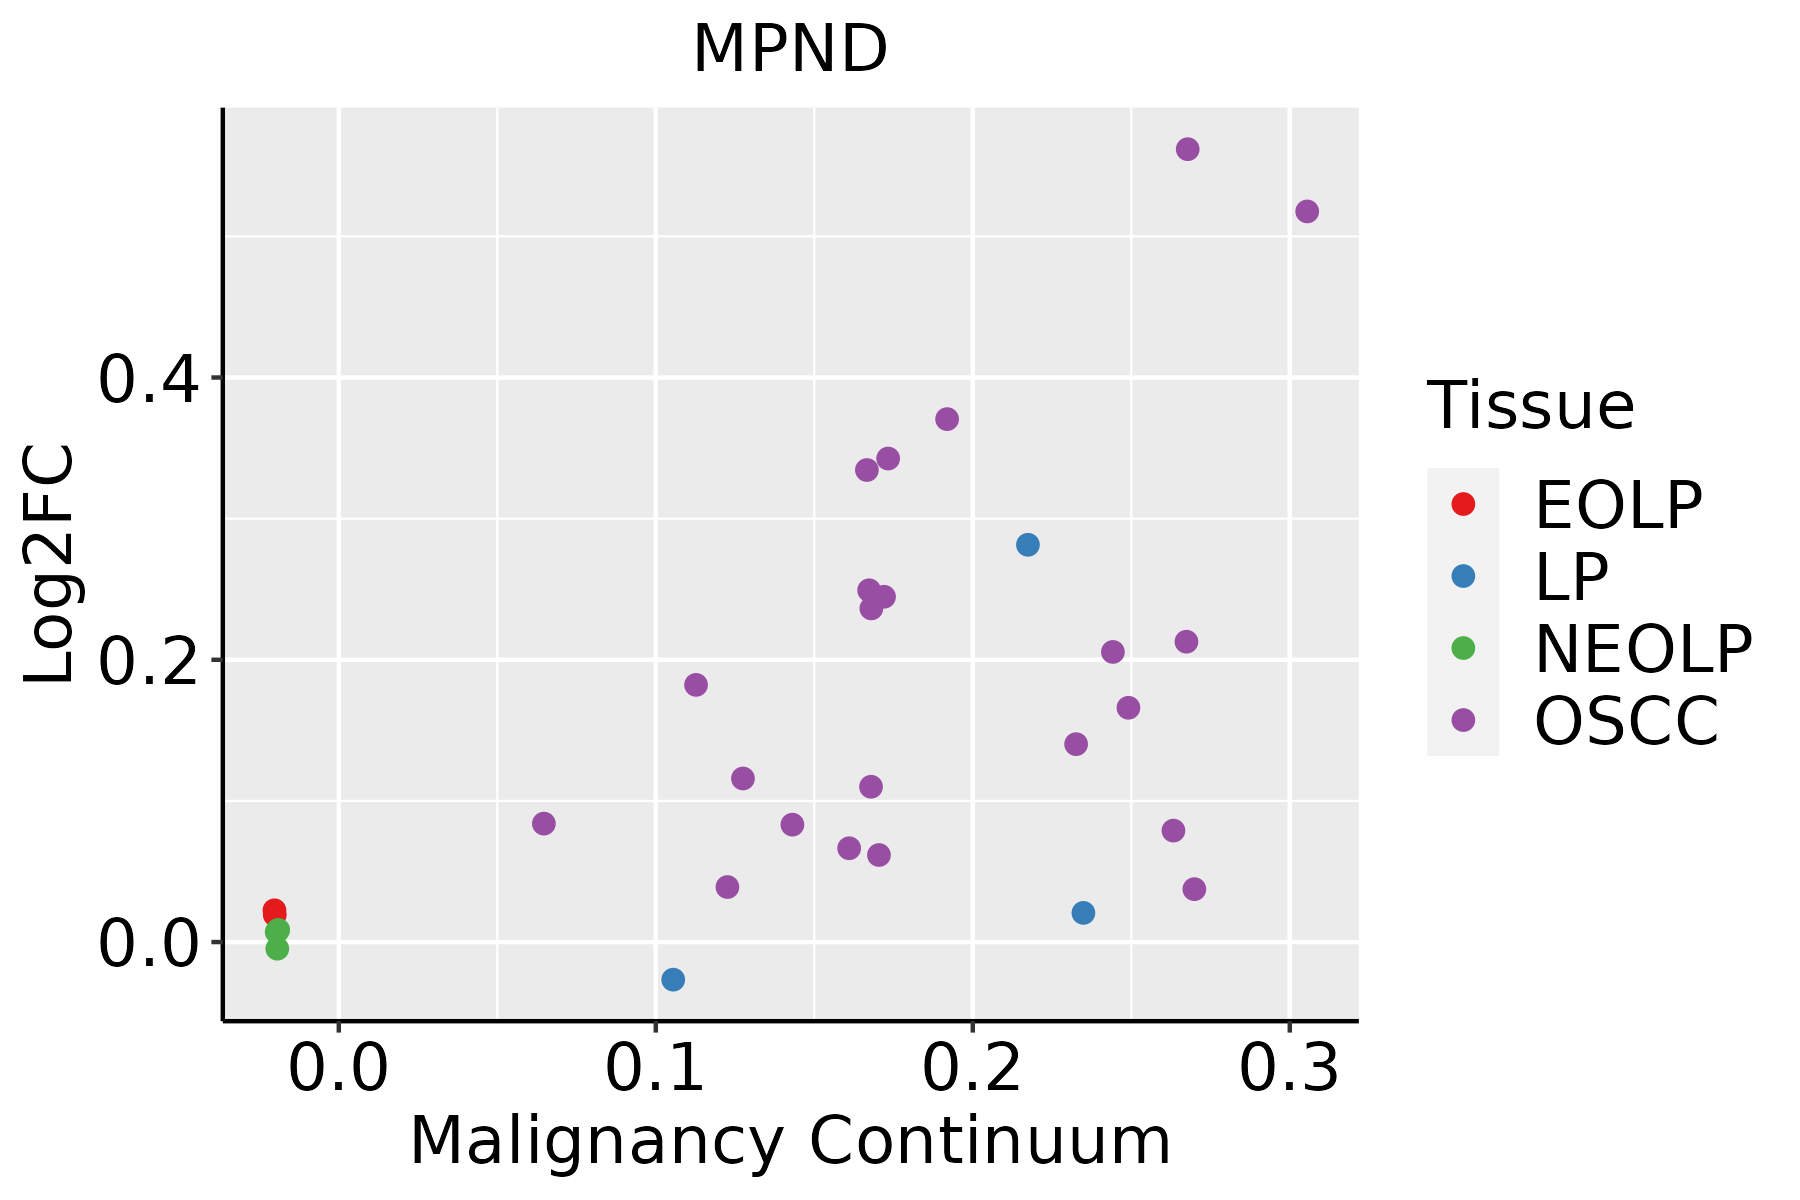 | EOLP: Erosive Oral lichen planus |
| LP: leukoplakia | ||
| NEOLP: Non-erosive oral lichen planus | ||
| OSCC: Oral squamous cell carcinoma |
| ∗log2FC in expression of this searched gene in stem-like cells from each diseased tissue sample relative to stem-like cells in normal samples in each tissue plotted against the malignancy continuum. Samples are colored based on if they are from different disease stage. |
Top |
Malignant transformation related pathway analysis |
| Find out the enriched GO biological processes and KEGG pathways involved in transition from healthy to precancer to cancer |
| Tissue | Disease Stage | Enriched GO biological Processes |
| Colorectum | AD |  |
| Colorectum | SER |  |
| Colorectum | MSS |  |
| Colorectum | MSI-H |  |
| Colorectum | FAP |  |
| ∗Top 15 enriched GO BP terms are showed in the bar plot of each disease state in each tissue. Each row represents a significant GO biological process which is colored according to the -log10(p.adjust). |
| Page: 1 2 3 4 5 6 7 8 9 |
| GO ID | Tissue | Disease Stage | Description | Gene Ratio | Bg Ratio | pvalue | p.adjust | Count |
| GO:000632511 | Liver | HCC | chromatin organization | 206/7958 | 409/18723 | 7.23e-04 | 4.41e-03 | 206 |
| GO:000632510 | Oral cavity | OSCC | chromatin organization | 190/7305 | 409/18723 | 1.17e-03 | 5.97e-03 | 190 |
| Page: 1 |
| Pathway ID | Tissue | Disease Stage | Description | Gene Ratio | Bg Ratio | pvalue | p.adjust | qvalue | Count |
| Page: 1 |
Top |
Cell-cell communication analysis |
| Identification of potential cell-cell interactions between two cell types and their ligand-receptor pairs for different disease states |
| Ligand | Receptor | LRpair | Pathway | Tissue | Disease Stage |
| Page: 1 |
Top |
Single-cell gene regulatory network inference analysis |
| Find out the significant the regulons (TFs) and the target genes of each regulon across cell types for different disease states |
| TF | Cell Type | Tissue | Disease Stage | Target Gene | RSS | Regulon Activity |
| ∗The dot plots of a searched regulon are shown for all cell subpopulations in each disease state of each tissue based on the regulon specific score inferred using pySCENIC and by calculating the average expression. |
| Page: 1 |
Top |
Somatic mutation of malignant transformation related genes |
| Annotation of somatic variants for genes involved in malignant transformation |
| Hugo Symbol | Variant Class | Variant Classification | dbSNP RS | HGVSc | HGVSp | HGVSp Short | SWISSPROT | BIOTYPE | SIFT | PolyPhen | Tumor Sample Barcode | Tissue | Histology | Sex | Age | Stage | Therapy Types | Drugs | Outcome |
| MPND | SNV | Missense_Mutation | novel | c.994N>A | p.Glu332Lys | p.E332K | protein_coding | deleterious(0.01) | probably_damaging(0.999) | TCGA-C8-A8HP-01 | Breast | breast invasive carcinoma | Female | <65 | III/IV | Chemotherapy | 5-fluorouracil | CR | |
| MPND | SNV | Missense_Mutation | c.788N>A | p.Ala263Asp | p.A263D | protein_coding | deleterious(0.02) | possibly_damaging(0.698) | TCGA-E9-A1R2-01 | Breast | breast invasive carcinoma | Female | <65 | III/IV | Chemotherapy | taxotere | CR | ||
| MPND | SNV | Missense_Mutation | novel | c.556N>A | p.Glu186Lys | p.E186K | protein_coding | tolerated(0.18) | benign(0.142) | TCGA-2W-A8YY-01 | Cervix | cervical & endocervical cancer | Female | <65 | I/II | Chemotherapy | cisplatin | CR | |
| MPND | SNV | Missense_Mutation | rs767038772 | c.1019N>A | p.Arg340Gln | p.R340Q | protein_coding | deleterious(0.04) | probably_damaging(1) | TCGA-A6-6781-01 | Colorectum | colon adenocarcinoma | Male | <65 | III/IV | Chemotherapy | oxaliplatin | SD | |
| MPND | SNV | Missense_Mutation | rs776628559 | c.710C>T | p.Pro237Leu | p.P237L | protein_coding | tolerated(0.09) | possibly_damaging(0.787) | TCGA-AA-3864-01 | Colorectum | colon adenocarcinoma | Male | >=65 | I/II | Unknown | Unknown | SD | |
| MPND | SNV | Missense_Mutation | rs368152281 | c.1483N>A | p.Gly495Ser | p.G495S | protein_coding | tolerated(1) | benign(0) | TCGA-AD-6964-01 | Colorectum | colon adenocarcinoma | Male | <65 | III/IV | Chemotherapy | folfox | PD | |
| MPND | SNV | Missense_Mutation | rs569249456 | c.1018C>T | p.Arg340Trp | p.R340W | protein_coding | deleterious(0) | probably_damaging(1) | TCGA-AJ-A3BH-01 | Endometrium | uterine corpus endometrioid carcinoma | Female | Unknown | I/II | Unknown | Unknown | SD | |
| MPND | SNV | Missense_Mutation | c.509N>T | p.Thr170Met | p.T170M | protein_coding | tolerated(0.45) | benign(0.006) | TCGA-AJ-A3NE-01 | Endometrium | uterine corpus endometrioid carcinoma | Female | <65 | I/II | Unknown | Unknown | SD | ||
| MPND | SNV | Missense_Mutation | rs574056829 | c.1465G>A | p.Val489Ile | p.V489I | protein_coding | tolerated(0.37) | benign(0.019) | TCGA-AP-A0LM-01 | Endometrium | uterine corpus endometrioid carcinoma | Female | <65 | III/IV | Chemotherapy | cisplatin | SD | |
| MPND | SNV | Missense_Mutation | novel | c.878T>C | p.Val293Ala | p.V293A | protein_coding | deleterious(0) | probably_damaging(0.999) | TCGA-AP-A1DK-01 | Endometrium | uterine corpus endometrioid carcinoma | Female | <65 | I/II | Unknown | Unknown | SD |
| Page: 1 2 3 |
Top |
Related drugs of malignant transformation related genes |
| Identification of chemicals and drugs interact with genes involved in malignant transfromation |
| (DGIdb 4.0) |
| Entrez ID | Symbol | Category | Interaction Types | Drug Claim Name | Drug Name | PMIDs |
| Page: 1 |

Copyright 2023-Present -The University of Texas Health Science Center at Houston |