
|
|||||
|
 | |
| |
| |
| |
| |
| |
|
Gene: MPI |
Gene summary for MPI |
| Gene information | Species | Human | Gene symbol | MPI | Gene ID | 4351 |
| Gene name | mannose phosphate isomerase | |
| Gene Alias | CDG1B | |
| Cytomap | 15q24.1-q24.2 | |
| Gene Type | protein-coding | GO ID | GO:0000032 | UniProtAcc | H3BPP3 |
Top |
Malignant transformation analysis |
| Identification of the aberrant gene expression in precancerous and cancerous lesions by comparing the gene expression of stem-like cells in diseased tissues with normal stem cells |
| Entrez ID | Symbol | Replicates | Species | Organ | Tissue | Adj P-value | Log2FC | Malignancy |
| 4351 | MPI | LZE2T | Human | Esophagus | ESCC | 1.57e-04 | 4.29e-01 | 0.082 |
| 4351 | MPI | LZE4T | Human | Esophagus | ESCC | 1.42e-08 | 2.14e-01 | 0.0811 |
| 4351 | MPI | LZE7T | Human | Esophagus | ESCC | 1.11e-03 | 1.40e-01 | 0.0667 |
| 4351 | MPI | LZE8T | Human | Esophagus | ESCC | 1.65e-10 | 2.17e-01 | 0.067 |
| 4351 | MPI | LZE24T | Human | Esophagus | ESCC | 1.68e-12 | 2.48e-01 | 0.0596 |
| 4351 | MPI | P1T-E | Human | Esophagus | ESCC | 3.83e-05 | 2.58e-01 | 0.0875 |
| 4351 | MPI | P2T-E | Human | Esophagus | ESCC | 4.03e-11 | 2.31e-01 | 0.1177 |
| 4351 | MPI | P4T-E | Human | Esophagus | ESCC | 1.07e-23 | 4.06e-01 | 0.1323 |
| 4351 | MPI | P5T-E | Human | Esophagus | ESCC | 1.74e-13 | 2.27e-01 | 0.1327 |
| 4351 | MPI | P8T-E | Human | Esophagus | ESCC | 2.94e-07 | 2.20e-01 | 0.0889 |
| 4351 | MPI | P9T-E | Human | Esophagus | ESCC | 2.11e-04 | 7.77e-02 | 0.1131 |
| 4351 | MPI | P10T-E | Human | Esophagus | ESCC | 1.16e-18 | 3.01e-01 | 0.116 |
| 4351 | MPI | P11T-E | Human | Esophagus | ESCC | 2.03e-04 | 2.57e-01 | 0.1426 |
| 4351 | MPI | P12T-E | Human | Esophagus | ESCC | 5.65e-16 | 3.28e-01 | 0.1122 |
| 4351 | MPI | P15T-E | Human | Esophagus | ESCC | 2.76e-28 | 5.75e-01 | 0.1149 |
| 4351 | MPI | P16T-E | Human | Esophagus | ESCC | 3.57e-35 | 6.28e-01 | 0.1153 |
| 4351 | MPI | P17T-E | Human | Esophagus | ESCC | 2.28e-05 | 1.85e-01 | 0.1278 |
| 4351 | MPI | P19T-E | Human | Esophagus | ESCC | 2.33e-06 | 7.08e-01 | 0.1662 |
| 4351 | MPI | P20T-E | Human | Esophagus | ESCC | 3.58e-06 | 1.09e-01 | 0.1124 |
| 4351 | MPI | P21T-E | Human | Esophagus | ESCC | 3.24e-11 | 2.14e-01 | 0.1617 |
| Page: 1 2 3 4 |
| Tissue | Expression Dynamics | Abbreviation |
| Esophagus | 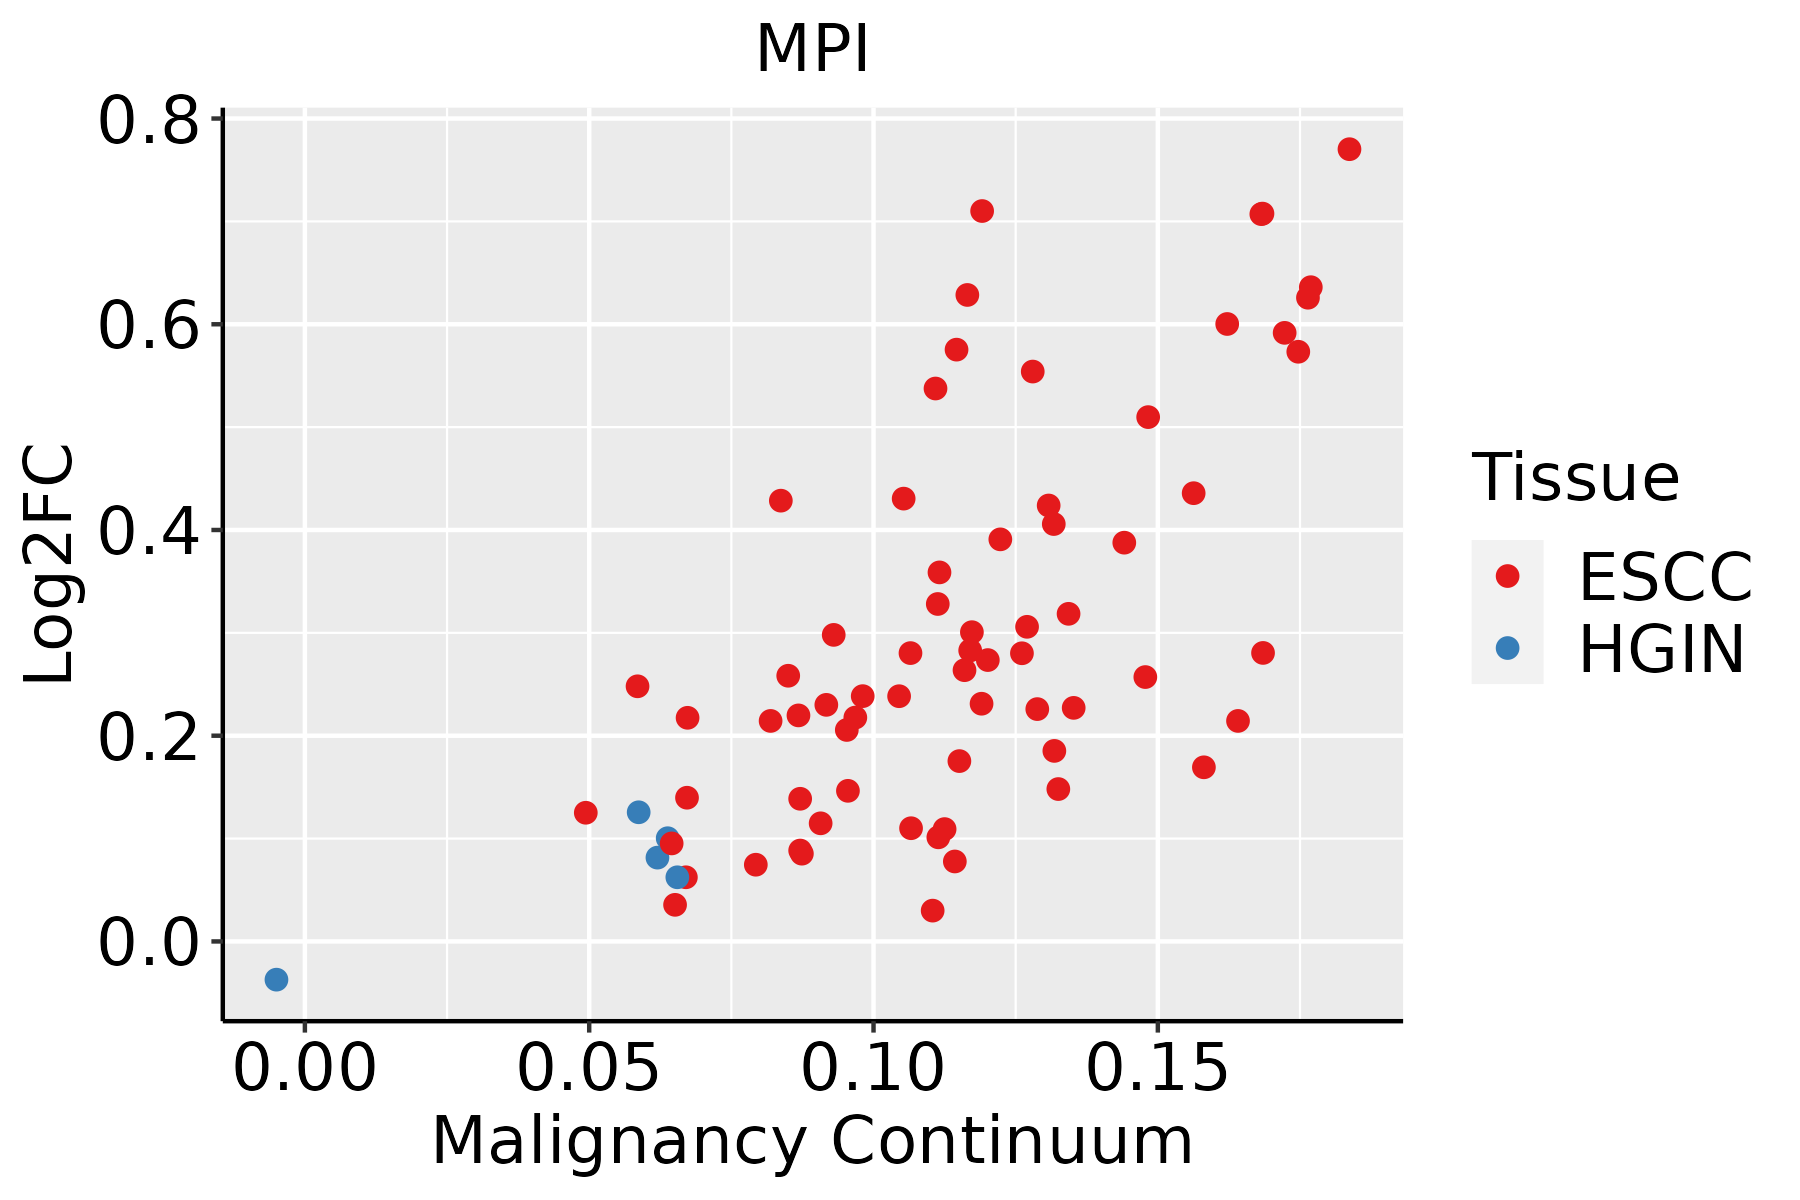 | ESCC: Esophageal squamous cell carcinoma |
| HGIN: High-grade intraepithelial neoplasias | ||
| LGIN: Low-grade intraepithelial neoplasias | ||
| Liver |  | HCC: Hepatocellular carcinoma |
| NAFLD: Non-alcoholic fatty liver disease | ||
| Oral Cavity | 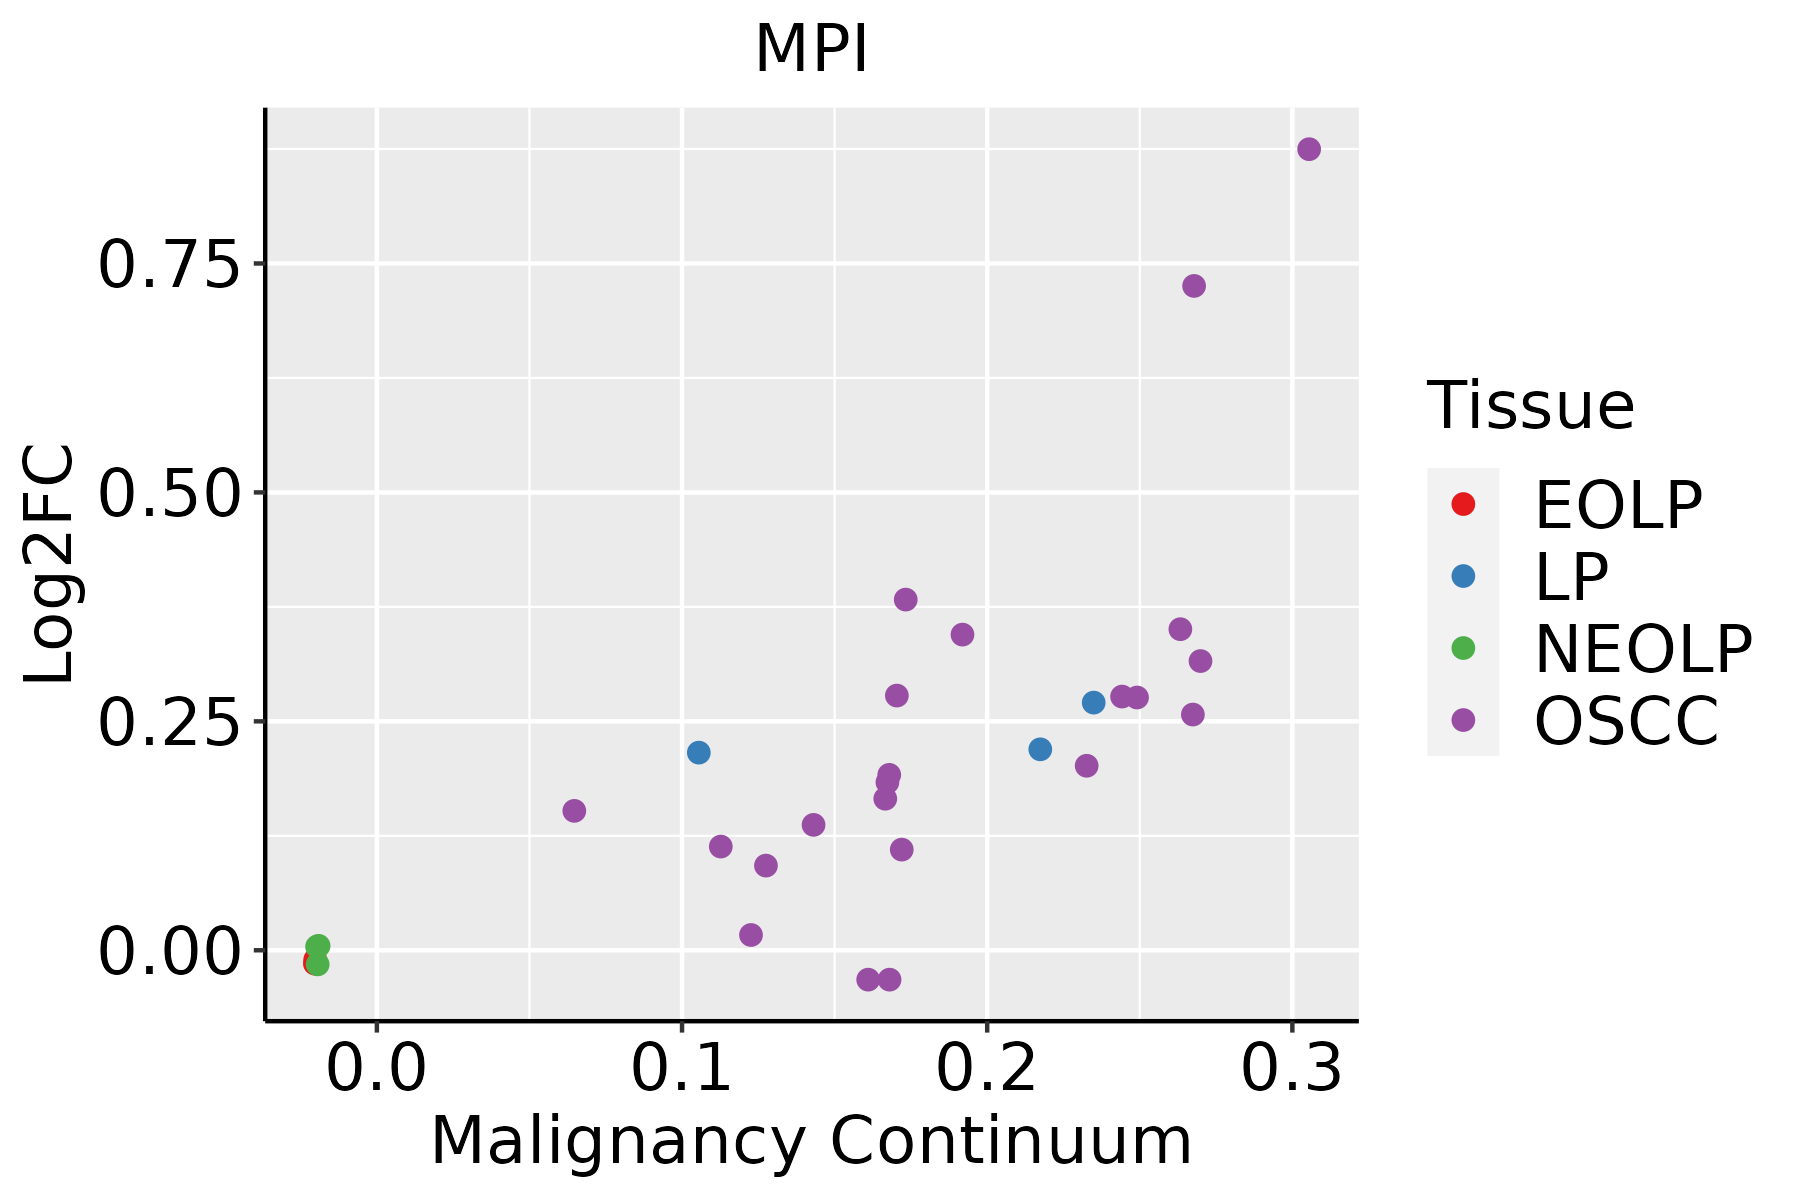 | EOLP: Erosive Oral lichen planus |
| LP: leukoplakia | ||
| NEOLP: Non-erosive oral lichen planus | ||
| OSCC: Oral squamous cell carcinoma |
| ∗log2FC in expression of this searched gene in stem-like cells from each diseased tissue sample relative to stem-like cells in normal samples in each tissue plotted against the malignancy continuum. Samples are colored based on if they are from different disease stage. |
Top |
Malignant transformation related pathway analysis |
| Find out the enriched GO biological processes and KEGG pathways involved in transition from healthy to precancer to cancer |
| Tissue | Disease Stage | Enriched GO biological Processes |
| Colorectum | AD |  |
| Colorectum | SER |  |
| Colorectum | MSS |  |
| Colorectum | MSI-H |  |
| Colorectum | FAP |  |
| ∗Top 15 enriched GO BP terms are showed in the bar plot of each disease state in each tissue. Each row represents a significant GO biological process which is colored according to the -log10(p.adjust). |
| Page: 1 2 3 4 5 6 7 8 9 |
| GO ID | Tissue | Disease Stage | Description | Gene Ratio | Bg Ratio | pvalue | p.adjust | Count |
| GO:00059969 | Esophagus | ESCC | monosaccharide metabolic process | 159/8552 | 257/18723 | 1.11e-07 | 1.81e-06 | 159 |
| GO:00193189 | Esophagus | ESCC | hexose metabolic process | 147/8552 | 237/18723 | 2.63e-07 | 3.94e-06 | 147 |
| GO:00091002 | Esophagus | ESCC | glycoprotein metabolic process | 226/8552 | 387/18723 | 2.64e-07 | 3.94e-06 | 226 |
| GO:00700854 | Esophagus | ESCC | glycosylation | 144/8552 | 240/18723 | 5.12e-06 | 5.38e-05 | 144 |
| GO:00064865 | Esophagus | ESCC | protein glycosylation | 135/8552 | 226/18723 | 1.36e-05 | 1.24e-04 | 135 |
| GO:00434135 | Esophagus | ESCC | macromolecule glycosylation | 135/8552 | 226/18723 | 1.36e-05 | 1.24e-04 | 135 |
| GO:00092256 | Esophagus | ESCC | nucleotide-sugar metabolic process | 29/8552 | 36/18723 | 1.91e-05 | 1.67e-04 | 29 |
| GO:00091012 | Esophagus | ESCC | glycoprotein biosynthetic process | 181/8552 | 317/18723 | 2.54e-05 | 2.15e-04 | 181 |
| GO:00092262 | Esophagus | ESCC | nucleotide-sugar biosynthetic process | 14/8552 | 19/18723 | 1.27e-02 | 4.21e-02 | 14 |
| GO:000599621 | Liver | HCC | monosaccharide metabolic process | 167/7958 | 257/18723 | 2.31e-13 | 1.25e-11 | 167 |
| GO:001931821 | Liver | HCC | hexose metabolic process | 155/7958 | 237/18723 | 7.63e-13 | 3.90e-11 | 155 |
| GO:00064862 | Liver | HCC | protein glycosylation | 122/7958 | 226/18723 | 3.11e-04 | 2.21e-03 | 122 |
| GO:00434132 | Liver | HCC | macromolecule glycosylation | 122/7958 | 226/18723 | 3.11e-04 | 2.21e-03 | 122 |
| GO:00700852 | Liver | HCC | glycosylation | 128/7958 | 240/18723 | 4.35e-04 | 2.92e-03 | 128 |
| GO:00092254 | Liver | HCC | nucleotide-sugar metabolic process | 25/7958 | 36/18723 | 9.87e-04 | 5.71e-03 | 25 |
| GO:0009100 | Liver | HCC | glycoprotein metabolic process | 193/7958 | 387/18723 | 1.89e-03 | 9.62e-03 | 193 |
| GO:00092255 | Oral cavity | OSCC | nucleotide-sugar metabolic process | 26/7305 | 36/18723 | 5.44e-05 | 4.51e-04 | 26 |
| GO:00059968 | Oral cavity | OSCC | monosaccharide metabolic process | 129/7305 | 257/18723 | 1.63e-04 | 1.13e-03 | 129 |
| GO:00091001 | Oral cavity | OSCC | glycoprotein metabolic process | 185/7305 | 387/18723 | 2.37e-04 | 1.54e-03 | 185 |
| GO:00193188 | Oral cavity | OSCC | hexose metabolic process | 118/7305 | 237/18723 | 4.53e-04 | 2.73e-03 | 118 |
| Page: 1 2 |
| Pathway ID | Tissue | Disease Stage | Description | Gene Ratio | Bg Ratio | pvalue | p.adjust | qvalue | Count |
| hsa012405 | Esophagus | ESCC | Biosynthesis of cofactors | 97/4205 | 153/8465 | 3.88e-04 | 1.35e-03 | 6.94e-04 | 97 |
| hsa012505 | Esophagus | ESCC | Biosynthesis of nucleotide sugars | 28/4205 | 37/8465 | 1.10e-03 | 3.42e-03 | 1.75e-03 | 28 |
| hsa005202 | Esophagus | ESCC | Amino sugar and nucleotide sugar metabolism | 35/4205 | 49/8465 | 1.60e-03 | 4.88e-03 | 2.50e-03 | 35 |
| hsa000512 | Esophagus | ESCC | Fructose and mannose metabolism | 24/4205 | 34/8465 | 1.09e-02 | 2.51e-02 | 1.29e-02 | 24 |
| hsa0124012 | Esophagus | ESCC | Biosynthesis of cofactors | 97/4205 | 153/8465 | 3.88e-04 | 1.35e-03 | 6.94e-04 | 97 |
| hsa0125012 | Esophagus | ESCC | Biosynthesis of nucleotide sugars | 28/4205 | 37/8465 | 1.10e-03 | 3.42e-03 | 1.75e-03 | 28 |
| hsa0052011 | Esophagus | ESCC | Amino sugar and nucleotide sugar metabolism | 35/4205 | 49/8465 | 1.60e-03 | 4.88e-03 | 2.50e-03 | 35 |
| hsa0005111 | Esophagus | ESCC | Fructose and mannose metabolism | 24/4205 | 34/8465 | 1.09e-02 | 2.51e-02 | 1.29e-02 | 24 |
| hsa012402 | Liver | HCC | Biosynthesis of cofactors | 103/4020 | 153/8465 | 4.67e-07 | 5.05e-06 | 2.81e-06 | 103 |
| hsa012403 | Liver | HCC | Biosynthesis of cofactors | 103/4020 | 153/8465 | 4.67e-07 | 5.05e-06 | 2.81e-06 | 103 |
| hsa00520 | Oral cavity | OSCC | Amino sugar and nucleotide sugar metabolism | 34/3704 | 49/8465 | 2.48e-04 | 8.08e-04 | 4.11e-04 | 34 |
| hsa012404 | Oral cavity | OSCC | Biosynthesis of cofactors | 88/3704 | 153/8465 | 3.84e-04 | 1.20e-03 | 6.12e-04 | 88 |
| hsa012504 | Oral cavity | OSCC | Biosynthesis of nucleotide sugars | 25/3704 | 37/8465 | 2.93e-03 | 7.49e-03 | 3.81e-03 | 25 |
| hsa005201 | Oral cavity | OSCC | Amino sugar and nucleotide sugar metabolism | 34/3704 | 49/8465 | 2.48e-04 | 8.08e-04 | 4.11e-04 | 34 |
| hsa0124011 | Oral cavity | OSCC | Biosynthesis of cofactors | 88/3704 | 153/8465 | 3.84e-04 | 1.20e-03 | 6.12e-04 | 88 |
| hsa0125011 | Oral cavity | OSCC | Biosynthesis of nucleotide sugars | 25/3704 | 37/8465 | 2.93e-03 | 7.49e-03 | 3.81e-03 | 25 |
| Page: 1 |
Top |
Cell-cell communication analysis |
| Identification of potential cell-cell interactions between two cell types and their ligand-receptor pairs for different disease states |
| Ligand | Receptor | LRpair | Pathway | Tissue | Disease Stage |
| Page: 1 |
Top |
Single-cell gene regulatory network inference analysis |
| Find out the significant the regulons (TFs) and the target genes of each regulon across cell types for different disease states |
| TF | Cell Type | Tissue | Disease Stage | Target Gene | RSS | Regulon Activity |
| ∗The dot plots of a searched regulon are shown for all cell subpopulations in each disease state of each tissue based on the regulon specific score inferred using pySCENIC and by calculating the average expression. |
| Page: 1 |
Top |
Somatic mutation of malignant transformation related genes |
| Annotation of somatic variants for genes involved in malignant transformation |
| Hugo Symbol | Variant Class | Variant Classification | dbSNP RS | HGVSc | HGVSp | HGVSp Short | SWISSPROT | BIOTYPE | SIFT | PolyPhen | Tumor Sample Barcode | Tissue | Histology | Sex | Age | Stage | Therapy Types | Drugs | Outcome |
| MPI | SNV | Missense_Mutation | c.409N>C | p.Glu137Gln | p.E137Q | P34949 | protein_coding | deleterious(0) | probably_damaging(1) | TCGA-C8-A26V-01 | Breast | breast invasive carcinoma | Female | <65 | III/IV | Hormone Therapy | tamoxiphen | CR | |
| MPI | SNV | Missense_Mutation | novel | c.460N>C | p.Val154Leu | p.V154L | P34949 | protein_coding | tolerated(0.32) | benign(0.001) | TCGA-E2-A14R-01 | Breast | breast invasive carcinoma | Female | <65 | I/II | Chemotherapy | doxorubicin | PD |
| MPI | SNV | Missense_Mutation | rs863225087 | c.1253N>A | p.Arg418His | p.R418H | P34949 | protein_coding | deleterious(0) | probably_damaging(0.985) | TCGA-E9-A1R5-01 | Breast | breast invasive carcinoma | Female | <65 | I/II | Hormone Therapy | tamoxiphen | SD |
| MPI | SNV | Missense_Mutation | c.355N>A | p.Glu119Lys | p.E119K | P34949 | protein_coding | tolerated(0.27) | benign(0.021) | TCGA-GM-A2DO-01 | Breast | breast invasive carcinoma | Female | <65 | I/II | Hormone Therapy | tamoxiphen | CR | |
| MPI | insertion | Frame_Shift_Ins | novel | c.651_652insCCGGCTCTTTGGTTAGGGCTGGGATGGAAAGGTGTCCTCC | p.Lys218ProfsTer44 | p.K218Pfs*44 | P34949 | protein_coding | TCGA-AO-A03P-01 | Breast | breast invasive carcinoma | Female | <65 | I/II | Hormone Therapy | letrozole | PD | ||
| MPI | deletion | Frame_Shift_Del | novel | c.244delN | p.Leu82TrpfsTer77 | p.L82Wfs*77 | P34949 | protein_coding | TCGA-D8-A27V-01 | Breast | breast invasive carcinoma | Female | <65 | I/II | Hormone Therapy | tamoxiphen | SD | ||
| MPI | SNV | Missense_Mutation | rs781643554 | c.1117G>A | p.Val373Ile | p.V373I | P34949 | protein_coding | tolerated(0.94) | benign(0.034) | TCGA-AA-3510-01 | Colorectum | colon adenocarcinoma | Male | >=65 | I/II | Unknown | Unknown | SD |
| MPI | SNV | Missense_Mutation | c.23N>A | p.Pro8Gln | p.P8Q | P34949 | protein_coding | tolerated(0.07) | benign(0.043) | TCGA-AA-A022-01 | Colorectum | colon adenocarcinoma | Female | >=65 | I/II | Unknown | Unknown | SD | |
| MPI | SNV | Missense_Mutation | c.1016N>G | p.Asp339Gly | p.D339G | P34949 | protein_coding | tolerated(0.07) | benign(0.148) | TCGA-CM-5348-01 | Colorectum | colon adenocarcinoma | Male | >=65 | III/IV | Unknown | Unknown | SD | |
| MPI | insertion | Frame_Shift_Ins | novel | c.1016_1017insC | p.Val342CysfsTer17 | p.V342Cfs*17 | P34949 | protein_coding | TCGA-AD-5900-01 | Colorectum | colon adenocarcinoma | Male | >=65 | I/II | Unknown | Unknown | SD |
| Page: 1 2 3 4 |
Top |
Related drugs of malignant transformation related genes |
| Identification of chemicals and drugs interact with genes involved in malignant transfromation |
| (DGIdb 4.0) |
| Entrez ID | Symbol | Category | Interaction Types | Drug Claim Name | Drug Name | PMIDs |
| 4351 | MPI | ENZYME, DRUGGABLE GENOME | GNF-PF-5134 | CHEMBL602969 | ||
| 4351 | MPI | ENZYME, DRUGGABLE GENOME | DNDI1417614 | CHEMBL1567571 | ||
| 4351 | MPI | ENZYME, DRUGGABLE GENOME | EBSELEN | EBSELEN | ||
| 4351 | MPI | ENZYME, DRUGGABLE GENOME | APOMORPHINE HYDROCHLORIDE HEMIHYDRATE | APOMORPHINE HYDROCHLORIDE HEMIHYDRATE | ||
| 4351 | MPI | ENZYME, DRUGGABLE GENOME | HAEMATOXYLIN | HAEMATOXYLIN | ||
| 4351 | MPI | ENZYME, DRUGGABLE GENOME | 4-HYDROXYESTRADIOL | CHEMBL1412489 | ||
| 4351 | MPI | ENZYME, DRUGGABLE GENOME | NSC-19803 | CHEMBL522983 | ||
| 4351 | MPI | ENZYME, DRUGGABLE GENOME | TCMDC-125319 | CHEMBL527586 | ||
| 4351 | MPI | ENZYME, DRUGGABLE GENOME | NSC-66209 | CHEMBL175266 | ||
| 4351 | MPI | ENZYME, DRUGGABLE GENOME | SJ000029642 | CHEMBL591126 |
| Page: 1 2 |

Copyright 2023-Present -The University of Texas Health Science Center at Houston |