
|
|||||
|
 | |
| |
| |
| |
| |
| |
|
Gene: MPG |
Gene summary for MPG |
| Gene information | Species | Human | Gene symbol | MPG | Gene ID | 4350 |
| Gene name | N-methylpurine DNA glycosylase | |
| Gene Alias | AAG | |
| Cytomap | 16p13.3 | |
| Gene Type | protein-coding | GO ID | GO:0006139 | UniProtAcc | P29372 |
Top |
Malignant transformation analysis |
| Identification of the aberrant gene expression in precancerous and cancerous lesions by comparing the gene expression of stem-like cells in diseased tissues with normal stem cells |
| Entrez ID | Symbol | Replicates | Species | Organ | Tissue | Adj P-value | Log2FC | Malignancy |
| 4350 | MPG | LZE2T | Human | Esophagus | ESCC | 3.67e-03 | 7.08e-01 | 0.082 |
| 4350 | MPG | LZE4T | Human | Esophagus | ESCC | 1.97e-12 | 5.08e-01 | 0.0811 |
| 4350 | MPG | LZE5T | Human | Esophagus | ESCC | 4.47e-05 | 1.40e-01 | 0.0514 |
| 4350 | MPG | LZE7T | Human | Esophagus | ESCC | 4.31e-06 | 5.40e-01 | 0.0667 |
| 4350 | MPG | LZE8T | Human | Esophagus | ESCC | 4.47e-05 | 2.76e-01 | 0.067 |
| 4350 | MPG | LZE20T | Human | Esophagus | ESCC | 5.28e-06 | 2.77e-01 | 0.0662 |
| 4350 | MPG | LZE22T | Human | Esophagus | ESCC | 3.61e-04 | 4.94e-01 | 0.068 |
| 4350 | MPG | LZE24T | Human | Esophagus | ESCC | 3.12e-21 | 8.62e-01 | 0.0596 |
| 4350 | MPG | LZE21T | Human | Esophagus | ESCC | 2.59e-04 | 4.35e-01 | 0.0655 |
| 4350 | MPG | LZE6T | Human | Esophagus | ESCC | 1.02e-03 | 3.45e-01 | 0.0845 |
| 4350 | MPG | P1T-E | Human | Esophagus | ESCC | 1.73e-16 | 8.83e-01 | 0.0875 |
| 4350 | MPG | P2T-E | Human | Esophagus | ESCC | 3.24e-55 | 1.06e+00 | 0.1177 |
| 4350 | MPG | P4T-E | Human | Esophagus | ESCC | 2.09e-16 | 5.33e-01 | 0.1323 |
| 4350 | MPG | P5T-E | Human | Esophagus | ESCC | 3.64e-41 | 9.67e-01 | 0.1327 |
| 4350 | MPG | P8T-E | Human | Esophagus | ESCC | 2.71e-51 | 9.26e-01 | 0.0889 |
| 4350 | MPG | P9T-E | Human | Esophagus | ESCC | 6.79e-27 | 6.97e-01 | 0.1131 |
| 4350 | MPG | P10T-E | Human | Esophagus | ESCC | 5.61e-47 | 1.00e+00 | 0.116 |
| 4350 | MPG | P11T-E | Human | Esophagus | ESCC | 3.97e-16 | 8.53e-01 | 0.1426 |
| 4350 | MPG | P12T-E | Human | Esophagus | ESCC | 4.33e-64 | 1.20e+00 | 0.1122 |
| 4350 | MPG | P15T-E | Human | Esophagus | ESCC | 4.36e-47 | 1.21e+00 | 0.1149 |
| Page: 1 2 3 4 5 6 7 |
| Tissue | Expression Dynamics | Abbreviation |
| Esophagus |  | ESCC: Esophageal squamous cell carcinoma |
| HGIN: High-grade intraepithelial neoplasias | ||
| LGIN: Low-grade intraepithelial neoplasias | ||
| Liver |  | HCC: Hepatocellular carcinoma |
| NAFLD: Non-alcoholic fatty liver disease | ||
| Oral Cavity | 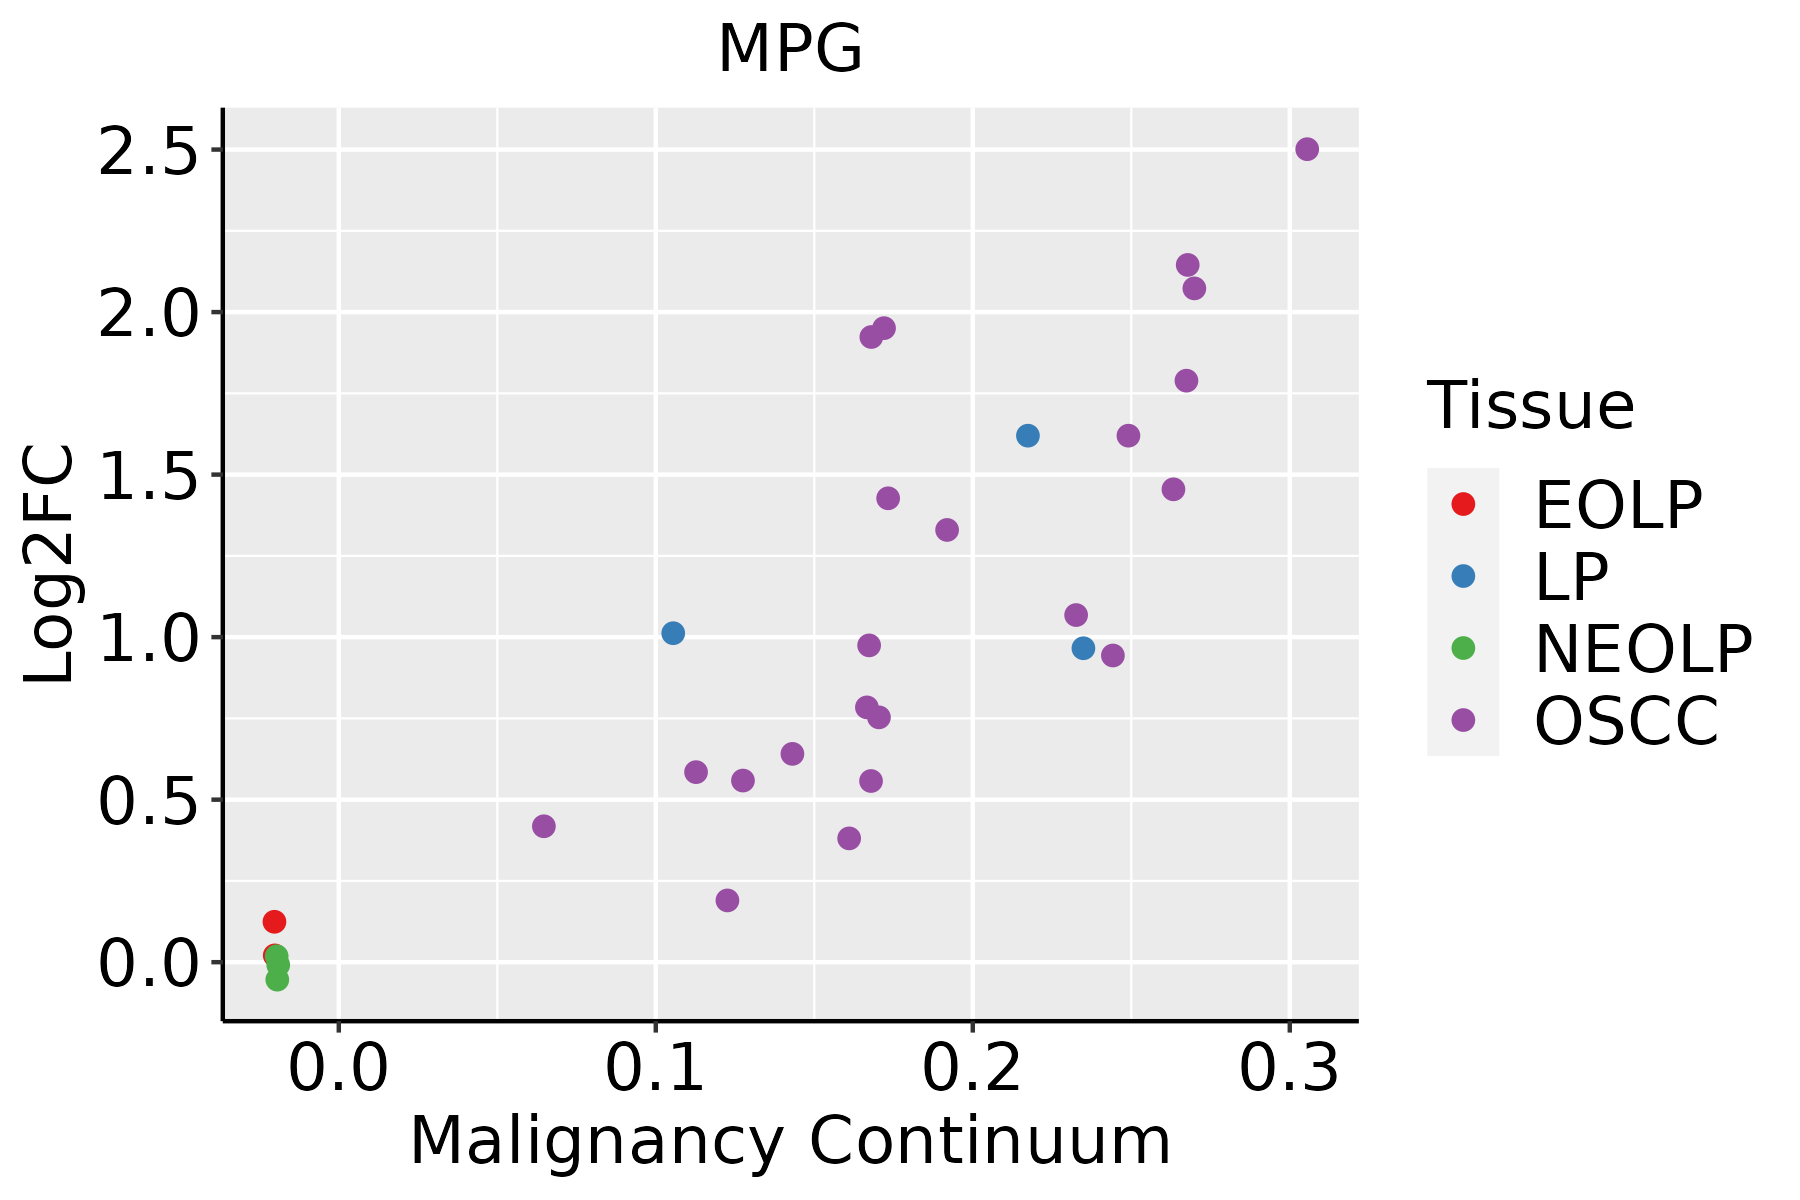 | EOLP: Erosive Oral lichen planus |
| LP: leukoplakia | ||
| NEOLP: Non-erosive oral lichen planus | ||
| OSCC: Oral squamous cell carcinoma | ||
| Prostate | 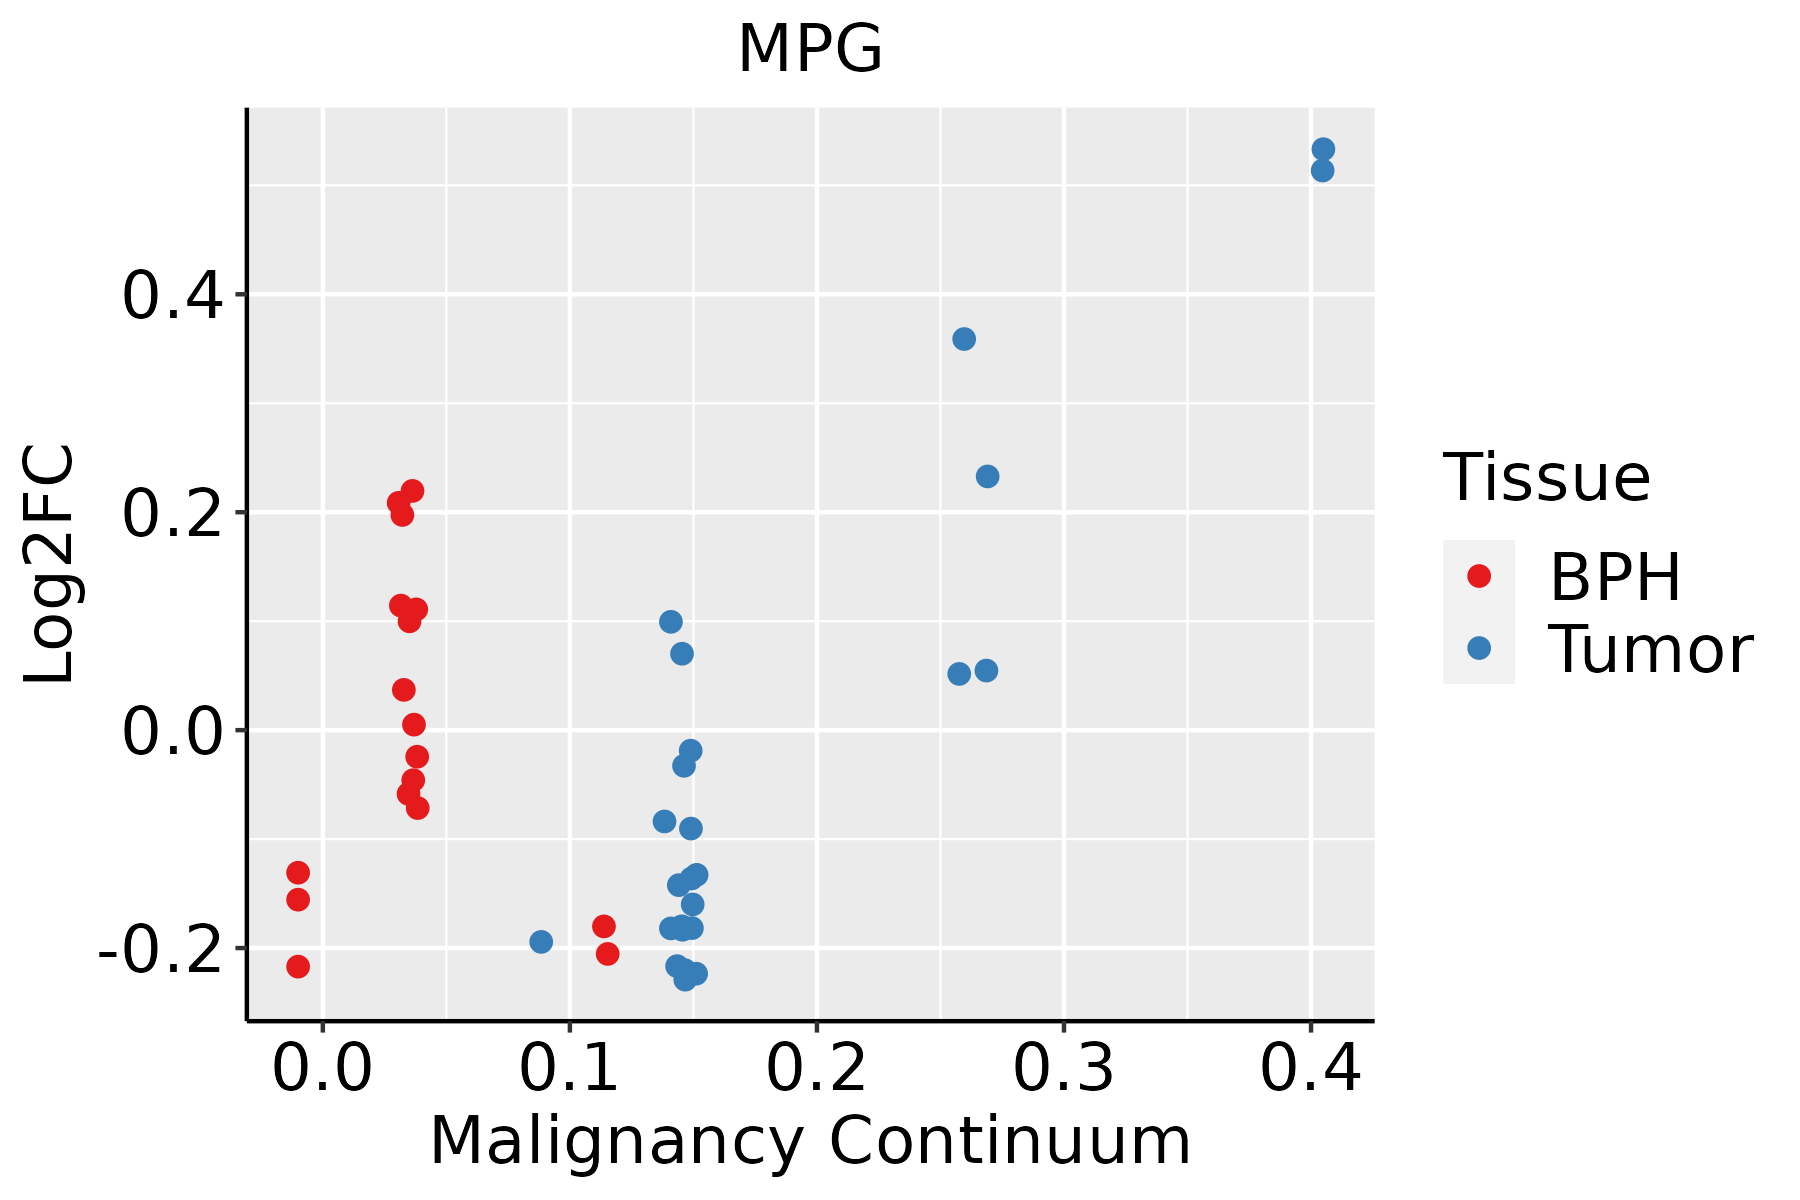 | BPH: Benign Prostatic Hyperplasia |
| Skin | 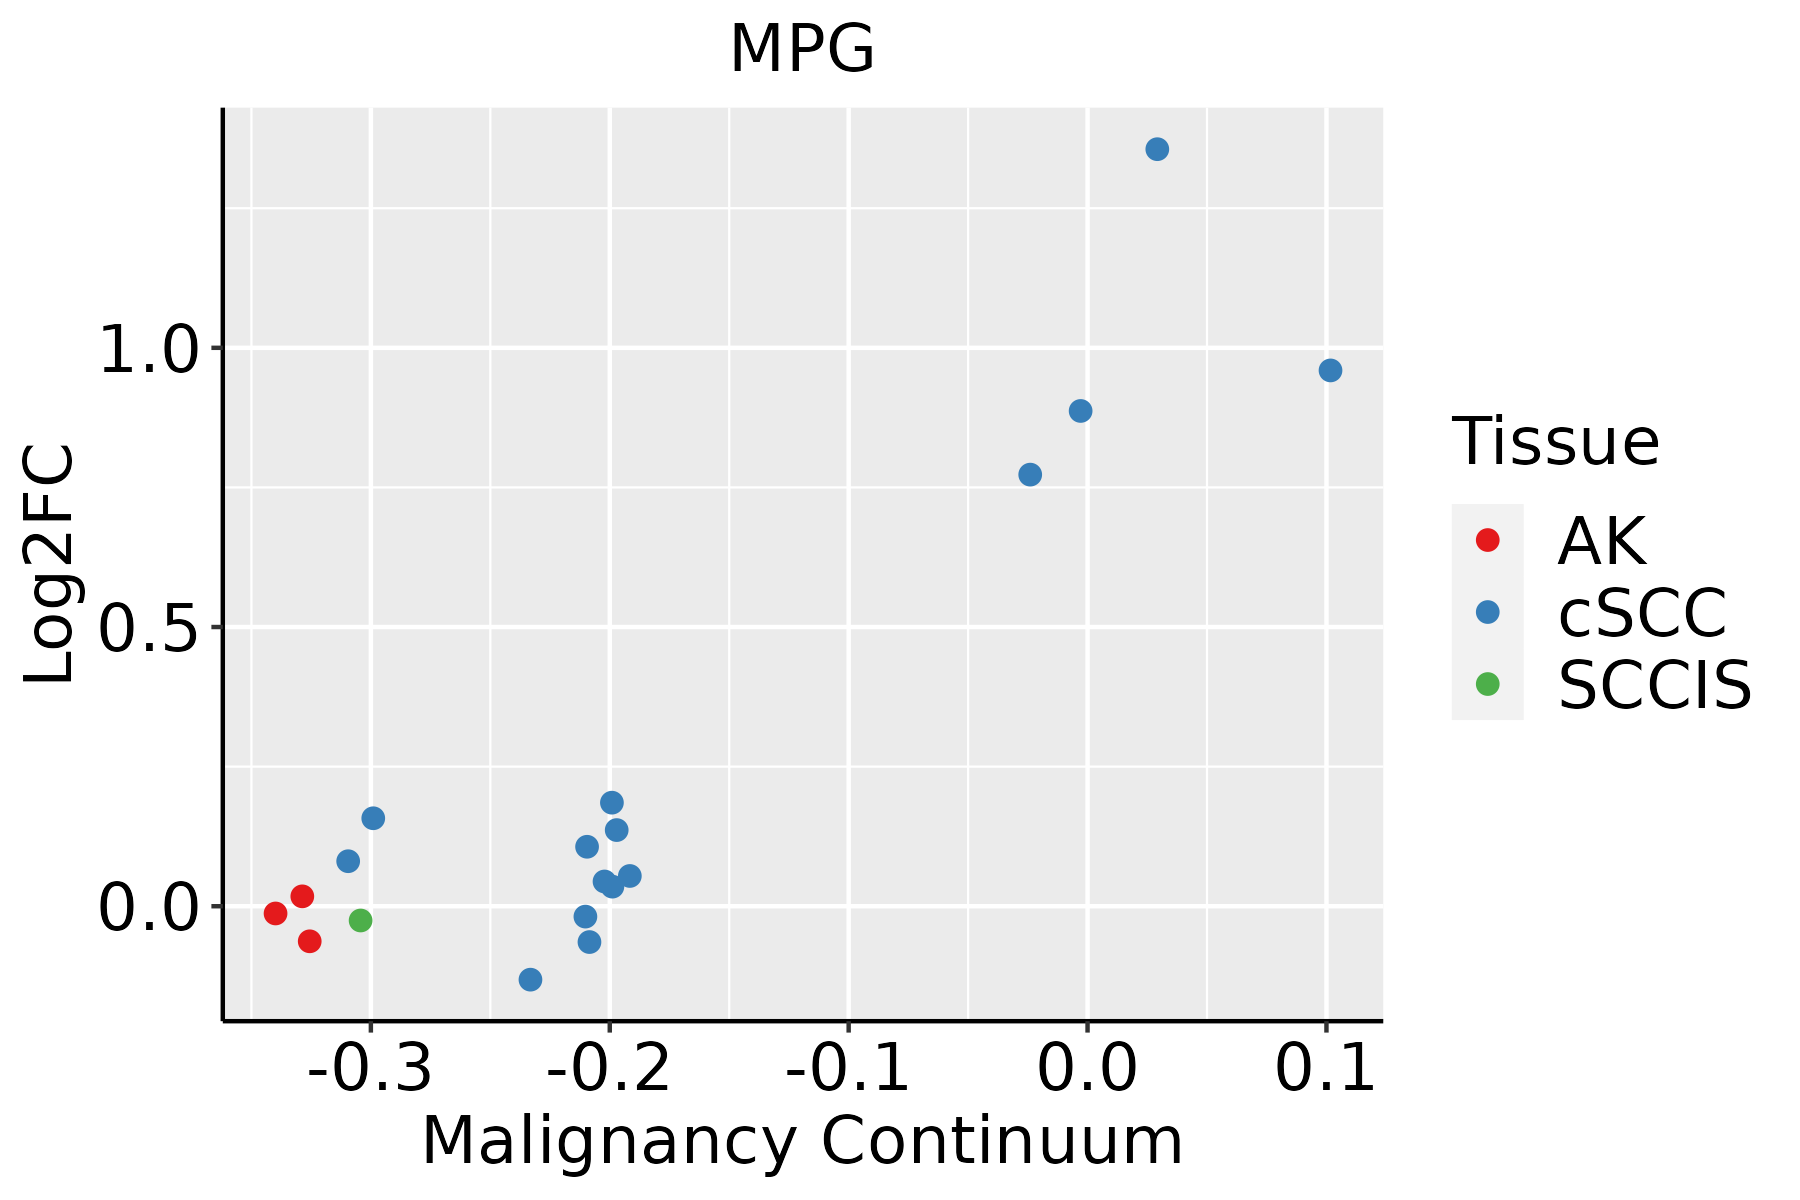 | AK: Actinic keratosis |
| cSCC: Cutaneous squamous cell carcinoma | ||
| SCCIS:squamous cell carcinoma in situ | ||
| Thyroid | 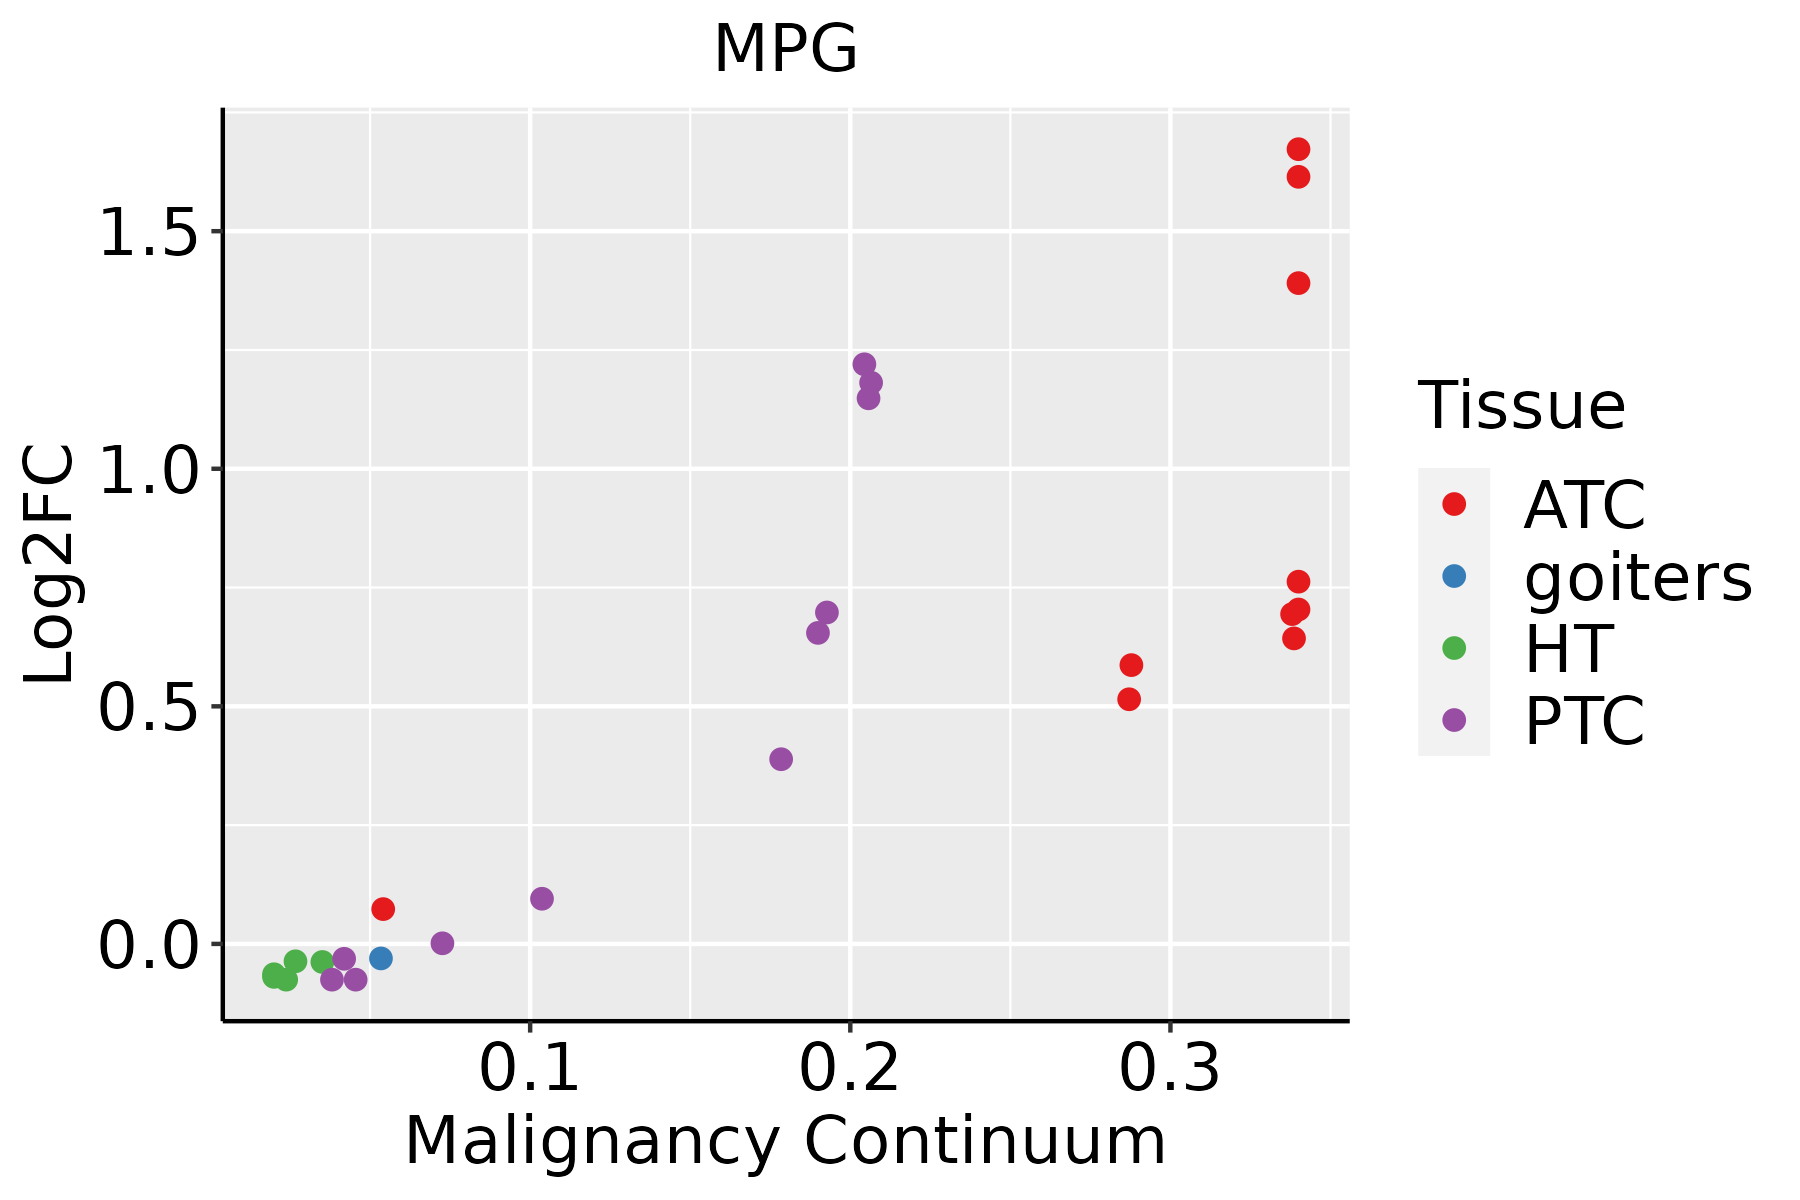 | ATC: Anaplastic thyroid cancer |
| HT: Hashimoto's thyroiditis | ||
| PTC: Papillary thyroid cancer |
| ∗log2FC in expression of this searched gene in stem-like cells from each diseased tissue sample relative to stem-like cells in normal samples in each tissue plotted against the malignancy continuum. Samples are colored based on if they are from different disease stage. |
Top |
Malignant transformation related pathway analysis |
| Find out the enriched GO biological processes and KEGG pathways involved in transition from healthy to precancer to cancer |
| Tissue | Disease Stage | Enriched GO biological Processes |
| Colorectum | AD |  |
| Colorectum | SER |  |
| Colorectum | MSS |  |
| Colorectum | MSI-H |  |
| Colorectum | FAP |  |
| ∗Top 15 enriched GO BP terms are showed in the bar plot of each disease state in each tissue. Each row represents a significant GO biological process which is colored according to the -log10(p.adjust). |
| Page: 1 2 3 4 5 6 7 8 9 |
| GO ID | Tissue | Disease Stage | Description | Gene Ratio | Bg Ratio | pvalue | p.adjust | Count |
| GO:00062843 | Esophagus | ESCC | base-excision repair | 33/8552 | 43/18723 | 3.25e-05 | 2.69e-04 | 33 |
| GO:0006304 | Esophagus | ESCC | DNA modification | 68/8552 | 120/18723 | 9.95e-03 | 3.42e-02 | 68 |
| GO:0006284 | Liver | HCC | base-excision repair | 27/7958 | 43/18723 | 5.79e-03 | 2.40e-02 | 27 |
| GO:00062842 | Oral cavity | OSCC | base-excision repair | 28/7305 | 43/18723 | 4.71e-04 | 2.79e-03 | 28 |
| GO:00062841 | Oral cavity | LP | base-excision repair | 19/4623 | 43/18723 | 4.04e-03 | 2.61e-02 | 19 |
| Page: 1 |
| Pathway ID | Tissue | Disease Stage | Description | Gene Ratio | Bg Ratio | pvalue | p.adjust | qvalue | Count |
| hsa034104 | Esophagus | ESCC | Base excision repair | 38/4205 | 44/8465 | 3.59e-07 | 2.62e-06 | 1.34e-06 | 38 |
| hsa0341011 | Esophagus | ESCC | Base excision repair | 38/4205 | 44/8465 | 3.59e-07 | 2.62e-06 | 1.34e-06 | 38 |
| hsa03410 | Oral cavity | OSCC | Base excision repair | 32/3704 | 44/8465 | 9.11e-05 | 3.25e-04 | 1.65e-04 | 32 |
| hsa034101 | Oral cavity | OSCC | Base excision repair | 32/3704 | 44/8465 | 9.11e-05 | 3.25e-04 | 1.65e-04 | 32 |
| hsa034102 | Oral cavity | LP | Base excision repair | 23/2418 | 44/8465 | 7.66e-04 | 3.75e-03 | 2.42e-03 | 23 |
| hsa034103 | Oral cavity | LP | Base excision repair | 23/2418 | 44/8465 | 7.66e-04 | 3.75e-03 | 2.42e-03 | 23 |
| Page: 1 |
Top |
Cell-cell communication analysis |
| Identification of potential cell-cell interactions between two cell types and their ligand-receptor pairs for different disease states |
| Ligand | Receptor | LRpair | Pathway | Tissue | Disease Stage |
| Page: 1 |
Top |
Single-cell gene regulatory network inference analysis |
| Find out the significant the regulons (TFs) and the target genes of each regulon across cell types for different disease states |
| TF | Cell Type | Tissue | Disease Stage | Target Gene | RSS | Regulon Activity |
| ∗The dot plots of a searched regulon are shown for all cell subpopulations in each disease state of each tissue based on the regulon specific score inferred using pySCENIC and by calculating the average expression. |
| Page: 1 |
Top |
Somatic mutation of malignant transformation related genes |
| Annotation of somatic variants for genes involved in malignant transformation |
| Hugo Symbol | Variant Class | Variant Classification | dbSNP RS | HGVSc | HGVSp | HGVSp Short | SWISSPROT | BIOTYPE | SIFT | PolyPhen | Tumor Sample Barcode | Tissue | Histology | Sex | Age | Stage | Therapy Types | Drugs | Outcome |
| MPG | SNV | Missense_Mutation | c.140G>C | p.Ser47Thr | p.S47T | P29372 | protein_coding | tolerated_low_confidence(0.07) | benign(0.005) | TCGA-AO-A1KR-01 | Breast | breast invasive carcinoma | Female | <65 | I/II | Chemotherapy | cyclophosphamide | SD | |
| MPG | SNV | Missense_Mutation | rs2308313 | c.358N>T | p.Arg120Cys | p.R120C | P29372 | protein_coding | tolerated(0.06) | benign(0.391) | TCGA-S3-AA12-01 | Breast | breast invasive carcinoma | Female | >=65 | III/IV | Hormone Therapy | anastrozole | SD |
| MPG | insertion | Frame_Shift_Ins | novel | c.433dupC | p.Arg145ProfsTer88 | p.R145Pfs*88 | P29372 | protein_coding | TCGA-BH-A18G-01 | Breast | breast invasive carcinoma | Female | >=65 | I/II | Unknown | Unknown | SD | ||
| MPG | deletion | Frame_Shift_Del | novel | c.513delC | p.Ser172AlafsTer85 | p.S172Afs*85 | P29372 | protein_coding | TCGA-EW-A2FV-01 | Breast | breast invasive carcinoma | Female | <65 | III/IV | Chemotherapy | docetaxel | SD | ||
| MPG | SNV | Missense_Mutation | novel | c.877G>A | p.Glu293Lys | p.E293K | P29372 | protein_coding | deleterious(0.01) | probably_damaging(0.999) | TCGA-VS-A952-01 | Cervix | cervical & endocervical cancer | Female | >=65 | I/II | Unknown | Unknown | SD |
| MPG | insertion | Frame_Shift_Ins | novel | c.199_200insAC | p.Thr67AsnfsTer42 | p.T67Nfs*42 | P29372 | protein_coding | TCGA-DS-A1OB-01 | Cervix | cervical & endocervical cancer | Female | <65 | I/II | Chemotherapy | carboplatin | PD | ||
| MPG | SNV | Missense_Mutation | novel | c.640N>T | p.Leu214Phe | p.L214F | P29372 | protein_coding | deleterious(0) | probably_damaging(0.998) | TCGA-AZ-4315-01 | Colorectum | colon adenocarcinoma | Male | <65 | I/II | Unknown | Unknown | SD |
| MPG | SNV | Missense_Mutation | c.760C>T | p.Pro254Ser | p.P254S | P29372 | protein_coding | tolerated(0.85) | benign(0.014) | TCGA-CK-4951-01 | Colorectum | colon adenocarcinoma | Female | >=65 | I/II | Unknown | Unknown | PD | |
| MPG | SNV | Missense_Mutation | c.299N>A | p.Arg100Gln | p.R100Q | P29372 | protein_coding | tolerated(0.24) | benign(0.007) | TCGA-QG-A5Z2-01 | Colorectum | colon adenocarcinoma | Male | <65 | I/II | Unknown | Unknown | SD | |
| MPG | SNV | Missense_Mutation | c.736C>T | p.Arg246Cys | p.R246C | P29372 | protein_coding | tolerated(0.09) | benign(0.047) | TCGA-WS-AB45-01 | Colorectum | colon adenocarcinoma | Female | <65 | I/II | Unknown | Unknown | SD |
| Page: 1 2 3 |
Top |
Related drugs of malignant transformation related genes |
| Identification of chemicals and drugs interact with genes involved in malignant transfromation |
| (DGIdb 4.0) |
| Entrez ID | Symbol | Category | Interaction Types | Drug Claim Name | Drug Name | PMIDs |
| Page: 1 |

Copyright 2023-Present -The University of Texas Health Science Center at Houston |