
|
|||||
|
 | |
| |
| |
| |
| |
| |
|
Gene: MPDZ |
Gene summary for MPDZ |
| Gene information | Species | Human | Gene symbol | MPDZ | Gene ID | 8777 |
| Gene name | multiple PDZ domain crumbs cell polarity complex component | |
| Gene Alias | HYC2 | |
| Cytomap | 9p23 | |
| Gene Type | protein-coding | GO ID | GO:0000226 | UniProtAcc | O75970 |
Top |
Malignant transformation analysis |
| Identification of the aberrant gene expression in precancerous and cancerous lesions by comparing the gene expression of stem-like cells in diseased tissues with normal stem cells |
| Entrez ID | Symbol | Replicates | Species | Organ | Tissue | Adj P-value | Log2FC | Malignancy |
| 8777 | MPDZ | NAFLD1 | Human | Liver | NAFLD | 1.26e-12 | 9.10e-01 | -0.04 |
| 8777 | MPDZ | S41 | Human | Liver | Cirrhotic | 5.82e-07 | 6.56e-01 | -0.0343 |
| 8777 | MPDZ | HCC1_Meng | Human | Liver | HCC | 2.12e-24 | -9.70e-02 | 0.0246 |
| 8777 | MPDZ | cirrhotic1 | Human | Liver | Cirrhotic | 2.31e-02 | -1.38e-01 | 0.0202 |
| 8777 | MPDZ | HCC2 | Human | Liver | HCC | 5.43e-15 | 3.78e+00 | 0.5341 |
| 8777 | MPDZ | Pt13.b | Human | Liver | HCC | 2.86e-02 | -2.17e-02 | 0.0251 |
| 8777 | MPDZ | HTA12-15-2 | Human | Pancreas | PDAC | 1.58e-04 | 3.63e-01 | 0.2315 |
| 8777 | MPDZ | HTA12-23-1 | Human | Pancreas | PDAC | 4.90e-04 | 7.18e-01 | 0.3405 |
| 8777 | MPDZ | HTA12-26-1 | Human | Pancreas | PDAC | 5.80e-13 | 7.12e-01 | 0.3728 |
| 8777 | MPDZ | HTA12-29-1 | Human | Pancreas | PDAC | 4.81e-29 | 6.35e-01 | 0.3722 |
| 8777 | MPDZ | male-WTA | Human | Thyroid | PTC | 1.73e-12 | 1.44e-01 | 0.1037 |
| 8777 | MPDZ | PTC01 | Human | Thyroid | PTC | 5.73e-10 | 1.77e-01 | 0.1899 |
| 8777 | MPDZ | PTC04 | Human | Thyroid | PTC | 1.88e-18 | 3.03e-01 | 0.1927 |
| 8777 | MPDZ | PTC05 | Human | Thyroid | PTC | 1.16e-09 | 4.88e-01 | 0.2065 |
| 8777 | MPDZ | PTC06 | Human | Thyroid | PTC | 2.41e-17 | 4.90e-01 | 0.2057 |
| 8777 | MPDZ | PTC07 | Human | Thyroid | PTC | 2.11e-29 | 4.16e-01 | 0.2044 |
| 8777 | MPDZ | ATC09 | Human | Thyroid | ATC | 8.79e-05 | 1.64e-01 | 0.2871 |
| 8777 | MPDZ | ATC11 | Human | Thyroid | ATC | 4.53e-07 | 3.38e-01 | 0.3386 |
| 8777 | MPDZ | ATC13 | Human | Thyroid | ATC | 1.41e-34 | 6.37e-01 | 0.34 |
| 8777 | MPDZ | ATC1 | Human | Thyroid | ATC | 2.07e-06 | 2.16e-01 | 0.2878 |
| Page: 1 2 |
| Tissue | Expression Dynamics | Abbreviation |
| Liver | 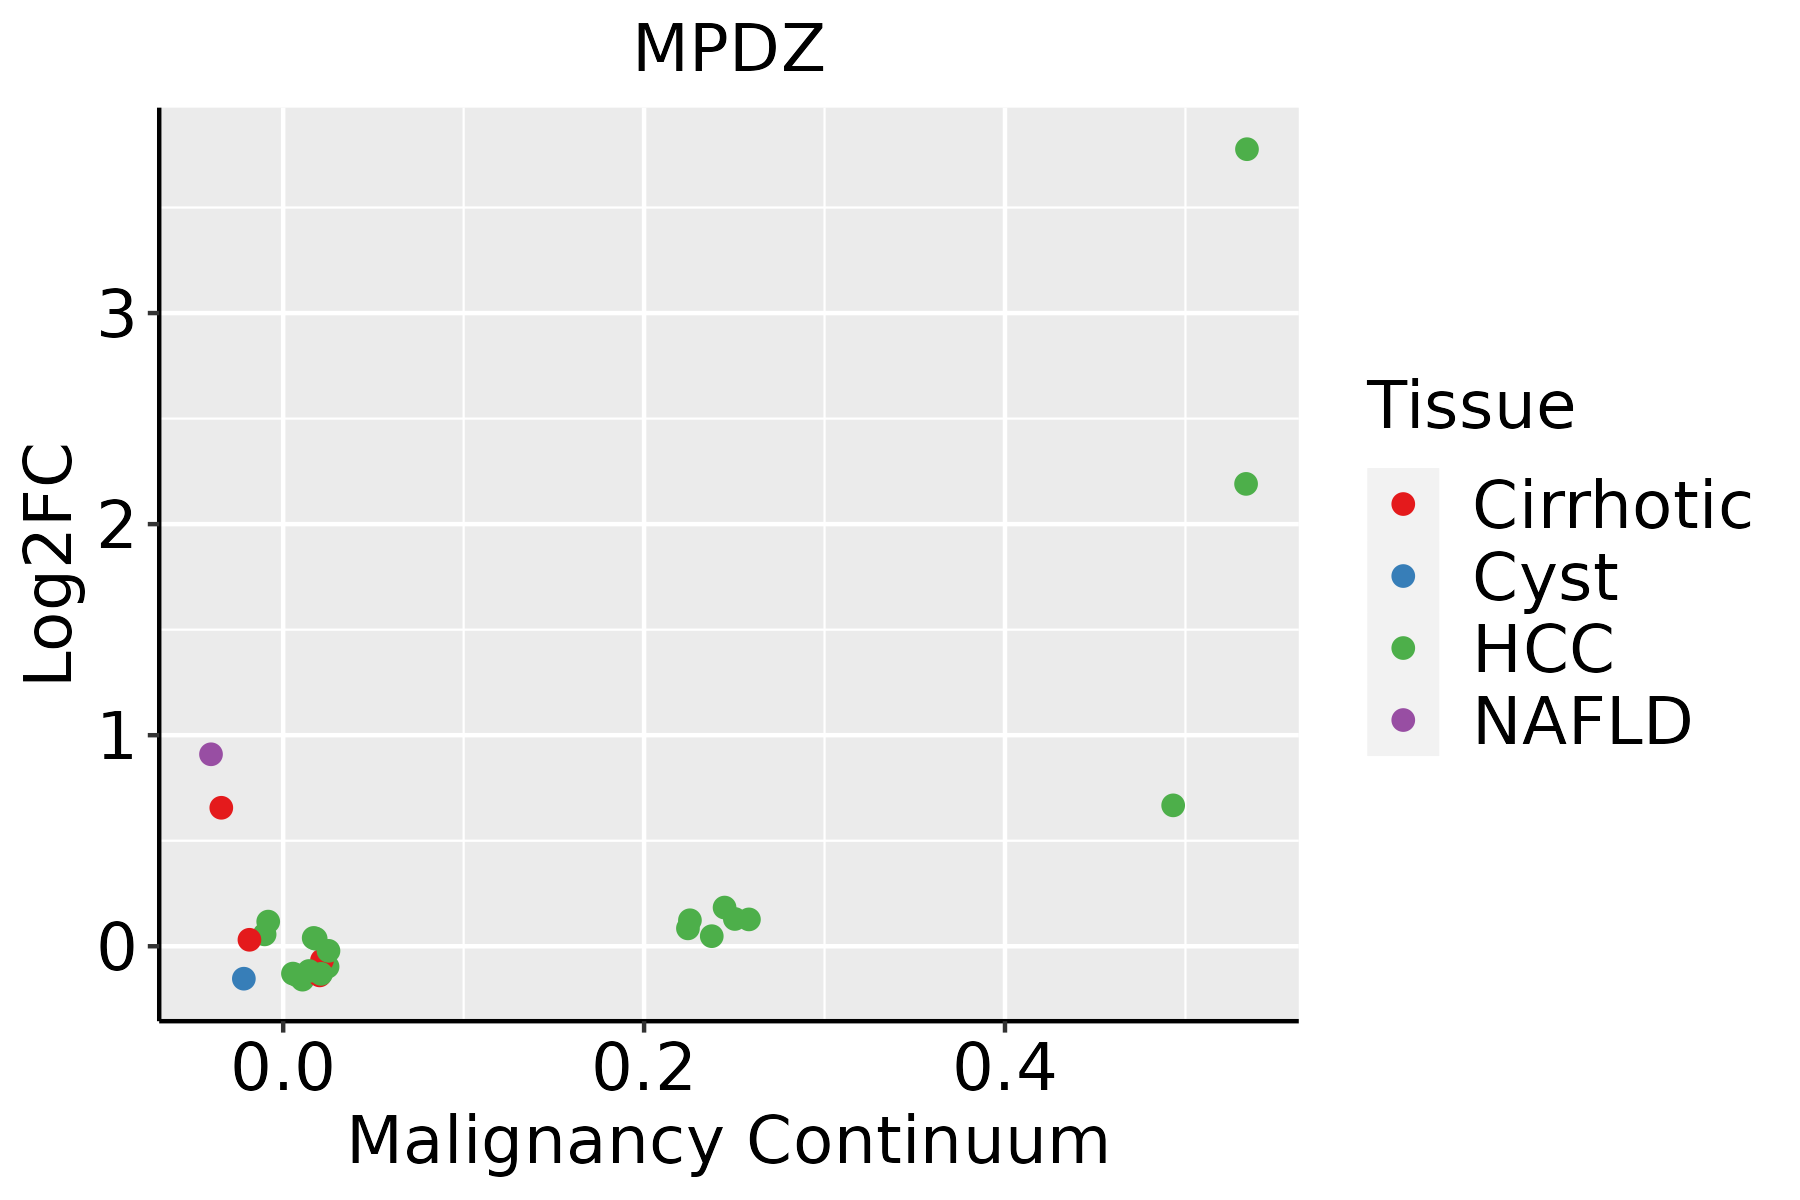 | HCC: Hepatocellular carcinoma |
| NAFLD: Non-alcoholic fatty liver disease | ||
| Thyroid |  | ATC: Anaplastic thyroid cancer |
| HT: Hashimoto's thyroiditis | ||
| PTC: Papillary thyroid cancer |
| ∗log2FC in expression of this searched gene in stem-like cells from each diseased tissue sample relative to stem-like cells in normal samples in each tissue plotted against the malignancy continuum. Samples are colored based on if they are from different disease stage. |
Top |
Malignant transformation related pathway analysis |
| Find out the enriched GO biological processes and KEGG pathways involved in transition from healthy to precancer to cancer |
| Tissue | Disease Stage | Enriched GO biological Processes |
| Colorectum | AD |  |
| Colorectum | SER |  |
| Colorectum | MSS |  |
| Colorectum | MSI-H |  |
| Colorectum | FAP |  |
| ∗Top 15 enriched GO BP terms are showed in the bar plot of each disease state in each tissue. Each row represents a significant GO biological process which is colored according to the -log10(p.adjust). |
| Page: 1 2 3 4 5 6 7 8 9 |
| GO ID | Tissue | Disease Stage | Description | Gene Ratio | Bg Ratio | pvalue | p.adjust | Count |
| GO:00343296 | Liver | NAFLD | cell junction assembly | 66/1882 | 420/18723 | 1.64e-04 | 3.00e-03 | 66 |
| GO:00452167 | Liver | NAFLD | cell-cell junction organization | 32/1882 | 200/18723 | 5.53e-03 | 4.23e-02 | 32 |
| GO:004521612 | Liver | Cirrhotic | cell-cell junction organization | 70/4634 | 200/18723 | 7.23e-04 | 5.36e-03 | 70 |
| GO:00070437 | Liver | Cirrhotic | cell-cell junction assembly | 50/4634 | 146/18723 | 6.23e-03 | 3.09e-02 | 50 |
| GO:00705072 | Liver | Cirrhotic | regulation of microtubule cytoskeleton organization | 50/4634 | 148/18723 | 8.33e-03 | 3.87e-02 | 50 |
| GO:007050711 | Liver | HCC | regulation of microtubule cytoskeleton organization | 88/7958 | 148/18723 | 2.28e-05 | 2.41e-04 | 88 |
| GO:0031023 | Liver | HCC | microtubule organizing center organization | 82/7958 | 143/18723 | 2.38e-04 | 1.79e-03 | 82 |
| GO:004521622 | Liver | HCC | cell-cell junction organization | 107/7958 | 200/18723 | 1.06e-03 | 6.11e-03 | 107 |
| GO:0032886 | Liver | HCC | regulation of microtubule-based process | 123/7958 | 240/18723 | 3.69e-03 | 1.64e-02 | 123 |
| GO:01201935 | Liver | HCC | tight junction organization | 45/7958 | 80/18723 | 9.02e-03 | 3.48e-02 | 45 |
| GO:01201925 | Liver | HCC | tight junction assembly | 42/7958 | 74/18723 | 9.32e-03 | 3.57e-02 | 42 |
| GO:000704312 | Liver | HCC | cell-cell junction assembly | 76/7958 | 146/18723 | 1.23e-02 | 4.47e-02 | 76 |
| GO:007050717 | Thyroid | PTC | regulation of microtubule cytoskeleton organization | 80/5968 | 148/18723 | 1.79e-08 | 4.19e-07 | 80 |
| GO:0034329111 | Thyroid | PTC | cell junction assembly | 180/5968 | 420/18723 | 1.17e-06 | 1.69e-05 | 180 |
| GO:0045216111 | Thyroid | PTC | cell-cell junction organization | 93/5968 | 200/18723 | 1.01e-05 | 1.12e-04 | 93 |
| GO:00328866 | Thyroid | PTC | regulation of microtubule-based process | 105/5968 | 240/18723 | 6.91e-05 | 6.03e-04 | 105 |
| GO:00310235 | Thyroid | PTC | microtubule organizing center organization | 65/5968 | 143/18723 | 4.48e-04 | 2.96e-03 | 65 |
| GO:0007043111 | Thyroid | PTC | cell-cell junction assembly | 64/5968 | 146/18723 | 1.56e-03 | 8.63e-03 | 64 |
| GO:012019317 | Thyroid | PTC | tight junction organization | 38/5968 | 80/18723 | 2.49e-03 | 1.29e-02 | 38 |
| GO:012019216 | Thyroid | PTC | tight junction assembly | 35/5968 | 74/18723 | 3.95e-03 | 1.89e-02 | 35 |
| Page: 1 2 |
| Pathway ID | Tissue | Disease Stage | Description | Gene Ratio | Bg Ratio | pvalue | p.adjust | qvalue | Count |
| hsa0453014 | Liver | NAFLD | Tight junction | 33/1043 | 169/8465 | 4.52e-03 | 4.12e-02 | 3.32e-02 | 33 |
| hsa0453015 | Liver | NAFLD | Tight junction | 33/1043 | 169/8465 | 4.52e-03 | 4.12e-02 | 3.32e-02 | 33 |
| hsa0453022 | Liver | Cirrhotic | Tight junction | 82/2530 | 169/8465 | 2.14e-07 | 2.85e-06 | 1.76e-06 | 82 |
| hsa0453032 | Liver | Cirrhotic | Tight junction | 82/2530 | 169/8465 | 2.14e-07 | 2.85e-06 | 1.76e-06 | 82 |
| hsa0453042 | Liver | HCC | Tight junction | 110/4020 | 169/8465 | 2.45e-06 | 2.28e-05 | 1.27e-05 | 110 |
| hsa0453052 | Liver | HCC | Tight junction | 110/4020 | 169/8465 | 2.45e-06 | 2.28e-05 | 1.27e-05 | 110 |
| Page: 1 |
Top |
Cell-cell communication analysis |
| Identification of potential cell-cell interactions between two cell types and their ligand-receptor pairs for different disease states |
| Ligand | Receptor | LRpair | Pathway | Tissue | Disease Stage |
| Page: 1 |
Top |
Single-cell gene regulatory network inference analysis |
| Find out the significant the regulons (TFs) and the target genes of each regulon across cell types for different disease states |
| TF | Cell Type | Tissue | Disease Stage | Target Gene | RSS | Regulon Activity |
| ∗The dot plots of a searched regulon are shown for all cell subpopulations in each disease state of each tissue based on the regulon specific score inferred using pySCENIC and by calculating the average expression. |
| Page: 1 |
Top |
Somatic mutation of malignant transformation related genes |
| Annotation of somatic variants for genes involved in malignant transformation |
| Hugo Symbol | Variant Class | Variant Classification | dbSNP RS | HGVSc | HGVSp | HGVSp Short | SWISSPROT | BIOTYPE | SIFT | PolyPhen | Tumor Sample Barcode | Tissue | Histology | Sex | Age | Stage | Therapy Types | Drugs | Outcome |
| MPDZ | SNV | Missense_Mutation | novel | c.4846N>C | p.Asp1616His | p.D1616H | O75970 | protein_coding | deleterious(0) | probably_damaging(0.999) | TCGA-5L-AAT1-01 | Breast | breast invasive carcinoma | Female | <65 | III/IV | Hormone Therapy | letrozol | SD |
| MPDZ | SNV | Missense_Mutation | rs772699513 | c.5114N>C | p.Arg1705Pro | p.R1705P | O75970 | protein_coding | deleterious(0.01) | probably_damaging(0.937) | TCGA-A2-A0D0-01 | Breast | breast invasive carcinoma | Female | <65 | I/II | Chemotherapy | cytoxan | SD |
| MPDZ | SNV | Missense_Mutation | novel | c.3175N>A | p.Glu1059Lys | p.E1059K | O75970 | protein_coding | tolerated(1) | benign(0.159) | TCGA-A2-A0EQ-01 | Breast | breast invasive carcinoma | Female | <65 | I/II | Chemotherapy | adriamycin | SD |
| MPDZ | SNV | Missense_Mutation | rs772699513 | c.5114N>C | p.Arg1705Pro | p.R1705P | O75970 | protein_coding | deleterious(0.01) | probably_damaging(0.937) | TCGA-A8-A06R-01 | Breast | breast invasive carcinoma | Female | >=65 | I/II | Chemotherapy | 5-fluorouracil | CR |
| MPDZ | SNV | Missense_Mutation | c.542N>A | p.Arg181Lys | p.R181K | O75970 | protein_coding | tolerated(0.6) | benign(0.116) | TCGA-A8-A09G-01 | Breast | breast invasive carcinoma | Female | >=65 | III/IV | Unknown | Unknown | SD | |
| MPDZ | SNV | Missense_Mutation | c.546N>C | p.Leu182Phe | p.L182F | O75970 | protein_coding | deleterious(0) | probably_damaging(0.998) | TCGA-AC-A23H-01 | Breast | breast invasive carcinoma | Female | >=65 | I/II | Unknown | Unknown | PD | |
| MPDZ | SNV | Missense_Mutation | rs369982009 | c.1898N>A | p.Arg633Gln | p.R633Q | O75970 | protein_coding | tolerated(0.4) | benign(0.003) | TCGA-AC-A3W5-01 | Breast | breast invasive carcinoma | Female | >=65 | I/II | Chemotherapy | docetaxel | CR |
| MPDZ | SNV | Missense_Mutation | novel | c.5960N>A | p.Ser1987Tyr | p.S1987Y | O75970 | protein_coding | deleterious(0) | possibly_damaging(0.683) | TCGA-AN-A046-01 | Breast | breast invasive carcinoma | Female | >=65 | I/II | Unknown | Unknown | SD |
| MPDZ | SNV | Missense_Mutation | c.370C>G | p.Gln124Glu | p.Q124E | O75970 | protein_coding | tolerated(0.21) | benign(0.021) | TCGA-AR-A1AN-01 | Breast | breast invasive carcinoma | Female | <65 | I/II | Chemotherapy | cytoxan | SD | |
| MPDZ | SNV | Missense_Mutation | rs772699513 | c.5114G>C | p.Arg1705Pro | p.R1705P | O75970 | protein_coding | deleterious(0.01) | probably_damaging(0.937) | TCGA-AR-A1AY-01 | Breast | breast invasive carcinoma | Female | >=65 | I/II | Unspecific | Doxorubicin | SD |
| Page: 1 2 3 4 5 6 7 8 9 10 11 12 13 14 15 16 17 18 19 20 21 22 23 24 25 26 |
Top |
Related drugs of malignant transformation related genes |
| Identification of chemicals and drugs interact with genes involved in malignant transfromation |
| (DGIdb 4.0) |
| Entrez ID | Symbol | Category | Interaction Types | Drug Claim Name | Drug Name | PMIDs |
| Page: 1 |

Copyright 2023-Present -The University of Texas Health Science Center at Houston |