
|
|||||
|
 | |
| |
| |
| |
| |
| |
|
Gene: MPDU1 |
Gene summary for MPDU1 |
| Gene information | Species | Human | Gene symbol | MPDU1 | Gene ID | 9526 |
| Gene name | mannose-P-dolichol utilization defect 1 | |
| Gene Alias | CDGIF | |
| Cytomap | 17p13.1 | |
| Gene Type | protein-coding | GO ID | GO:0005975 | UniProtAcc | J3QW43 |
Top |
Malignant transformation analysis |
| Identification of the aberrant gene expression in precancerous and cancerous lesions by comparing the gene expression of stem-like cells in diseased tissues with normal stem cells |
| Entrez ID | Symbol | Replicates | Species | Organ | Tissue | Adj P-value | Log2FC | Malignancy |
| 9526 | MPDU1 | LZE4T | Human | Esophagus | ESCC | 2.25e-13 | 5.38e-01 | 0.0811 |
| 9526 | MPDU1 | LZE7T | Human | Esophagus | ESCC | 8.75e-10 | 6.15e-01 | 0.0667 |
| 9526 | MPDU1 | LZE8T | Human | Esophagus | ESCC | 6.27e-06 | 3.31e-01 | 0.067 |
| 9526 | MPDU1 | LZE24T | Human | Esophagus | ESCC | 5.98e-12 | 4.40e-01 | 0.0596 |
| 9526 | MPDU1 | LZE21T | Human | Esophagus | ESCC | 2.97e-02 | 2.65e-01 | 0.0655 |
| 9526 | MPDU1 | LZE6T | Human | Esophagus | ESCC | 4.89e-05 | 3.43e-01 | 0.0845 |
| 9526 | MPDU1 | P1T-E | Human | Esophagus | ESCC | 1.14e-08 | 4.34e-01 | 0.0875 |
| 9526 | MPDU1 | P2T-E | Human | Esophagus | ESCC | 7.25e-30 | 6.86e-01 | 0.1177 |
| 9526 | MPDU1 | P4T-E | Human | Esophagus | ESCC | 1.12e-27 | 7.36e-01 | 0.1323 |
| 9526 | MPDU1 | P5T-E | Human | Esophagus | ESCC | 6.42e-11 | 2.10e-01 | 0.1327 |
| 9526 | MPDU1 | P8T-E | Human | Esophagus | ESCC | 5.70e-37 | 7.25e-01 | 0.0889 |
| 9526 | MPDU1 | P9T-E | Human | Esophagus | ESCC | 1.20e-18 | 4.41e-01 | 0.1131 |
| 9526 | MPDU1 | P10T-E | Human | Esophagus | ESCC | 1.11e-09 | 1.63e-01 | 0.116 |
| 9526 | MPDU1 | P11T-E | Human | Esophagus | ESCC | 3.93e-17 | 7.72e-01 | 0.1426 |
| 9526 | MPDU1 | P12T-E | Human | Esophagus | ESCC | 8.86e-52 | 1.12e+00 | 0.1122 |
| 9526 | MPDU1 | P15T-E | Human | Esophagus | ESCC | 1.15e-16 | 4.31e-01 | 0.1149 |
| 9526 | MPDU1 | P16T-E | Human | Esophagus | ESCC | 1.26e-28 | 6.49e-01 | 0.1153 |
| 9526 | MPDU1 | P17T-E | Human | Esophagus | ESCC | 2.05e-09 | 5.47e-01 | 0.1278 |
| 9526 | MPDU1 | P19T-E | Human | Esophagus | ESCC | 2.21e-11 | 8.59e-01 | 0.1662 |
| 9526 | MPDU1 | P20T-E | Human | Esophagus | ESCC | 7.85e-18 | 4.54e-01 | 0.1124 |
| Page: 1 2 3 4 5 6 |
| Tissue | Expression Dynamics | Abbreviation |
| Esophagus | 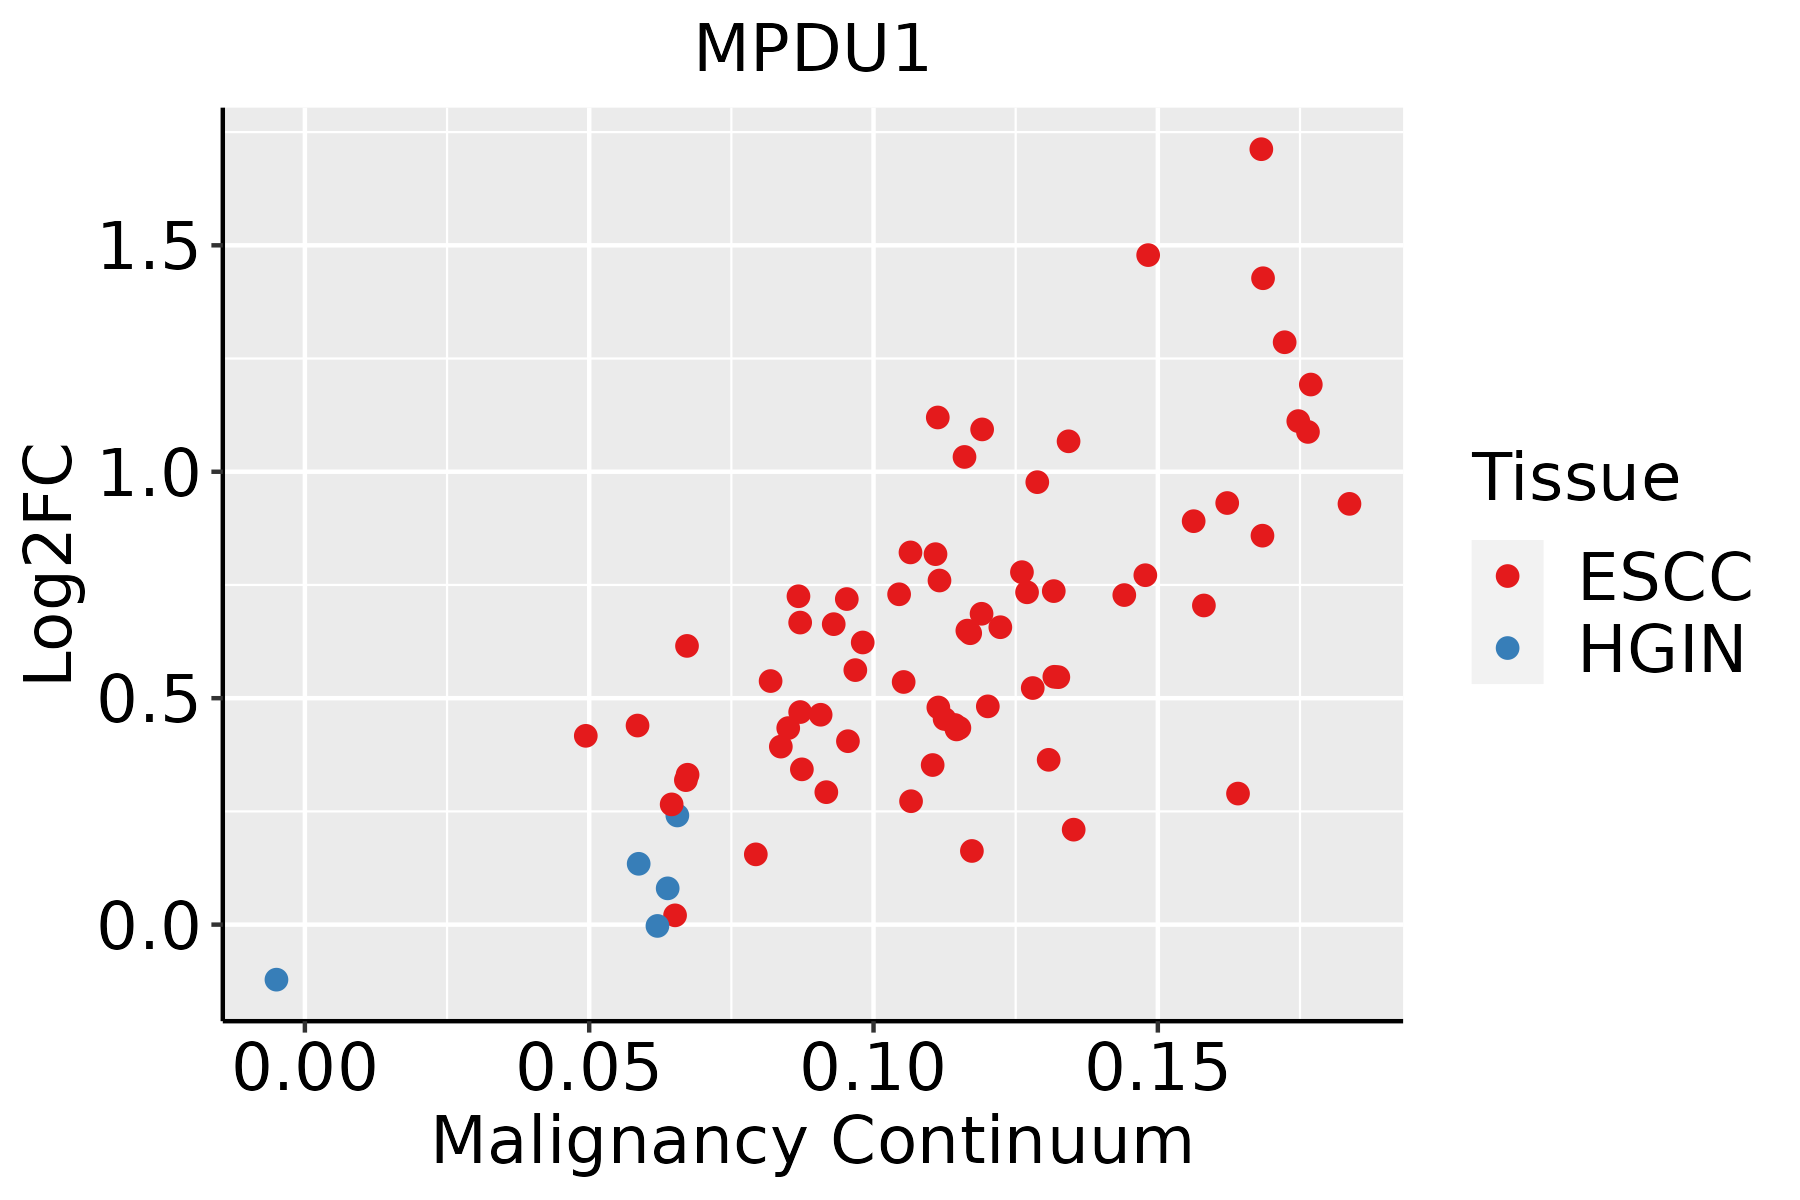 | ESCC: Esophageal squamous cell carcinoma |
| HGIN: High-grade intraepithelial neoplasias | ||
| LGIN: Low-grade intraepithelial neoplasias | ||
| Liver | 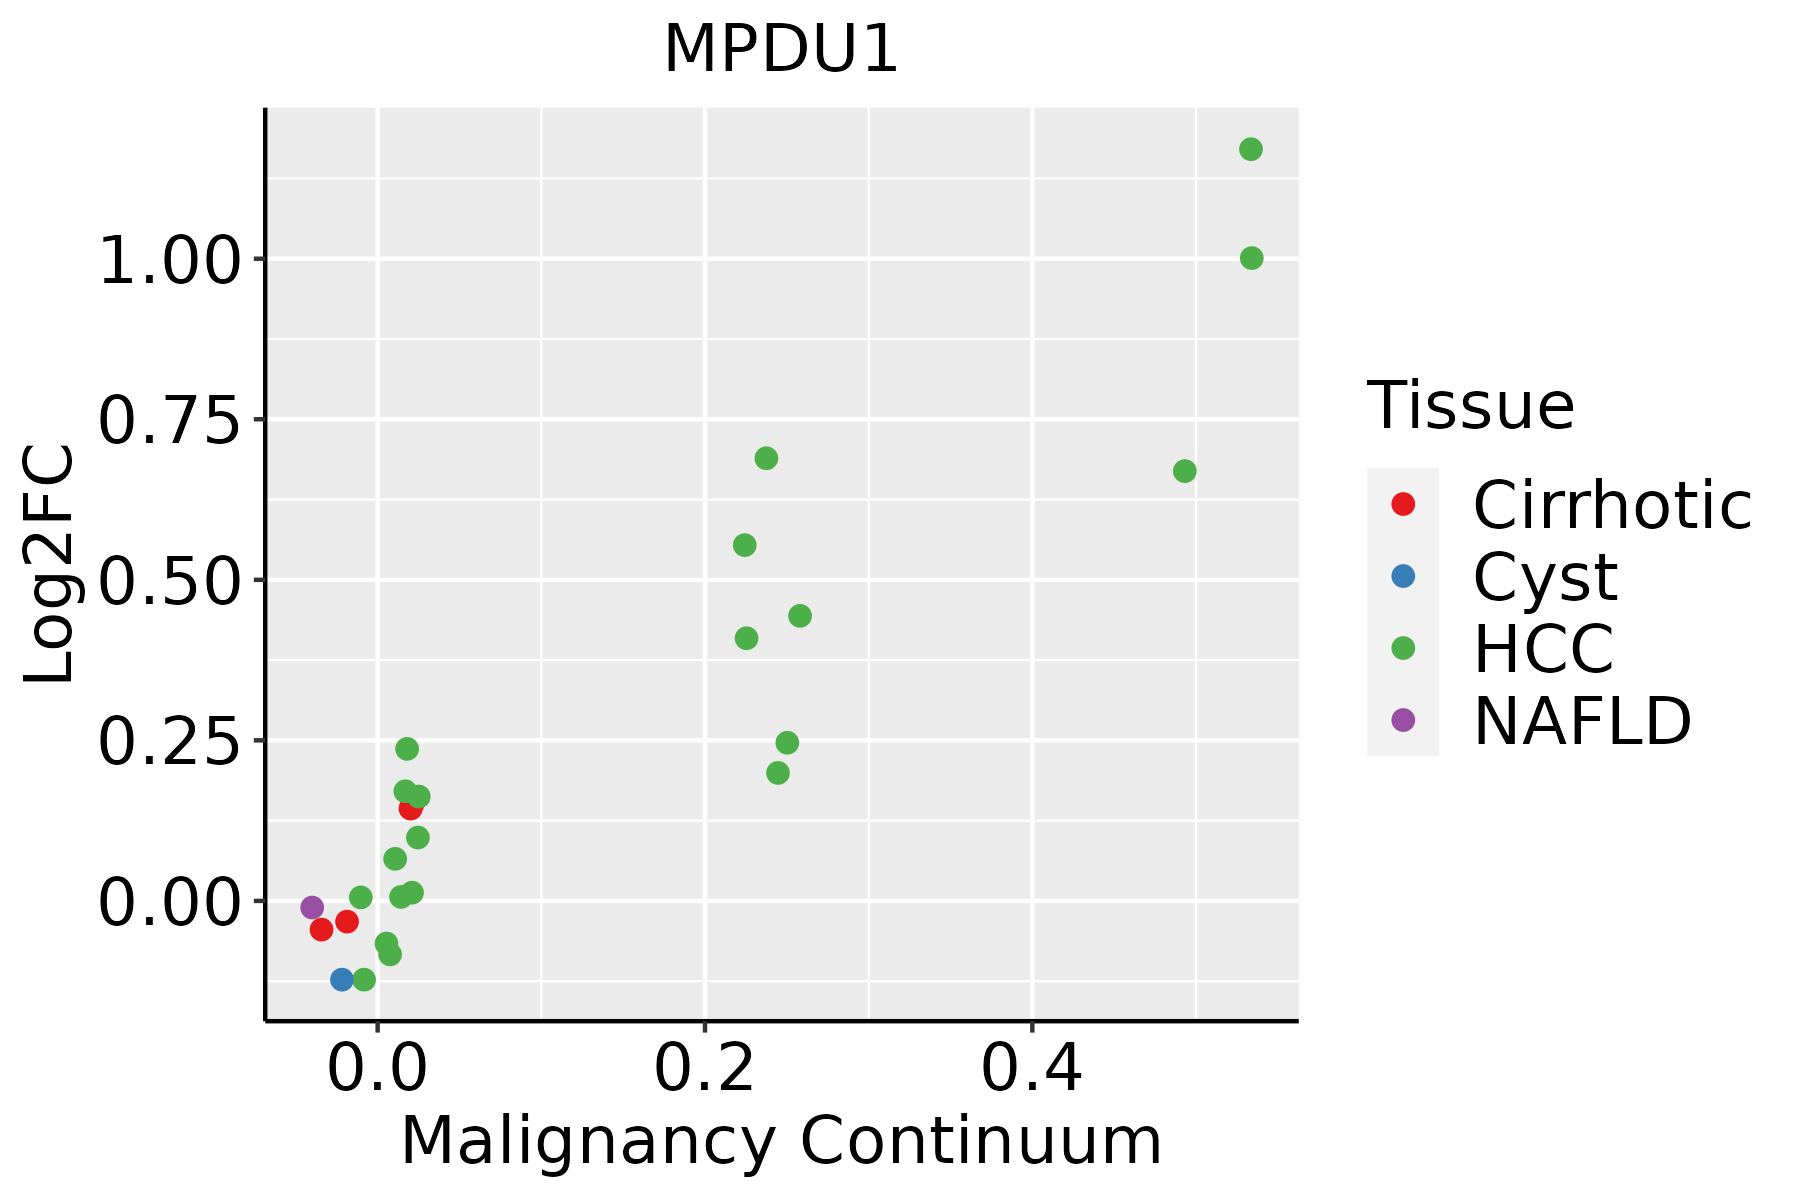 | HCC: Hepatocellular carcinoma |
| NAFLD: Non-alcoholic fatty liver disease | ||
| Oral Cavity |  | EOLP: Erosive Oral lichen planus |
| LP: leukoplakia | ||
| NEOLP: Non-erosive oral lichen planus | ||
| OSCC: Oral squamous cell carcinoma | ||
| Skin | 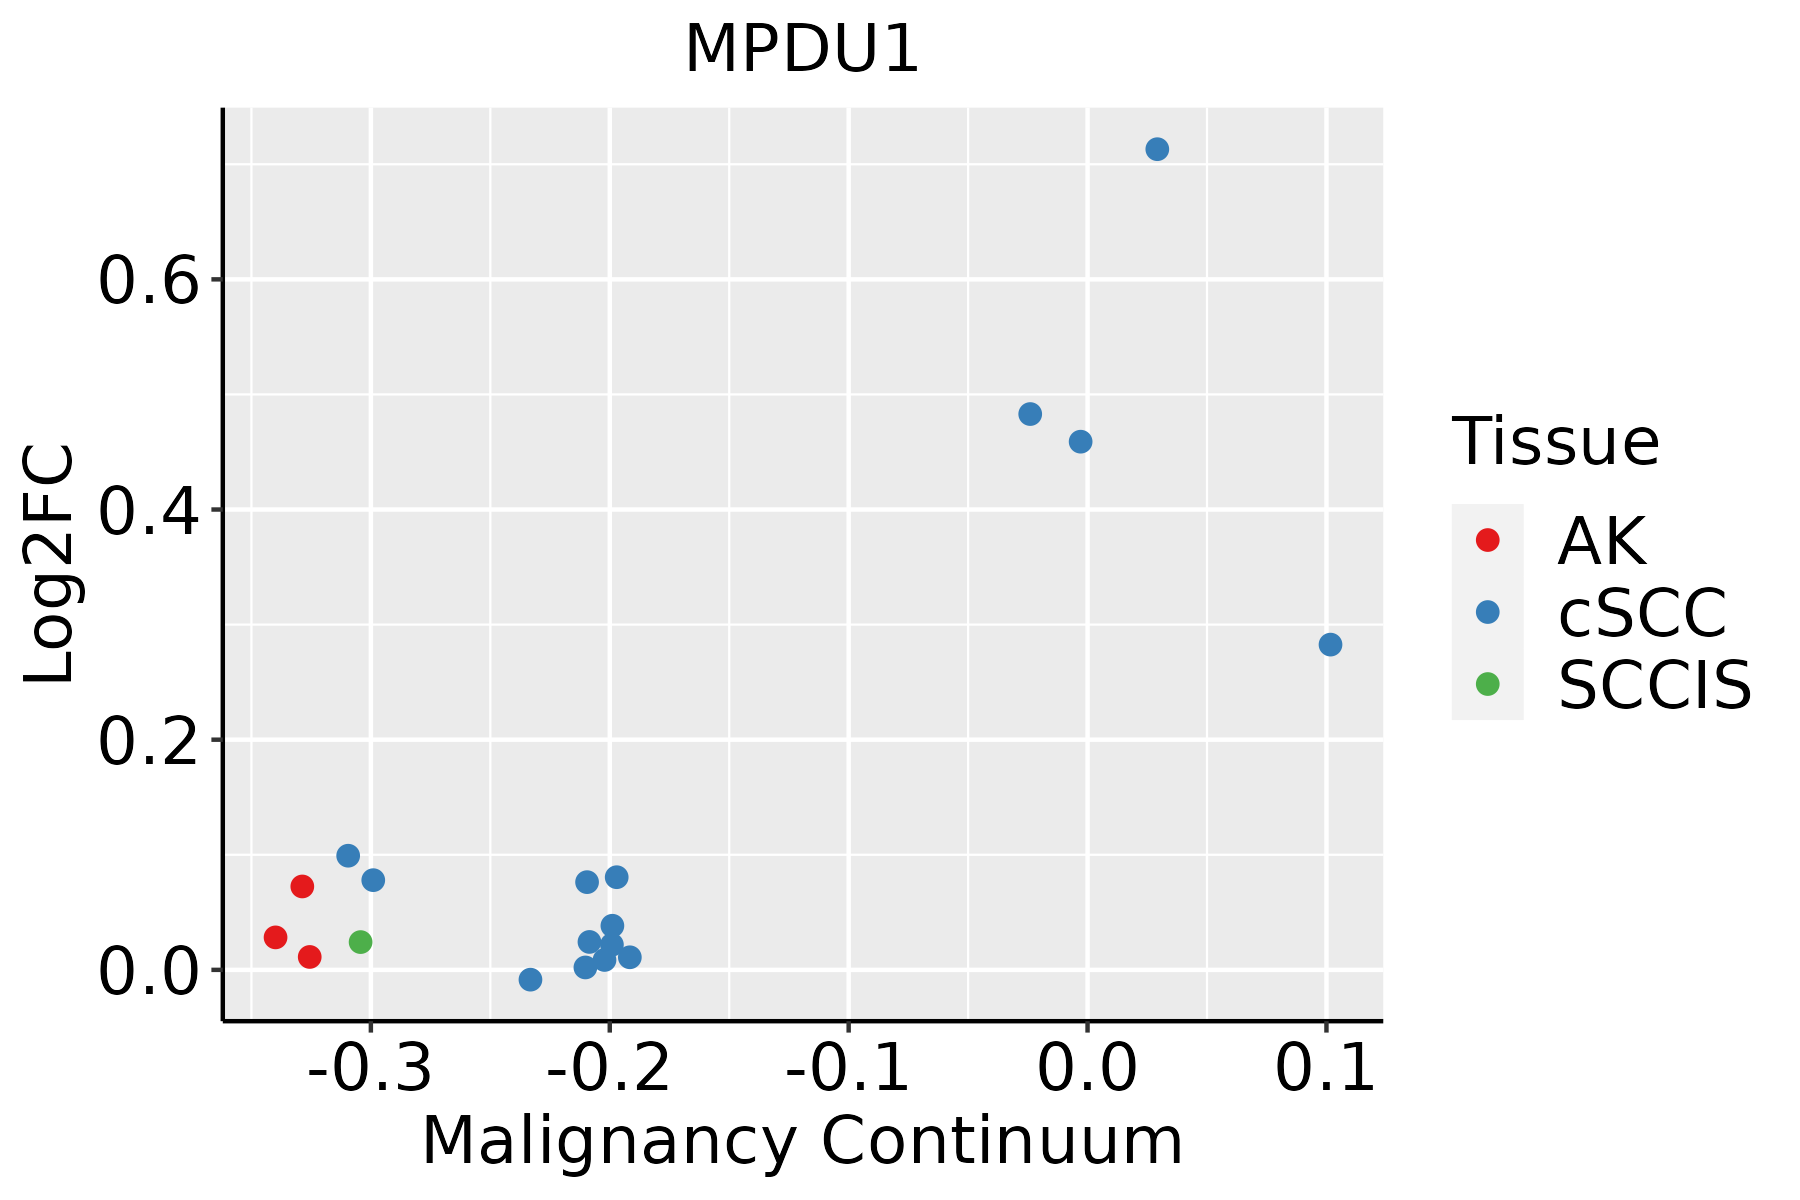 | AK: Actinic keratosis |
| cSCC: Cutaneous squamous cell carcinoma | ||
| SCCIS:squamous cell carcinoma in situ | ||
| Thyroid | 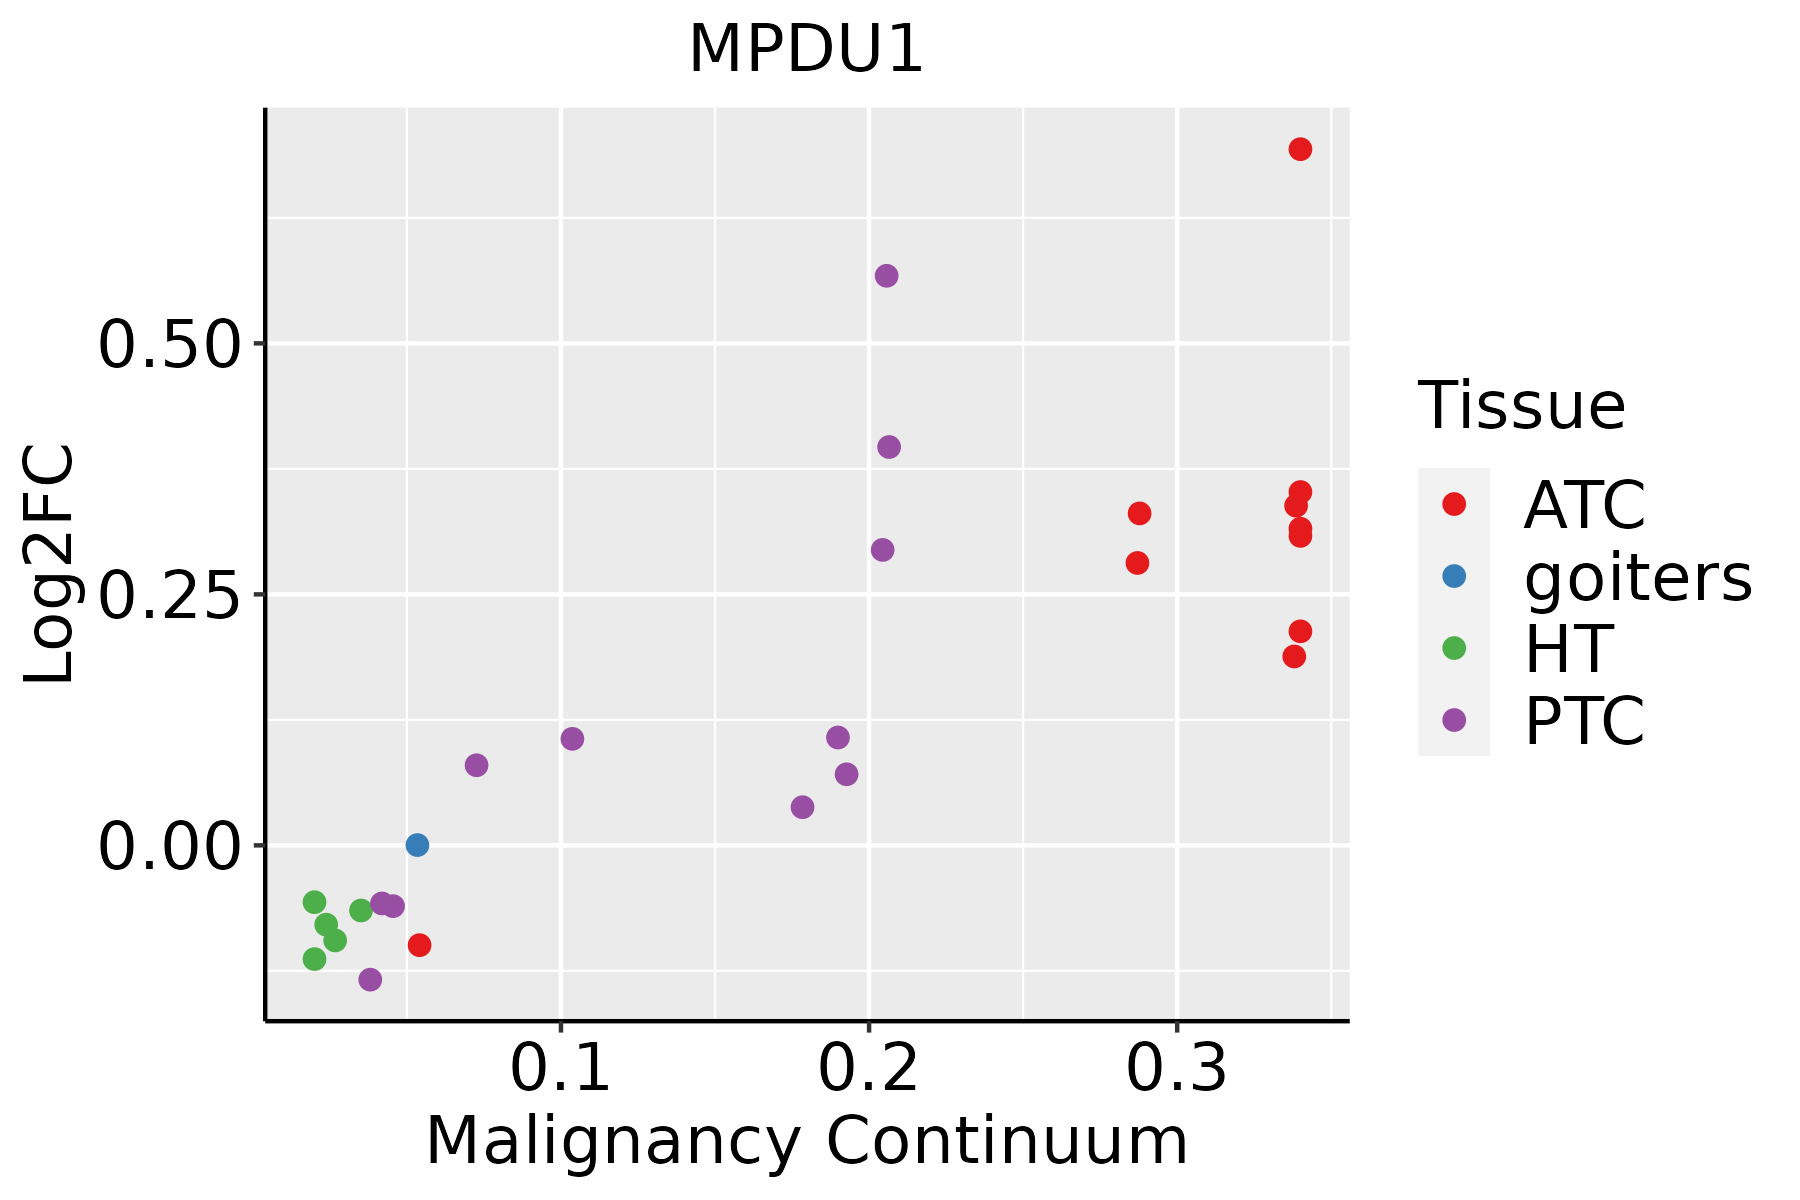 | ATC: Anaplastic thyroid cancer |
| HT: Hashimoto's thyroiditis | ||
| PTC: Papillary thyroid cancer |
| ∗log2FC in expression of this searched gene in stem-like cells from each diseased tissue sample relative to stem-like cells in normal samples in each tissue plotted against the malignancy continuum. Samples are colored based on if they are from different disease stage. |
Top |
Malignant transformation related pathway analysis |
| Find out the enriched GO biological processes and KEGG pathways involved in transition from healthy to precancer to cancer |
| Tissue | Disease Stage | Enriched GO biological Processes |
| Colorectum | AD |  |
| Colorectum | SER |  |
| Colorectum | MSS |  |
| Colorectum | MSI-H |  |
| Colorectum | FAP |  |
| ∗Top 15 enriched GO BP terms are showed in the bar plot of each disease state in each tissue. Each row represents a significant GO biological process which is colored according to the -log10(p.adjust). |
| Page: 1 2 3 4 5 6 7 8 9 |
| GO ID | Tissue | Disease Stage | Description | Gene Ratio | Bg Ratio | pvalue | p.adjust | Count |
| GO:0006457110 | Esophagus | ESCC | protein folding | 163/8552 | 212/18723 | 1.13e-20 | 1.74e-18 | 163 |
| GO:000648714 | Esophagus | ESCC | protein N-linked glycosylation | 51/8552 | 65/18723 | 6.41e-08 | 1.13e-06 | 51 |
| GO:00091002 | Esophagus | ESCC | glycoprotein metabolic process | 226/8552 | 387/18723 | 2.64e-07 | 3.94e-06 | 226 |
| GO:00700854 | Esophagus | ESCC | glycosylation | 144/8552 | 240/18723 | 5.12e-06 | 5.38e-05 | 144 |
| GO:00064865 | Esophagus | ESCC | protein glycosylation | 135/8552 | 226/18723 | 1.36e-05 | 1.24e-04 | 135 |
| GO:00434135 | Esophagus | ESCC | macromolecule glycosylation | 135/8552 | 226/18723 | 1.36e-05 | 1.24e-04 | 135 |
| GO:00091012 | Esophagus | ESCC | glycoprotein biosynthetic process | 181/8552 | 317/18723 | 2.54e-05 | 2.15e-04 | 181 |
| GO:00160514 | Esophagus | ESCC | carbohydrate biosynthetic process | 117/8552 | 202/18723 | 2.96e-04 | 1.79e-03 | 117 |
| GO:00064882 | Esophagus | ESCC | dolichol-linked oligosaccharide biosynthetic process | 14/8552 | 18/18723 | 5.77e-03 | 2.14e-02 | 14 |
| GO:00064902 | Esophagus | ESCC | oligosaccharide-lipid intermediate biosynthetic process | 14/8552 | 19/18723 | 1.27e-02 | 4.21e-02 | 14 |
| GO:00064577 | Liver | Cirrhotic | protein folding | 114/4634 | 212/18723 | 9.23e-20 | 2.31e-17 | 114 |
| GO:00064873 | Liver | Cirrhotic | protein N-linked glycosylation | 30/4634 | 65/18723 | 1.40e-04 | 1.36e-03 | 30 |
| GO:00160511 | Liver | Cirrhotic | carbohydrate biosynthetic process | 73/4634 | 202/18723 | 1.91e-04 | 1.77e-03 | 73 |
| GO:000645712 | Liver | HCC | protein folding | 160/7958 | 212/18723 | 1.07e-22 | 1.88e-20 | 160 |
| GO:000648711 | Liver | HCC | protein N-linked glycosylation | 48/7958 | 65/18723 | 2.85e-07 | 5.00e-06 | 48 |
| GO:00160512 | Liver | HCC | carbohydrate biosynthetic process | 113/7958 | 202/18723 | 7.64e-05 | 6.83e-04 | 113 |
| GO:00064862 | Liver | HCC | protein glycosylation | 122/7958 | 226/18723 | 3.11e-04 | 2.21e-03 | 122 |
| GO:00434132 | Liver | HCC | macromolecule glycosylation | 122/7958 | 226/18723 | 3.11e-04 | 2.21e-03 | 122 |
| GO:00700852 | Liver | HCC | glycosylation | 128/7958 | 240/18723 | 4.35e-04 | 2.92e-03 | 128 |
| GO:0009100 | Liver | HCC | glycoprotein metabolic process | 193/7958 | 387/18723 | 1.89e-03 | 9.62e-03 | 193 |
| Page: 1 2 3 |
| Pathway ID | Tissue | Disease Stage | Description | Gene Ratio | Bg Ratio | pvalue | p.adjust | qvalue | Count |
| Page: 1 |
Top |
Cell-cell communication analysis |
| Identification of potential cell-cell interactions between two cell types and their ligand-receptor pairs for different disease states |
| Ligand | Receptor | LRpair | Pathway | Tissue | Disease Stage |
| Page: 1 |
Top |
Single-cell gene regulatory network inference analysis |
| Find out the significant the regulons (TFs) and the target genes of each regulon across cell types for different disease states |
| TF | Cell Type | Tissue | Disease Stage | Target Gene | RSS | Regulon Activity |
| ∗The dot plots of a searched regulon are shown for all cell subpopulations in each disease state of each tissue based on the regulon specific score inferred using pySCENIC and by calculating the average expression. |
| Page: 1 |
Top |
Somatic mutation of malignant transformation related genes |
| Annotation of somatic variants for genes involved in malignant transformation |
| Hugo Symbol | Variant Class | Variant Classification | dbSNP RS | HGVSc | HGVSp | HGVSp Short | SWISSPROT | BIOTYPE | SIFT | PolyPhen | Tumor Sample Barcode | Tissue | Histology | Sex | Age | Stage | Therapy Types | Drugs | Outcome |
| MPDU1 | SNV | Missense_Mutation | c.110N>A | p.Cys37Tyr | p.C37Y | O75352 | protein_coding | deleterious(0) | probably_damaging(0.999) | TCGA-A6-A565-01 | Colorectum | colon adenocarcinoma | Female | <65 | III/IV | Unspecific | 5FU | PD | |
| MPDU1 | SNV | Missense_Mutation | rs777819415 | c.184G>A | p.Val62Met | p.V62M | O75352 | protein_coding | deleterious(0) | possibly_damaging(0.76) | TCGA-CM-5864-01 | Colorectum | colon adenocarcinoma | Male | <65 | I/II | Unknown | Unknown | SD |
| MPDU1 | SNV | Missense_Mutation | c.49N>A | p.Leu17Ile | p.L17I | O75352 | protein_coding | tolerated(0.13) | benign(0.188) | TCGA-A5-A2K5-01 | Endometrium | uterine corpus endometrioid carcinoma | Female | >=65 | I/II | Unknown | Unknown | SD | |
| MPDU1 | SNV | Missense_Mutation | c.317N>T | p.Ala106Val | p.A106V | O75352 | protein_coding | tolerated(0.07) | benign(0.025) | TCGA-AP-A051-01 | Endometrium | uterine corpus endometrioid carcinoma | Female | >=65 | I/II | Unknown | Unknown | SD | |
| MPDU1 | SNV | Missense_Mutation | novel | c.565A>G | p.Thr189Ala | p.T189A | O75352 | protein_coding | deleterious(0) | possibly_damaging(0.654) | TCGA-B5-A3FA-01 | Endometrium | uterine corpus endometrioid carcinoma | Female | >=65 | I/II | Unknown | Unknown | SD |
| MPDU1 | SNV | Missense_Mutation | rs762667389 | c.737C>T | p.Ala246Val | p.A246V | O75352 | protein_coding | tolerated(0.27) | benign(0.007) | TCGA-D1-A103-01 | Endometrium | uterine corpus endometrioid carcinoma | Female | >=65 | I/II | Unknown | Unknown | SD |
| MPDU1 | SNV | Missense_Mutation | c.49C>A | p.Leu17Ile | p.L17I | O75352 | protein_coding | tolerated(0.13) | benign(0.188) | TCGA-D1-A16X-01 | Endometrium | uterine corpus endometrioid carcinoma | Female | <65 | I/II | Unknown | Unknown | SD | |
| MPDU1 | SNV | Missense_Mutation | novel | c.383T>C | p.Val128Ala | p.V128A | O75352 | protein_coding | tolerated(0.94) | benign(0) | TCGA-D1-A175-01 | Endometrium | uterine corpus endometrioid carcinoma | Female | <65 | I/II | Chemotherapy | paclitaxel | SD |
| MPDU1 | SNV | Missense_Mutation | c.49C>A | p.Leu17Ile | p.L17I | O75352 | protein_coding | tolerated(0.13) | benign(0.188) | TCGA-D1-A17Q-01 | Endometrium | uterine corpus endometrioid carcinoma | Female | <65 | I/II | Unknown | Unknown | SD | |
| MPDU1 | SNV | Missense_Mutation | novel | c.25N>A | p.Leu9Ile | p.L9I | O75352 | protein_coding | tolerated(0.09) | benign(0.033) | TCGA-DF-A2KU-01 | Endometrium | uterine corpus endometrioid carcinoma | Female | Unknown | I/II | Unknown | Unknown | SD |
| Page: 1 2 |
Top |
Related drugs of malignant transformation related genes |
| Identification of chemicals and drugs interact with genes involved in malignant transfromation |
| (DGIdb 4.0) |
| Entrez ID | Symbol | Category | Interaction Types | Drug Claim Name | Drug Name | PMIDs |
| Page: 1 |

Copyright 2023-Present -The University of Texas Health Science Center at Houston |