
|
|||||
|
 | |
| |
| |
| |
| |
| |
|
Gene: MPC2 |
Gene summary for MPC2 |
| Gene information | Species | Human | Gene symbol | MPC2 | Gene ID | 25874 |
| Gene name | mitochondrial pyruvate carrier 2 | |
| Gene Alias | BRP44 | |
| Cytomap | 1q24.2 | |
| Gene Type | protein-coding | GO ID | GO:0001678 | UniProtAcc | A0A024R8Z5 |
Top |
Malignant transformation analysis |
| Identification of the aberrant gene expression in precancerous and cancerous lesions by comparing the gene expression of stem-like cells in diseased tissues with normal stem cells |
| Entrez ID | Symbol | Replicates | Species | Organ | Tissue | Adj P-value | Log2FC | Malignancy |
| 25874 | MPC2 | GSM4909281 | Human | Breast | IDC | 9.08e-26 | 6.66e-01 | 0.21 |
| 25874 | MPC2 | GSM4909285 | Human | Breast | IDC | 8.01e-12 | 4.05e-01 | 0.21 |
| 25874 | MPC2 | GSM4909286 | Human | Breast | IDC | 2.53e-02 | 3.81e-03 | 0.1081 |
| 25874 | MPC2 | GSM4909287 | Human | Breast | IDC | 6.91e-12 | 4.84e-01 | 0.2057 |
| 25874 | MPC2 | GSM4909288 | Human | Breast | IDC | 2.51e-03 | 2.55e-01 | 0.0988 |
| 25874 | MPC2 | GSM4909291 | Human | Breast | IDC | 2.38e-08 | 4.73e-01 | 0.1753 |
| 25874 | MPC2 | GSM4909293 | Human | Breast | IDC | 1.69e-82 | 1.18e+00 | 0.1581 |
| 25874 | MPC2 | GSM4909294 | Human | Breast | IDC | 2.66e-06 | 2.51e-01 | 0.2022 |
| 25874 | MPC2 | GSM4909296 | Human | Breast | IDC | 2.30e-07 | 5.90e-02 | 0.1524 |
| 25874 | MPC2 | GSM4909297 | Human | Breast | IDC | 3.02e-14 | -2.90e-01 | 0.1517 |
| 25874 | MPC2 | GSM4909306 | Human | Breast | IDC | 4.71e-08 | 4.52e-01 | 0.1564 |
| 25874 | MPC2 | GSM4909307 | Human | Breast | IDC | 2.67e-15 | 5.22e-01 | 0.1569 |
| 25874 | MPC2 | GSM4909308 | Human | Breast | IDC | 9.24e-51 | 8.69e-01 | 0.158 |
| 25874 | MPC2 | GSM4909311 | Human | Breast | IDC | 1.52e-29 | -1.38e-01 | 0.1534 |
| 25874 | MPC2 | GSM4909312 | Human | Breast | IDC | 1.78e-30 | 5.90e-01 | 0.1552 |
| 25874 | MPC2 | GSM4909313 | Human | Breast | IDC | 2.73e-07 | 7.10e-02 | 0.0391 |
| 25874 | MPC2 | GSM4909315 | Human | Breast | IDC | 2.07e-17 | 5.50e-01 | 0.21 |
| 25874 | MPC2 | GSM4909316 | Human | Breast | IDC | 1.59e-13 | 5.93e-01 | 0.21 |
| 25874 | MPC2 | GSM4909317 | Human | Breast | IDC | 5.58e-12 | 5.08e-01 | 0.1355 |
| 25874 | MPC2 | GSM4909318 | Human | Breast | IDC | 2.21e-12 | 6.68e-01 | 0.2031 |
| Page: 1 2 3 4 5 6 7 8 9 10 11 |
| Tissue | Expression Dynamics | Abbreviation |
| Breast | 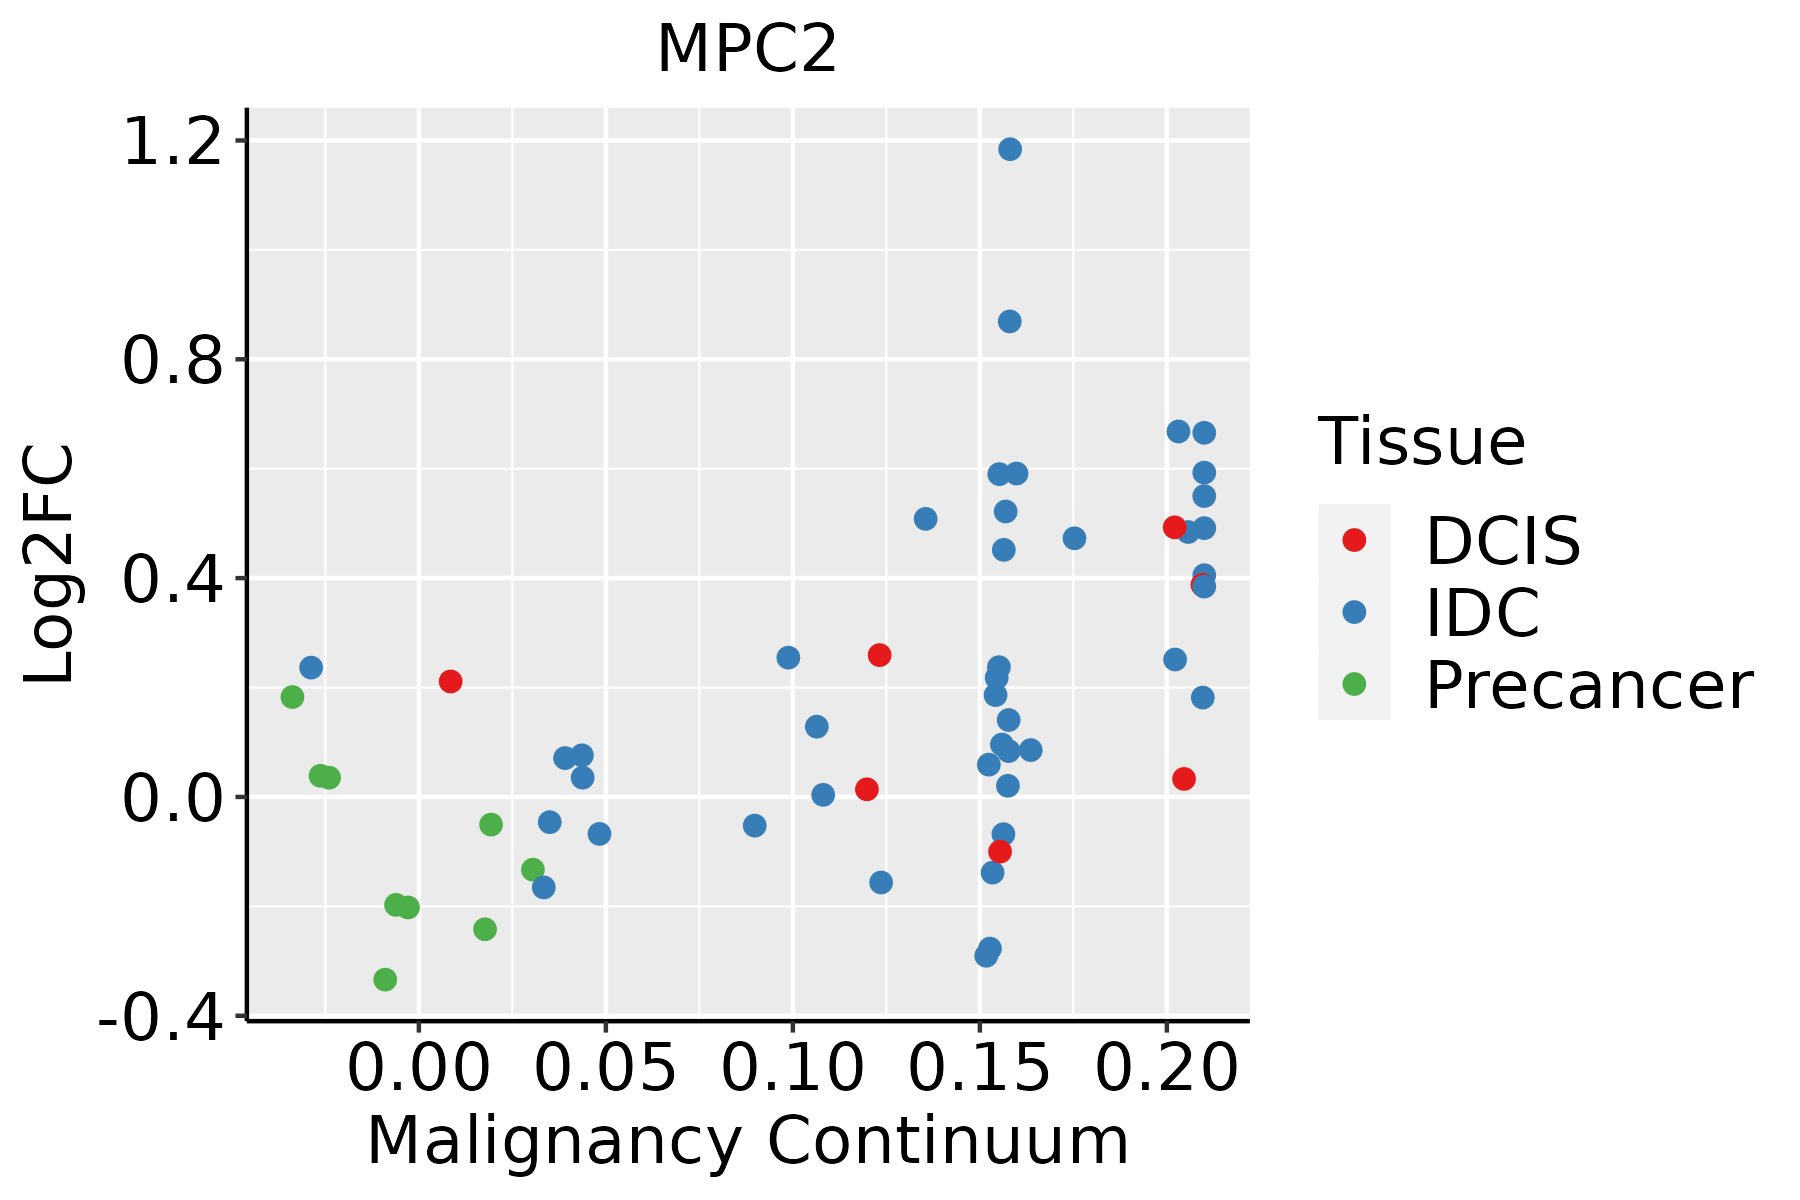 | IDC: Invasive ductal carcinoma |
| DCIS: Ductal carcinoma in situ | ||
| Precancer(BRCA1-mut): Precancerous lesion from BRCA1 mutation carriers | ||
| Colorectum (GSE201348) |  | FAP: Familial adenomatous polyposis |
| CRC: Colorectal cancer | ||
| Colorectum (HTA11) |  | AD: Adenomas |
| SER: Sessile serrated lesions | ||
| MSI-H: Microsatellite-high colorectal cancer | ||
| MSS: Microsatellite stable colorectal cancer | ||
| Esophagus |  | ESCC: Esophageal squamous cell carcinoma |
| HGIN: High-grade intraepithelial neoplasias | ||
| LGIN: Low-grade intraepithelial neoplasias | ||
| Liver | 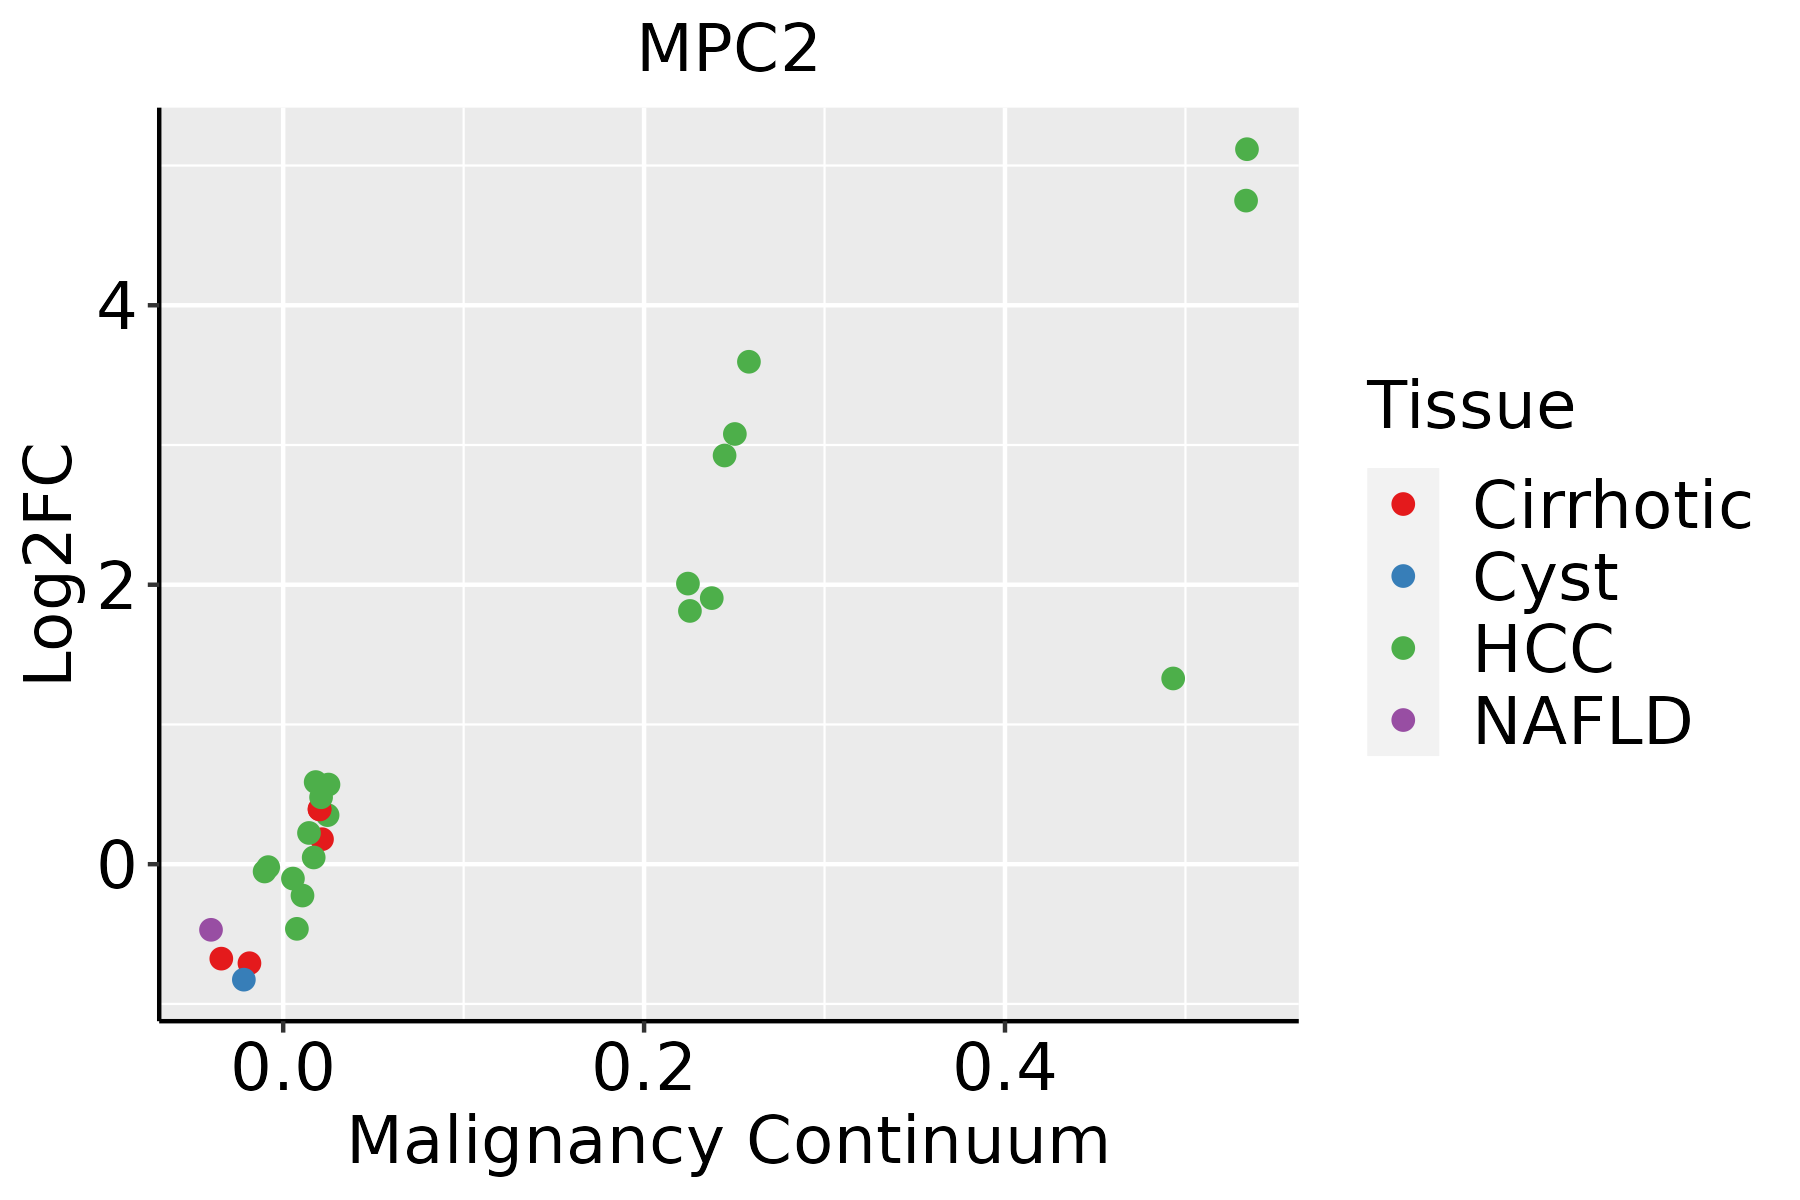 | HCC: Hepatocellular carcinoma |
| NAFLD: Non-alcoholic fatty liver disease | ||
| Oral Cavity | 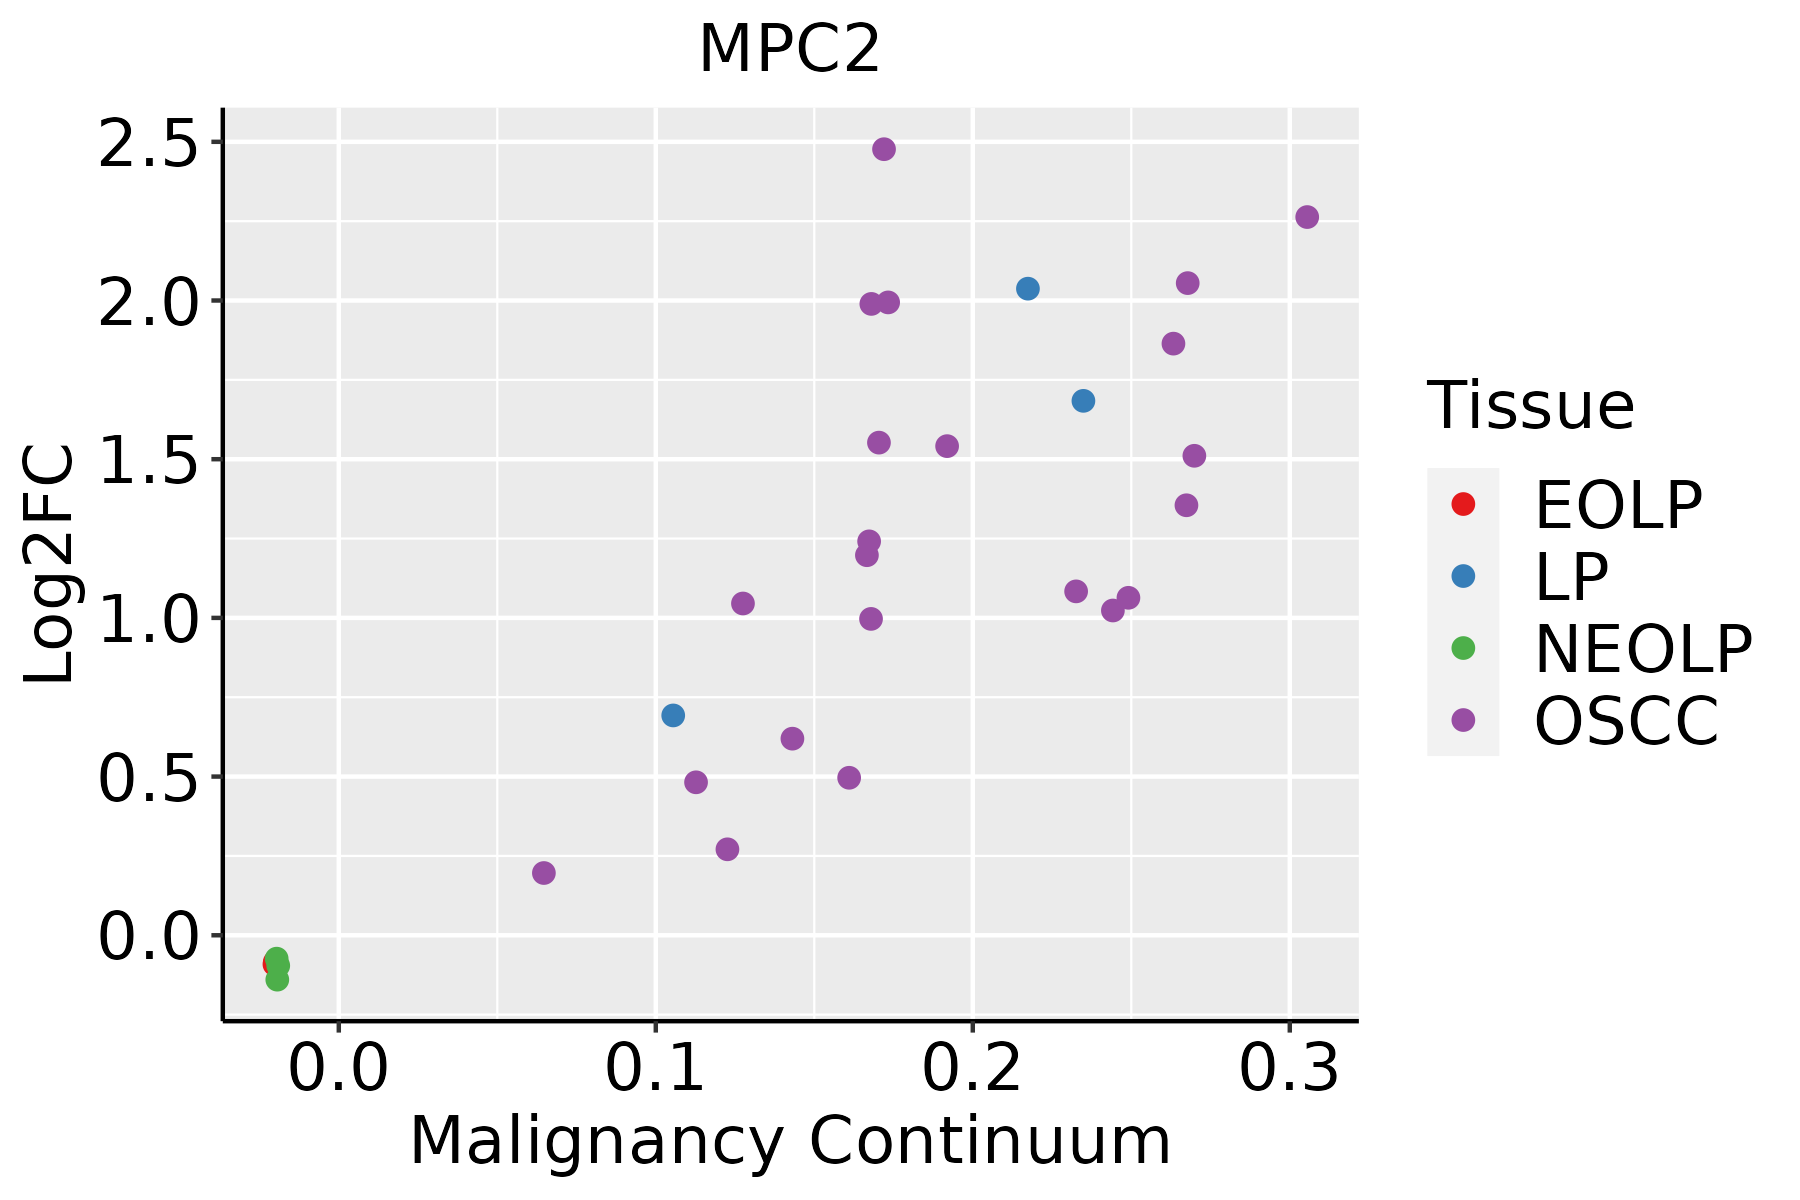 | EOLP: Erosive Oral lichen planus |
| LP: leukoplakia | ||
| NEOLP: Non-erosive oral lichen planus | ||
| OSCC: Oral squamous cell carcinoma | ||
| Prostate | 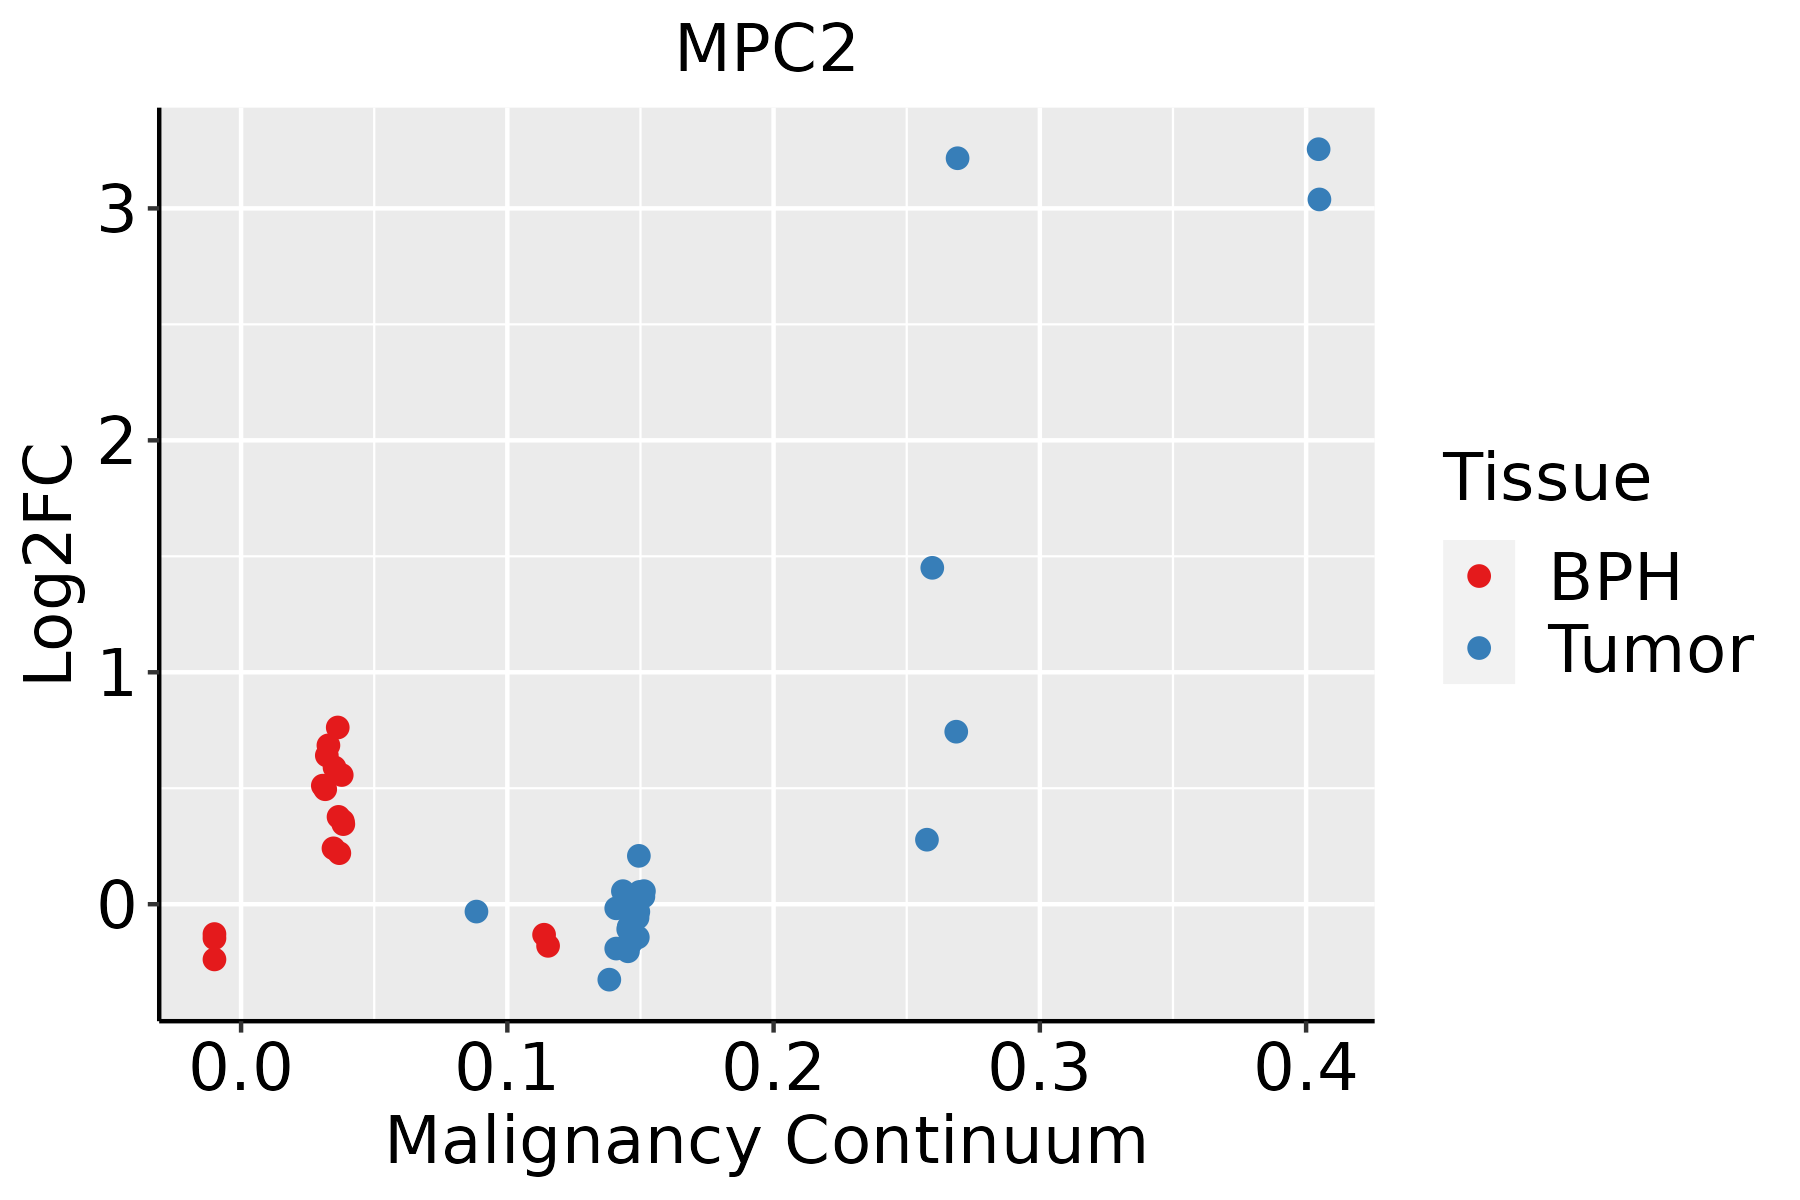 | BPH: Benign Prostatic Hyperplasia |
| Skin | 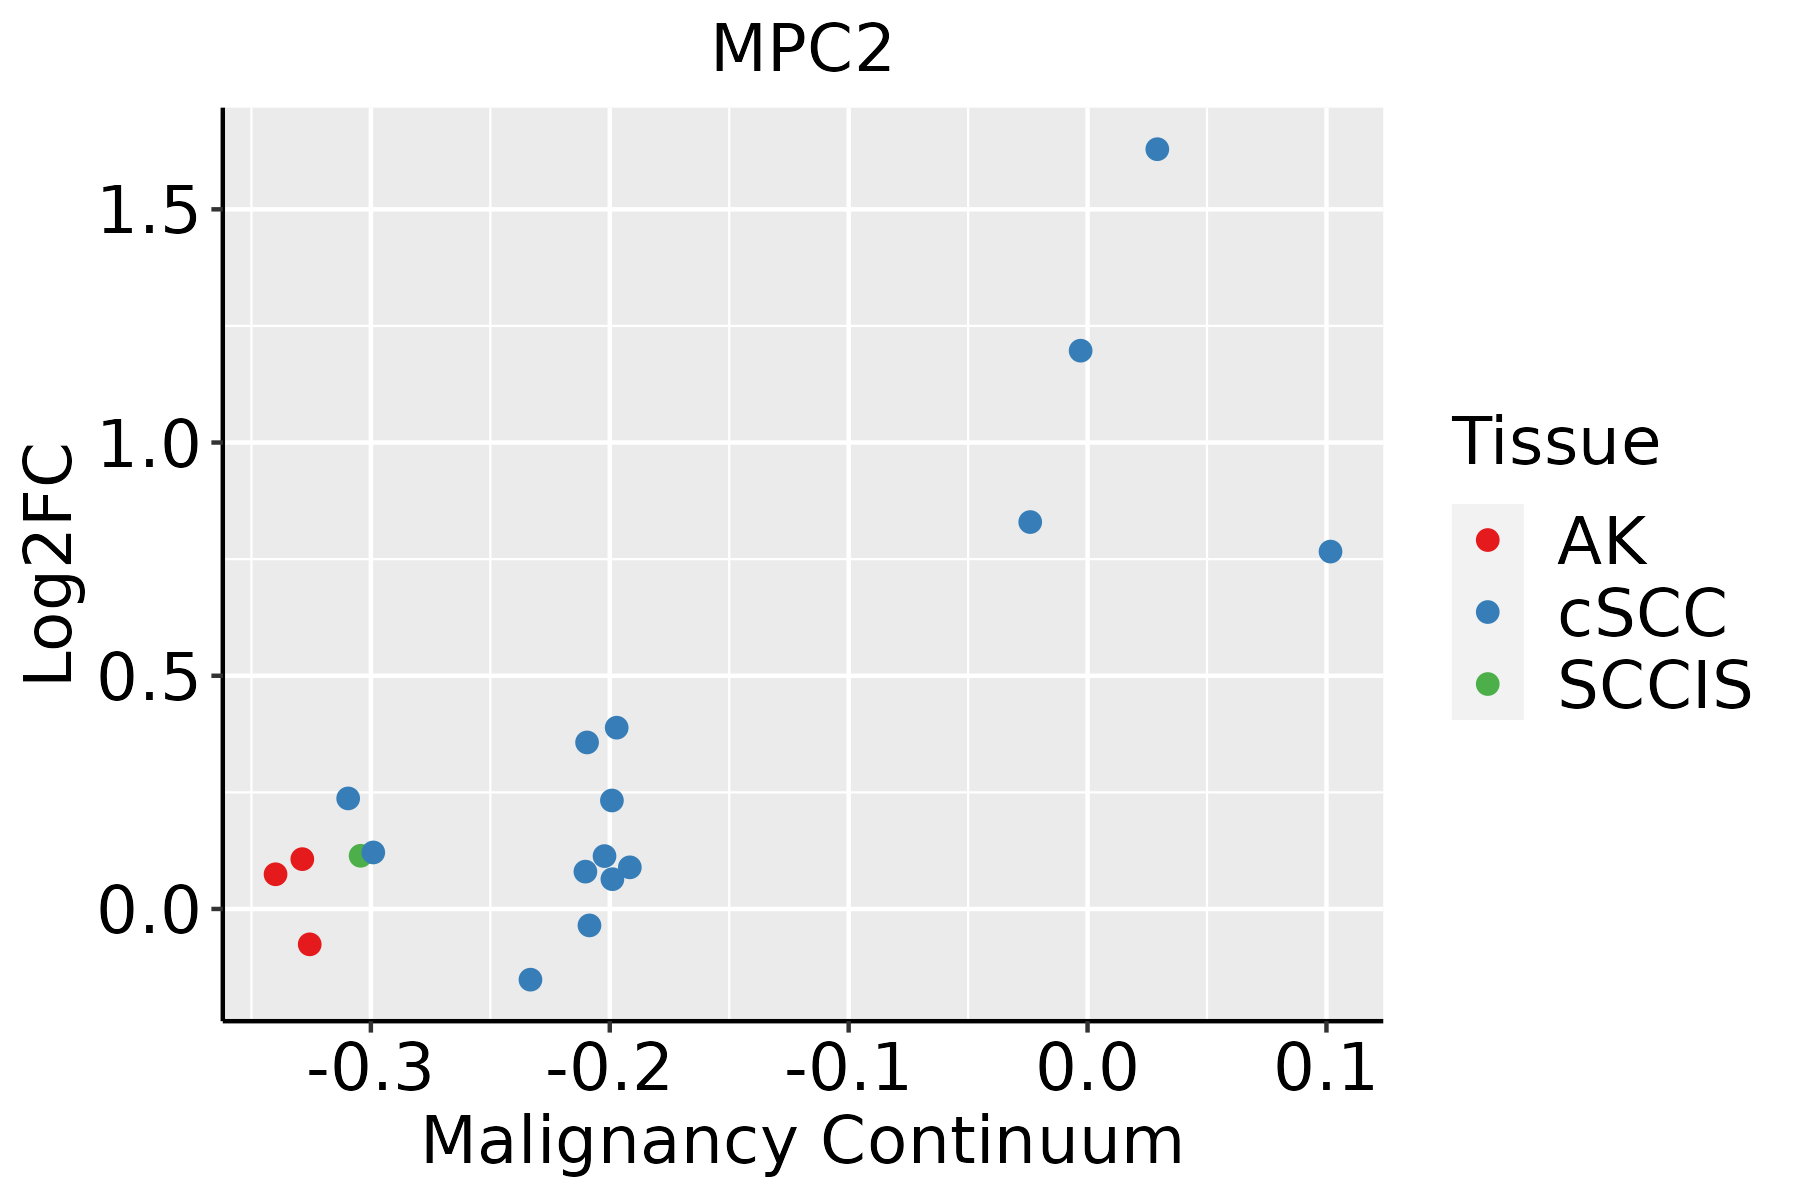 | AK: Actinic keratosis |
| cSCC: Cutaneous squamous cell carcinoma | ||
| SCCIS:squamous cell carcinoma in situ | ||
| Thyroid | 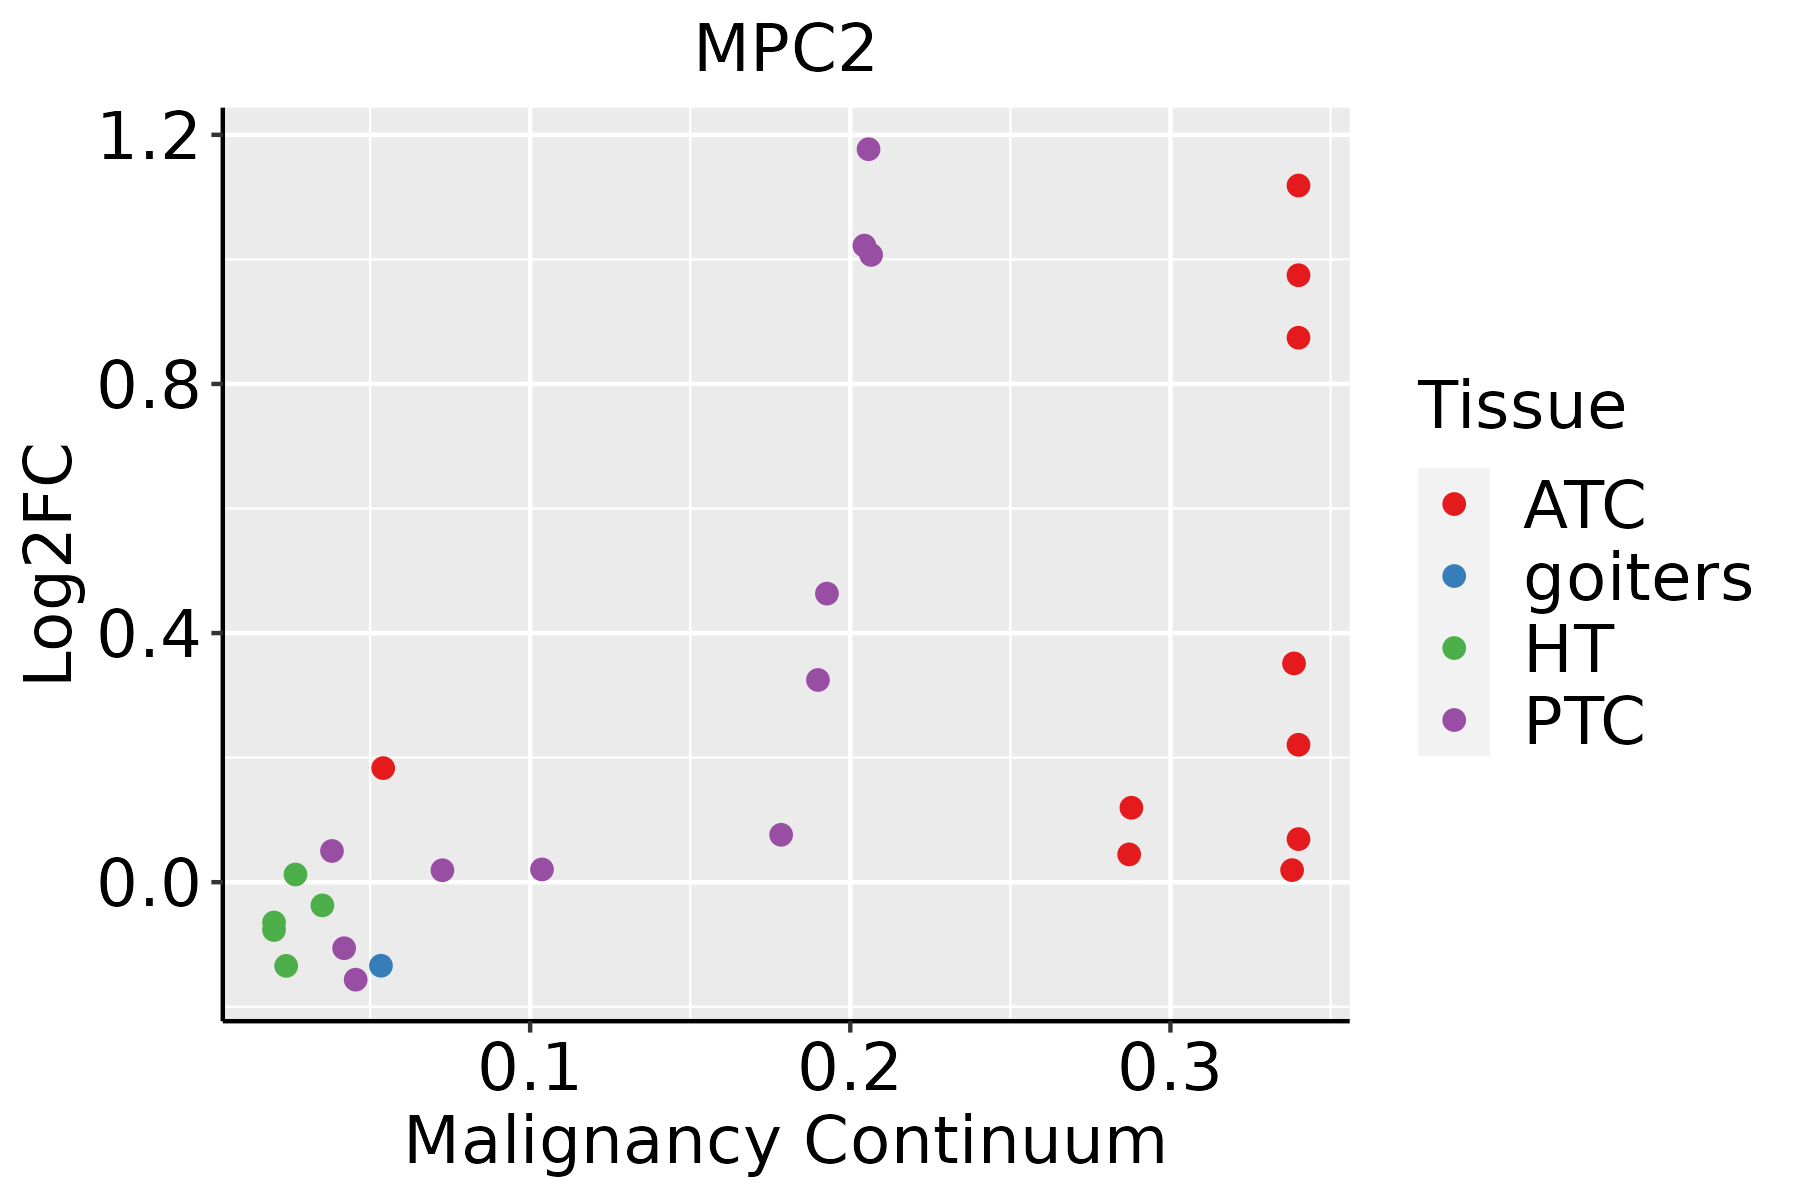 | ATC: Anaplastic thyroid cancer |
| HT: Hashimoto's thyroiditis | ||
| PTC: Papillary thyroid cancer |
| ∗log2FC in expression of this searched gene in stem-like cells from each diseased tissue sample relative to stem-like cells in normal samples in each tissue plotted against the malignancy continuum. Samples are colored based on if they are from different disease stage. |
Top |
Malignant transformation related pathway analysis |
| Find out the enriched GO biological processes and KEGG pathways involved in transition from healthy to precancer to cancer |
| Tissue | Disease Stage | Enriched GO biological Processes |
| Colorectum | AD |  |
| Colorectum | SER |  |
| Colorectum | MSS |  |
| Colorectum | MSI-H |  |
| Colorectum | FAP |  |
| ∗Top 15 enriched GO BP terms are showed in the bar plot of each disease state in each tissue. Each row represents a significant GO biological process which is colored according to the -log10(p.adjust). |
| Page: 1 2 3 4 5 6 7 8 9 |
| GO ID | Tissue | Disease Stage | Description | Gene Ratio | Bg Ratio | pvalue | p.adjust | Count |
| GO:000683913 | Breast | IDC | mitochondrial transport | 51/1434 | 254/18723 | 1.54e-10 | 1.83e-08 | 51 |
| GO:199054214 | Breast | IDC | mitochondrial transmembrane transport | 25/1434 | 102/18723 | 1.39e-07 | 7.74e-06 | 25 |
| GO:000915214 | Breast | IDC | purine ribonucleotide biosynthetic process | 34/1434 | 169/18723 | 1.63e-07 | 8.92e-06 | 34 |
| GO:004639013 | Breast | IDC | ribose phosphate biosynthetic process | 36/1434 | 190/18723 | 3.40e-07 | 1.73e-05 | 36 |
| GO:000926013 | Breast | IDC | ribonucleotide biosynthetic process | 35/1434 | 182/18723 | 3.40e-07 | 1.73e-05 | 35 |
| GO:000915014 | Breast | IDC | purine ribonucleotide metabolic process | 55/1434 | 368/18723 | 1.30e-06 | 5.72e-05 | 55 |
| GO:001969314 | Breast | IDC | ribose phosphate metabolic process | 58/1434 | 396/18723 | 1.31e-06 | 5.73e-05 | 58 |
| GO:000675313 | Breast | IDC | nucleoside phosphate metabolic process | 68/1434 | 497/18723 | 2.01e-06 | 8.23e-05 | 68 |
| GO:000911713 | Breast | IDC | nucleotide metabolic process | 67/1434 | 489/18723 | 2.28e-06 | 9.05e-05 | 67 |
| GO:000925914 | Breast | IDC | ribonucleotide metabolic process | 56/1434 | 385/18723 | 2.47e-06 | 9.63e-05 | 56 |
| GO:000616413 | Breast | IDC | purine nucleotide biosynthetic process | 34/1434 | 191/18723 | 3.11e-06 | 1.15e-04 | 34 |
| GO:190129313 | Breast | IDC | nucleoside phosphate biosynthetic process | 41/1434 | 256/18723 | 5.15e-06 | 1.73e-04 | 41 |
| GO:000616314 | Breast | IDC | purine nucleotide metabolic process | 56/1434 | 396/18723 | 5.90e-06 | 1.90e-04 | 56 |
| GO:007252213 | Breast | IDC | purine-containing compound biosynthetic process | 34/1434 | 200/18723 | 8.79e-06 | 2.50e-04 | 34 |
| GO:000916513 | Breast | IDC | nucleotide biosynthetic process | 40/1434 | 254/18723 | 1.01e-05 | 2.81e-04 | 40 |
| GO:007252114 | Breast | IDC | purine-containing compound metabolic process | 57/1434 | 416/18723 | 1.28e-05 | 3.31e-04 | 57 |
| GO:003428414 | Breast | IDC | response to monosaccharide | 36/1434 | 225/18723 | 1.94e-05 | 4.83e-04 | 36 |
| GO:000974314 | Breast | IDC | response to carbohydrate | 38/1434 | 253/18723 | 4.87e-05 | 1.07e-03 | 38 |
| GO:190495113 | Breast | IDC | positive regulation of establishment of protein localization | 45/1434 | 319/18723 | 5.01e-05 | 1.09e-03 | 45 |
| GO:000974613 | Breast | IDC | response to hexose | 33/1434 | 219/18723 | 1.39e-04 | 2.49e-03 | 33 |
| Page: 1 2 3 4 5 6 7 8 9 10 11 12 13 14 15 16 17 18 19 20 21 22 23 24 25 26 27 28 29 30 31 32 33 |
| Pathway ID | Tissue | Disease Stage | Description | Gene Ratio | Bg Ratio | pvalue | p.adjust | qvalue | Count |
| hsa0541523 | Breast | IDC | Diabetic cardiomyopathy | 67/867 | 203/8465 | 3.17e-19 | 8.59e-18 | 6.43e-18 | 67 |
| hsa0541533 | Breast | IDC | Diabetic cardiomyopathy | 67/867 | 203/8465 | 3.17e-19 | 8.59e-18 | 6.43e-18 | 67 |
| hsa0541543 | Breast | DCIS | Diabetic cardiomyopathy | 65/846 | 203/8465 | 1.81e-18 | 4.87e-17 | 3.59e-17 | 65 |
| hsa0541553 | Breast | DCIS | Diabetic cardiomyopathy | 65/846 | 203/8465 | 1.81e-18 | 4.87e-17 | 3.59e-17 | 65 |
| hsa05415 | Colorectum | AD | Diabetic cardiomyopathy | 114/2092 | 203/8465 | 3.65e-22 | 3.06e-20 | 1.95e-20 | 114 |
| hsa054151 | Colorectum | AD | Diabetic cardiomyopathy | 114/2092 | 203/8465 | 3.65e-22 | 3.06e-20 | 1.95e-20 | 114 |
| hsa054152 | Colorectum | SER | Diabetic cardiomyopathy | 103/1580 | 203/8465 | 1.45e-25 | 1.61e-23 | 1.17e-23 | 103 |
| hsa054153 | Colorectum | SER | Diabetic cardiomyopathy | 103/1580 | 203/8465 | 1.45e-25 | 1.61e-23 | 1.17e-23 | 103 |
| hsa054154 | Colorectum | MSS | Diabetic cardiomyopathy | 106/1875 | 203/8465 | 2.47e-21 | 1.62e-19 | 9.92e-20 | 106 |
| hsa054155 | Colorectum | MSS | Diabetic cardiomyopathy | 106/1875 | 203/8465 | 2.47e-21 | 1.62e-19 | 9.92e-20 | 106 |
| hsa054158 | Colorectum | FAP | Diabetic cardiomyopathy | 70/1404 | 203/8465 | 2.62e-10 | 2.18e-08 | 1.33e-08 | 70 |
| hsa054159 | Colorectum | FAP | Diabetic cardiomyopathy | 70/1404 | 203/8465 | 2.62e-10 | 2.18e-08 | 1.33e-08 | 70 |
| hsa05415211 | Esophagus | ESCC | Diabetic cardiomyopathy | 146/4205 | 203/8465 | 5.81e-11 | 7.78e-10 | 3.99e-10 | 146 |
| hsa0541538 | Esophagus | ESCC | Diabetic cardiomyopathy | 146/4205 | 203/8465 | 5.81e-11 | 7.78e-10 | 3.99e-10 | 146 |
| hsa0541514 | Liver | Cirrhotic | Diabetic cardiomyopathy | 108/2530 | 203/8465 | 1.99e-12 | 4.41e-11 | 2.72e-11 | 108 |
| hsa0541515 | Liver | Cirrhotic | Diabetic cardiomyopathy | 108/2530 | 203/8465 | 1.99e-12 | 4.41e-11 | 2.72e-11 | 108 |
| hsa0541522 | Liver | HCC | Diabetic cardiomyopathy | 151/4020 | 203/8465 | 2.72e-15 | 1.01e-13 | 5.63e-14 | 151 |
| hsa0541532 | Liver | HCC | Diabetic cardiomyopathy | 151/4020 | 203/8465 | 2.72e-15 | 1.01e-13 | 5.63e-14 | 151 |
| hsa0541542 | Liver | Cyst | Diabetic cardiomyopathy | 34/339 | 203/8465 | 6.93e-13 | 2.50e-11 | 2.06e-11 | 34 |
| hsa0541552 | Liver | Cyst | Diabetic cardiomyopathy | 34/339 | 203/8465 | 6.93e-13 | 2.50e-11 | 2.06e-11 | 34 |
| Page: 1 2 |
Top |
Cell-cell communication analysis |
| Identification of potential cell-cell interactions between two cell types and their ligand-receptor pairs for different disease states |
| Ligand | Receptor | LRpair | Pathway | Tissue | Disease Stage |
| Page: 1 |
Top |
Single-cell gene regulatory network inference analysis |
| Find out the significant the regulons (TFs) and the target genes of each regulon across cell types for different disease states |
| TF | Cell Type | Tissue | Disease Stage | Target Gene | RSS | Regulon Activity |
| ∗The dot plots of a searched regulon are shown for all cell subpopulations in each disease state of each tissue based on the regulon specific score inferred using pySCENIC and by calculating the average expression. |
| Page: 1 |
Top |
Somatic mutation of malignant transformation related genes |
| Annotation of somatic variants for genes involved in malignant transformation |
| Hugo Symbol | Variant Class | Variant Classification | dbSNP RS | HGVSc | HGVSp | HGVSp Short | SWISSPROT | BIOTYPE | SIFT | PolyPhen | Tumor Sample Barcode | Tissue | Histology | Sex | Age | Stage | Therapy Types | Drugs | Outcome |
| MPC2 | SNV | Missense_Mutation | c.175G>A | p.Asp59Asn | p.D59N | O95563 | protein_coding | deleterious(0) | probably_damaging(0.999) | TCGA-BH-A0DH-01 | Breast | breast invasive carcinoma | Female | <65 | I/II | Chemotherapy | cyclophosphamide | SD | |
| MPC2 | SNV | Missense_Mutation | novel | c.208N>A | p.Ala70Thr | p.A70T | O95563 | protein_coding | tolerated(0.21) | benign(0.034) | TCGA-AA-3966-01 | Colorectum | colon adenocarcinoma | Female | >=65 | I/II | Unknown | Unknown | SD |
| MPC2 | SNV | Missense_Mutation | novel | c.239T>C | p.Phe80Ser | p.F80S | O95563 | protein_coding | deleterious(0.01) | benign(0.097) | TCGA-A5-A1OF-01 | Endometrium | uterine corpus endometrioid carcinoma | Female | <65 | I/II | Unknown | Unknown | SD |
| MPC2 | SNV | Missense_Mutation | c.303C>A | p.Phe101Leu | p.F101L | O95563 | protein_coding | tolerated(1) | benign(0.011) | TCGA-B5-A0JY-01 | Endometrium | uterine corpus endometrioid carcinoma | Female | <65 | III/IV | Chemotherapy | doxorubicin | SD | |
| MPC2 | SNV | Missense_Mutation | c.303N>A | p.Phe101Leu | p.F101L | O95563 | protein_coding | tolerated(1) | benign(0.011) | TCGA-BS-A0UF-01 | Endometrium | uterine corpus endometrioid carcinoma | Female | >=65 | I/II | Unknown | Unknown | SD | |
| MPC2 | SNV | Missense_Mutation | novel | c.235G>T | p.Gly79Trp | p.G79W | O95563 | protein_coding | deleterious(0) | probably_damaging(0.999) | TCGA-BS-A0VI-01 | Endometrium | uterine corpus endometrioid carcinoma | Female | <65 | I/II | Unknown | Unknown | SD |
| MPC2 | SNV | Missense_Mutation | c.303N>A | p.Phe101Leu | p.F101L | O95563 | protein_coding | tolerated(1) | benign(0.011) | TCGA-DF-A2KU-01 | Endometrium | uterine corpus endometrioid carcinoma | Female | Unknown | I/II | Unknown | Unknown | SD | |
| MPC2 | SNV | Missense_Mutation | novel | c.311G>A | p.Gly104Glu | p.G104E | O95563 | protein_coding | deleterious(0) | probably_damaging(1) | TCGA-EY-A1GK-01 | Endometrium | uterine corpus endometrioid carcinoma | Female | >=65 | I/II | Unknown | Unknown | SD |
| MPC2 | insertion | Frame_Shift_Ins | novel | c.278dupA | p.Asn93LysfsTer8 | p.N93Kfs*8 | O95563 | protein_coding | TCGA-AP-A1DR-01 | Endometrium | uterine corpus endometrioid carcinoma | Female | <65 | III/IV | Chemotherapy | cisplatin | SD | ||
| MPC2 | SNV | Missense_Mutation | novel | c.28C>T | p.Arg10Trp | p.R10W | O95563 | protein_coding | deleterious(0.01) | probably_damaging(0.948) | TCGA-G3-AAV7-01 | Liver | liver hepatocellular carcinoma | Male | <65 | I/II | Unknown | Unknown | SD |
| Page: 1 2 |
Top |
Related drugs of malignant transformation related genes |
| Identification of chemicals and drugs interact with genes involved in malignant transfromation |
| (DGIdb 4.0) |
| Entrez ID | Symbol | Category | Interaction Types | Drug Claim Name | Drug Name | PMIDs |
| Page: 1 |

Copyright 2023-Present -The University of Texas Health Science Center at Houston |