
|
|||||
|
 | |
| |
| |
| |
| |
| |
|
Gene: MPC1 |
Gene summary for MPC1 |
| Gene information | Species | Human | Gene symbol | MPC1 | Gene ID | 51660 |
| Gene name | mitochondrial pyruvate carrier 1 | |
| Gene Alias | BRP44L | |
| Cytomap | 6q27 | |
| Gene Type | protein-coding | GO ID | GO:0006810 | UniProtAcc | Q5TI65 |
Top |
Malignant transformation analysis |
| Identification of the aberrant gene expression in precancerous and cancerous lesions by comparing the gene expression of stem-like cells in diseased tissues with normal stem cells |
| Entrez ID | Symbol | Replicates | Species | Organ | Tissue | Adj P-value | Log2FC | Malignancy |
| 51660 | MPC1 | HTA11_347_2000001011 | Human | Colorectum | AD | 1.19e-18 | 7.14e-01 | -0.1954 |
| 51660 | MPC1 | HTA11_411_2000001011 | Human | Colorectum | SER | 2.23e-02 | 7.24e-01 | -0.2602 |
| 51660 | MPC1 | HTA11_83_2000001011 | Human | Colorectum | SER | 8.43e-08 | 6.02e-01 | -0.1526 |
| 51660 | MPC1 | HTA11_5212_2000001011 | Human | Colorectum | AD | 8.75e-06 | 6.72e-01 | -0.2061 |
| 51660 | MPC1 | HTA11_99999974143_84620 | Human | Colorectum | MSS | 6.91e-08 | -3.09e-01 | 0.3005 |
| 51660 | MPC1 | A002-C-010 | Human | Colorectum | FAP | 4.19e-03 | -1.87e-01 | 0.242 |
| 51660 | MPC1 | A015-C-203 | Human | Colorectum | FAP | 2.09e-10 | -2.66e-01 | -0.1294 |
| 51660 | MPC1 | A002-C-201 | Human | Colorectum | FAP | 3.25e-05 | -2.83e-01 | 0.0324 |
| 51660 | MPC1 | A002-C-203 | Human | Colorectum | FAP | 4.02e-03 | -2.08e-01 | 0.2786 |
| 51660 | MPC1 | A001-C-119 | Human | Colorectum | FAP | 2.01e-03 | -3.24e-01 | -0.1557 |
| 51660 | MPC1 | A001-C-108 | Human | Colorectum | FAP | 3.33e-06 | -2.44e-01 | -0.0272 |
| 51660 | MPC1 | A002-C-205 | Human | Colorectum | FAP | 1.33e-09 | -3.51e-01 | -0.1236 |
| 51660 | MPC1 | A001-C-104 | Human | Colorectum | FAP | 3.14e-04 | -2.17e-01 | 0.0184 |
| 51660 | MPC1 | A015-C-005 | Human | Colorectum | FAP | 5.97e-03 | -2.80e-01 | -0.0336 |
| 51660 | MPC1 | A015-C-006 | Human | Colorectum | FAP | 2.38e-03 | -2.60e-01 | -0.0994 |
| 51660 | MPC1 | A015-C-106 | Human | Colorectum | FAP | 9.04e-05 | -1.77e-01 | -0.0511 |
| 51660 | MPC1 | A002-C-114 | Human | Colorectum | FAP | 6.23e-06 | -3.14e-01 | -0.1561 |
| 51660 | MPC1 | A015-C-104 | Human | Colorectum | FAP | 2.64e-13 | -3.10e-01 | -0.1899 |
| 51660 | MPC1 | A001-C-014 | Human | Colorectum | FAP | 1.28e-05 | -2.29e-01 | 0.0135 |
| 51660 | MPC1 | A002-C-016 | Human | Colorectum | FAP | 1.53e-13 | -2.68e-01 | 0.0521 |
| Page: 1 2 3 4 5 6 7 8 |
| Tissue | Expression Dynamics | Abbreviation |
| Colorectum (GSE201348) |  | FAP: Familial adenomatous polyposis |
| CRC: Colorectal cancer | ||
| Colorectum (HTA11) |  | AD: Adenomas |
| SER: Sessile serrated lesions | ||
| MSI-H: Microsatellite-high colorectal cancer | ||
| MSS: Microsatellite stable colorectal cancer | ||
| Esophagus |  | ESCC: Esophageal squamous cell carcinoma |
| HGIN: High-grade intraepithelial neoplasias | ||
| LGIN: Low-grade intraepithelial neoplasias | ||
| Liver | 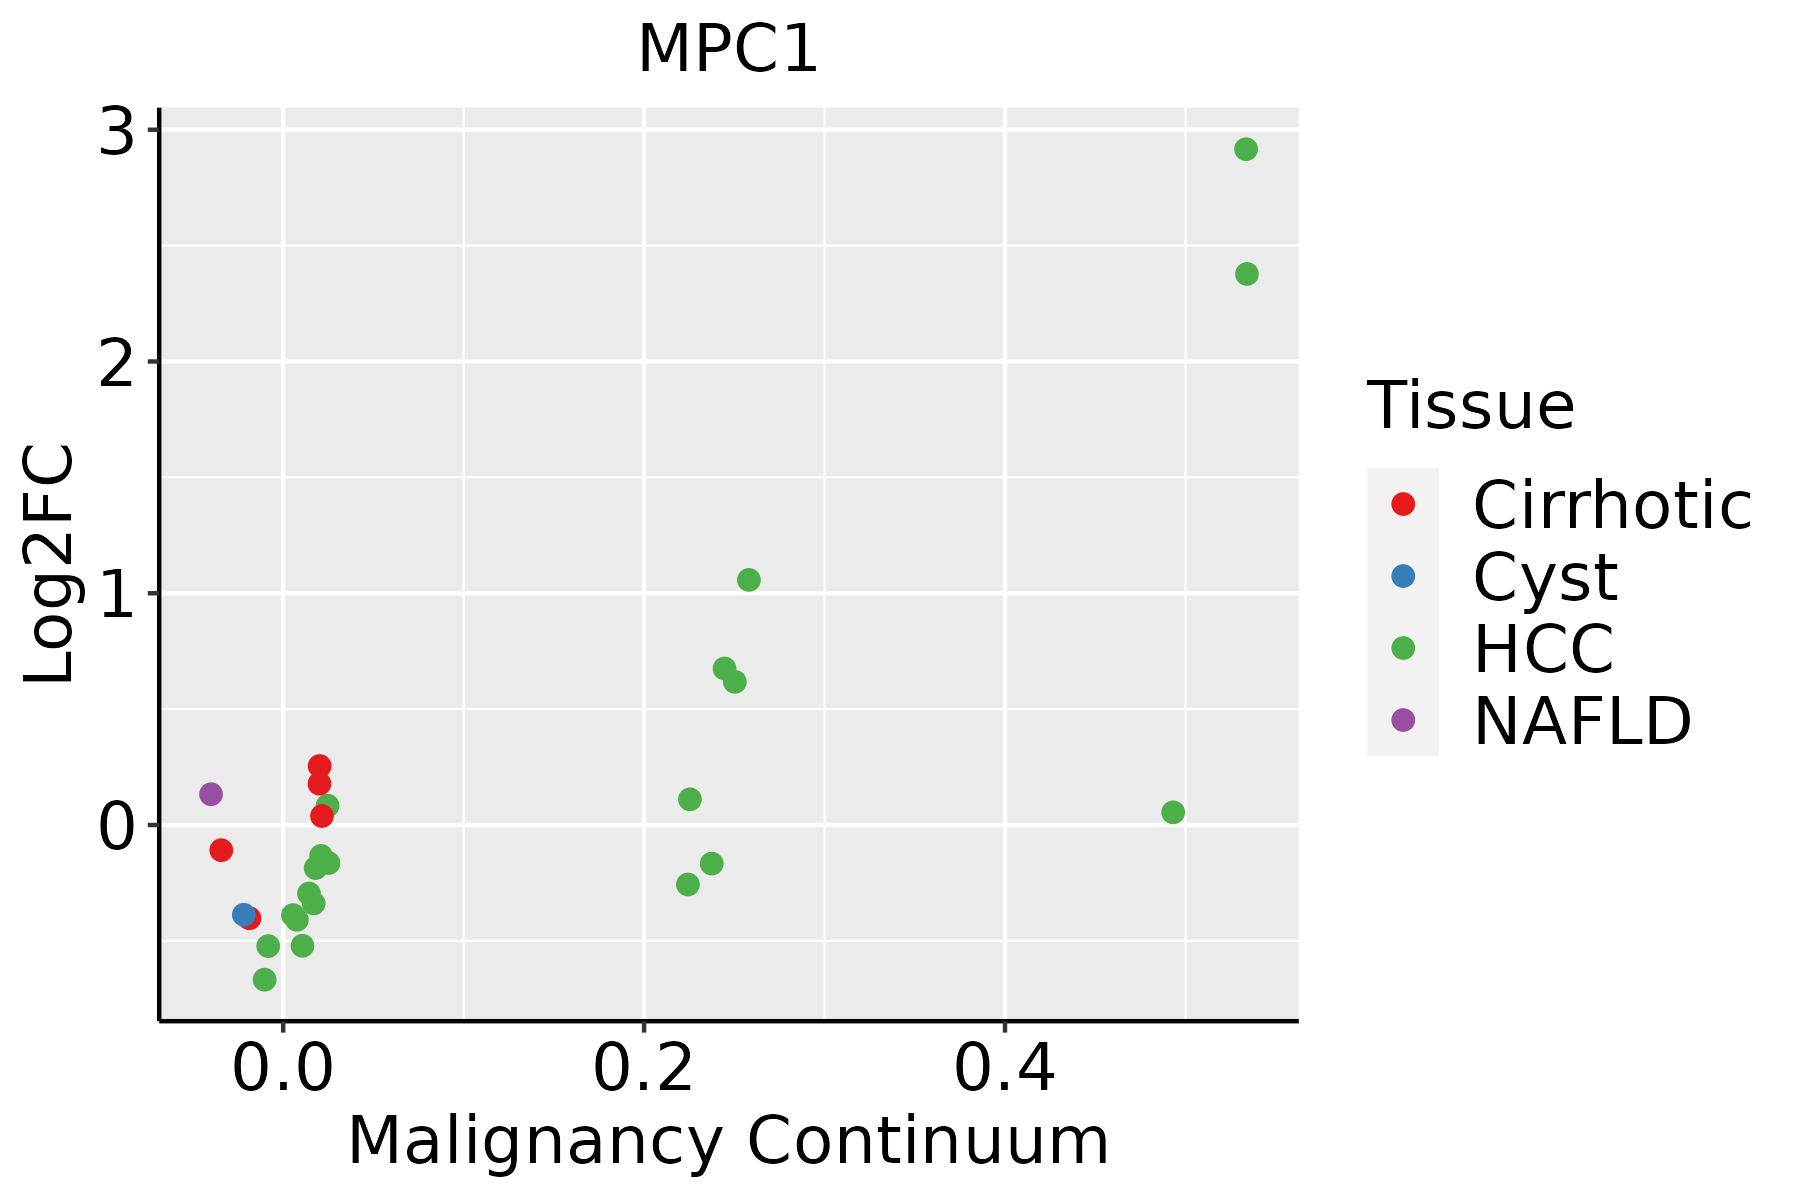 | HCC: Hepatocellular carcinoma |
| NAFLD: Non-alcoholic fatty liver disease | ||
| Oral Cavity | 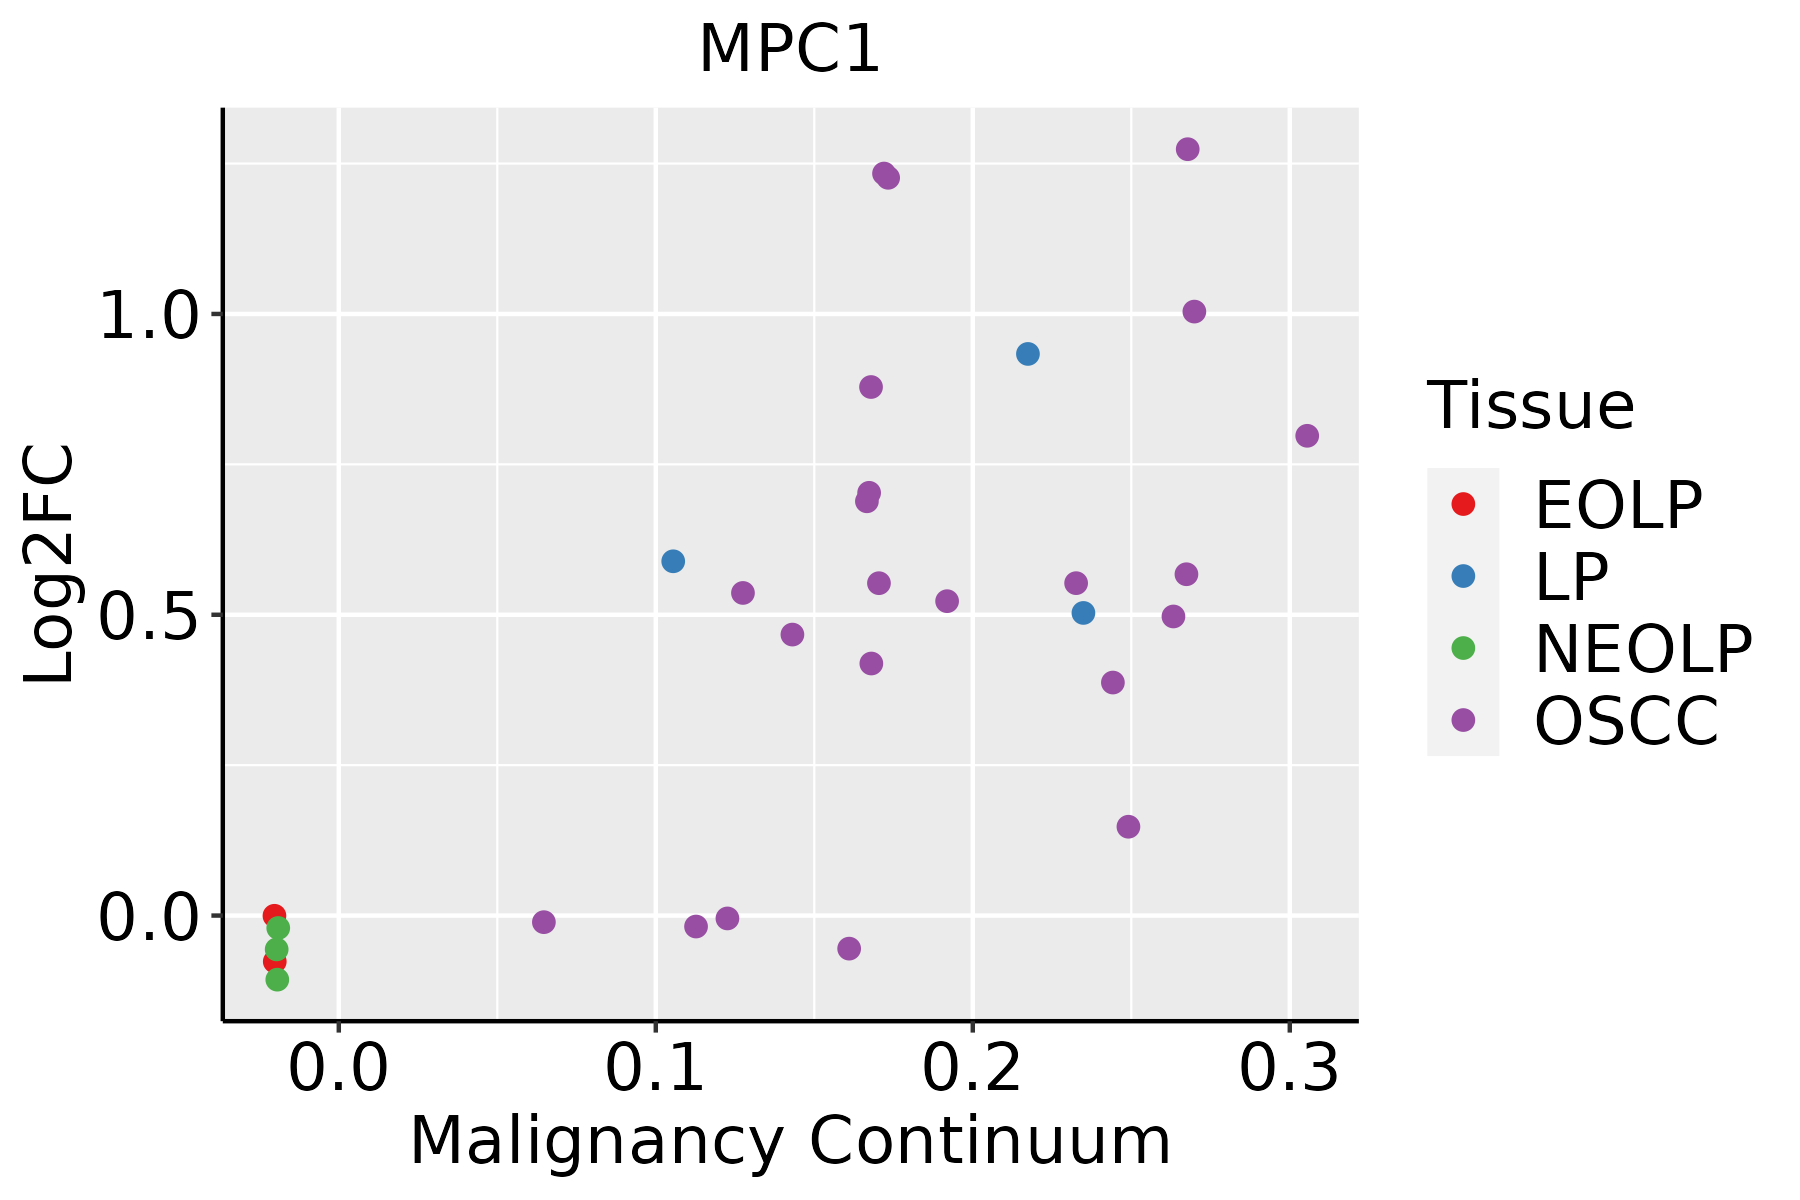 | EOLP: Erosive Oral lichen planus |
| LP: leukoplakia | ||
| NEOLP: Non-erosive oral lichen planus | ||
| OSCC: Oral squamous cell carcinoma | ||
| Prostate | 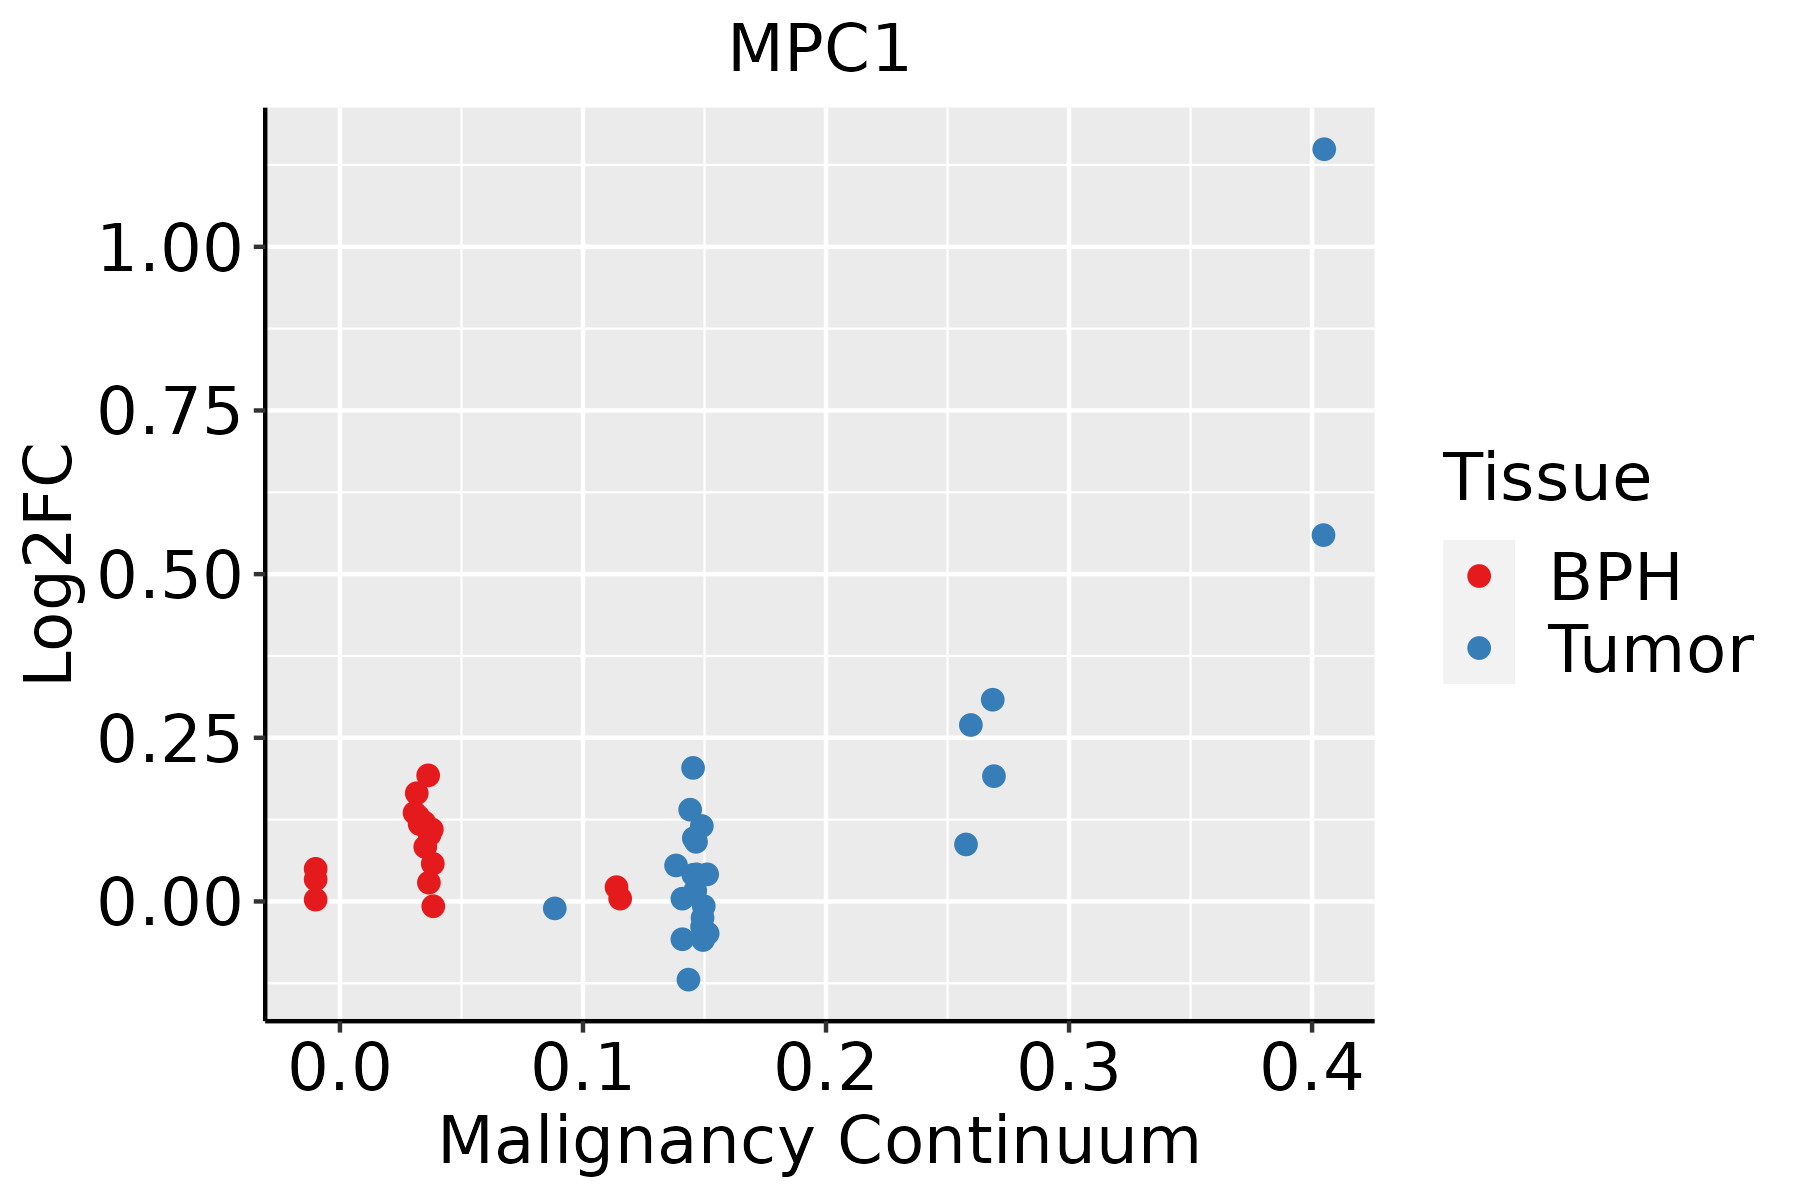 | BPH: Benign Prostatic Hyperplasia |
| Skin |  | AK: Actinic keratosis |
| cSCC: Cutaneous squamous cell carcinoma | ||
| SCCIS:squamous cell carcinoma in situ | ||
| Thyroid |  | ATC: Anaplastic thyroid cancer |
| HT: Hashimoto's thyroiditis | ||
| PTC: Papillary thyroid cancer |
| ∗log2FC in expression of this searched gene in stem-like cells from each diseased tissue sample relative to stem-like cells in normal samples in each tissue plotted against the malignancy continuum. Samples are colored based on if they are from different disease stage. |
Top |
Malignant transformation related pathway analysis |
| Find out the enriched GO biological processes and KEGG pathways involved in transition from healthy to precancer to cancer |
| Tissue | Disease Stage | Enriched GO biological Processes |
| Colorectum | AD |  |
| Colorectum | SER |  |
| Colorectum | MSS |  |
| Colorectum | MSI-H |  |
| Colorectum | FAP |  |
| ∗Top 15 enriched GO BP terms are showed in the bar plot of each disease state in each tissue. Each row represents a significant GO biological process which is colored according to the -log10(p.adjust). |
| Page: 1 2 3 4 5 6 7 8 9 |
| GO ID | Tissue | Disease Stage | Description | Gene Ratio | Bg Ratio | pvalue | p.adjust | Count |
| GO:0006839 | Colorectum | AD | mitochondrial transport | 102/3918 | 254/18723 | 1.87e-12 | 3.08e-10 | 102 |
| GO:1990542 | Colorectum | AD | mitochondrial transmembrane transport | 47/3918 | 102/18723 | 1.09e-08 | 6.52e-07 | 47 |
| GO:00068391 | Colorectum | SER | mitochondrial transport | 87/2897 | 254/18723 | 7.91e-14 | 3.03e-11 | 87 |
| GO:19905421 | Colorectum | SER | mitochondrial transmembrane transport | 42/2897 | 102/18723 | 3.65e-10 | 4.77e-08 | 42 |
| GO:00068392 | Colorectum | MSS | mitochondrial transport | 93/3467 | 254/18723 | 6.14e-12 | 9.82e-10 | 93 |
| GO:19905422 | Colorectum | MSS | mitochondrial transmembrane transport | 41/3467 | 102/18723 | 2.70e-07 | 1.11e-05 | 41 |
| GO:19905423 | Colorectum | FAP | mitochondrial transmembrane transport | 29/2622 | 102/18723 | 1.09e-04 | 1.80e-03 | 29 |
| GO:00068394 | Colorectum | FAP | mitochondrial transport | 55/2622 | 254/18723 | 5.58e-04 | 6.24e-03 | 55 |
| GO:000683920 | Esophagus | HGIN | mitochondrial transport | 74/2587 | 254/18723 | 1.32e-10 | 1.32e-08 | 74 |
| GO:199054220 | Esophagus | HGIN | mitochondrial transmembrane transport | 29/2587 | 102/18723 | 8.52e-05 | 1.87e-03 | 29 |
| GO:0006839110 | Esophagus | ESCC | mitochondrial transport | 187/8552 | 254/18723 | 8.35e-20 | 9.81e-18 | 187 |
| GO:1990542110 | Esophagus | ESCC | mitochondrial transmembrane transport | 72/8552 | 102/18723 | 2.94e-07 | 4.23e-06 | 72 |
| GO:00068397 | Liver | Cirrhotic | mitochondrial transport | 112/4634 | 254/18723 | 1.03e-11 | 6.66e-10 | 112 |
| GO:19905425 | Liver | Cirrhotic | mitochondrial transmembrane transport | 41/4634 | 102/18723 | 4.08e-04 | 3.37e-03 | 41 |
| GO:000683912 | Liver | HCC | mitochondrial transport | 184/7958 | 254/18723 | 2.30e-22 | 3.83e-20 | 184 |
| GO:199054212 | Liver | HCC | mitochondrial transmembrane transport | 78/7958 | 102/18723 | 2.73e-12 | 1.26e-10 | 78 |
| GO:000683918 | Oral cavity | OSCC | mitochondrial transport | 162/7305 | 254/18723 | 8.96e-16 | 6.52e-14 | 162 |
| GO:199054218 | Oral cavity | OSCC | mitochondrial transmembrane transport | 56/7305 | 102/18723 | 8.06e-04 | 4.32e-03 | 56 |
| GO:000683919 | Oral cavity | LP | mitochondrial transport | 119/4623 | 254/18723 | 1.06e-14 | 1.33e-12 | 119 |
| GO:199054219 | Oral cavity | LP | mitochondrial transmembrane transport | 37/4623 | 102/18723 | 5.93e-03 | 3.53e-02 | 37 |
| Page: 1 2 |
| Pathway ID | Tissue | Disease Stage | Description | Gene Ratio | Bg Ratio | pvalue | p.adjust | qvalue | Count |
| hsa05415 | Colorectum | AD | Diabetic cardiomyopathy | 114/2092 | 203/8465 | 3.65e-22 | 3.06e-20 | 1.95e-20 | 114 |
| hsa054151 | Colorectum | AD | Diabetic cardiomyopathy | 114/2092 | 203/8465 | 3.65e-22 | 3.06e-20 | 1.95e-20 | 114 |
| hsa054152 | Colorectum | SER | Diabetic cardiomyopathy | 103/1580 | 203/8465 | 1.45e-25 | 1.61e-23 | 1.17e-23 | 103 |
| hsa054153 | Colorectum | SER | Diabetic cardiomyopathy | 103/1580 | 203/8465 | 1.45e-25 | 1.61e-23 | 1.17e-23 | 103 |
| hsa054154 | Colorectum | MSS | Diabetic cardiomyopathy | 106/1875 | 203/8465 | 2.47e-21 | 1.62e-19 | 9.92e-20 | 106 |
| hsa054155 | Colorectum | MSS | Diabetic cardiomyopathy | 106/1875 | 203/8465 | 2.47e-21 | 1.62e-19 | 9.92e-20 | 106 |
| hsa054158 | Colorectum | FAP | Diabetic cardiomyopathy | 70/1404 | 203/8465 | 2.62e-10 | 2.18e-08 | 1.33e-08 | 70 |
| hsa054159 | Colorectum | FAP | Diabetic cardiomyopathy | 70/1404 | 203/8465 | 2.62e-10 | 2.18e-08 | 1.33e-08 | 70 |
| hsa0541530 | Esophagus | HGIN | Diabetic cardiomyopathy | 80/1383 | 203/8465 | 1.35e-15 | 3.38e-14 | 2.69e-14 | 80 |
| hsa05415114 | Esophagus | HGIN | Diabetic cardiomyopathy | 80/1383 | 203/8465 | 1.35e-15 | 3.38e-14 | 2.69e-14 | 80 |
| hsa05415211 | Esophagus | ESCC | Diabetic cardiomyopathy | 146/4205 | 203/8465 | 5.81e-11 | 7.78e-10 | 3.99e-10 | 146 |
| hsa0541538 | Esophagus | ESCC | Diabetic cardiomyopathy | 146/4205 | 203/8465 | 5.81e-11 | 7.78e-10 | 3.99e-10 | 146 |
| hsa0541514 | Liver | Cirrhotic | Diabetic cardiomyopathy | 108/2530 | 203/8465 | 1.99e-12 | 4.41e-11 | 2.72e-11 | 108 |
| hsa0541515 | Liver | Cirrhotic | Diabetic cardiomyopathy | 108/2530 | 203/8465 | 1.99e-12 | 4.41e-11 | 2.72e-11 | 108 |
| hsa0541522 | Liver | HCC | Diabetic cardiomyopathy | 151/4020 | 203/8465 | 2.72e-15 | 1.01e-13 | 5.63e-14 | 151 |
| hsa0541532 | Liver | HCC | Diabetic cardiomyopathy | 151/4020 | 203/8465 | 2.72e-15 | 1.01e-13 | 5.63e-14 | 151 |
| hsa0541529 | Oral cavity | OSCC | Diabetic cardiomyopathy | 131/3704 | 203/8465 | 1.33e-09 | 1.49e-08 | 7.57e-09 | 131 |
| hsa05415113 | Oral cavity | OSCC | Diabetic cardiomyopathy | 131/3704 | 203/8465 | 1.33e-09 | 1.49e-08 | 7.57e-09 | 131 |
| hsa05415210 | Oral cavity | LP | Diabetic cardiomyopathy | 106/2418 | 203/8465 | 6.51e-13 | 1.36e-11 | 8.74e-12 | 106 |
| hsa0541537 | Oral cavity | LP | Diabetic cardiomyopathy | 106/2418 | 203/8465 | 6.51e-13 | 1.36e-11 | 8.74e-12 | 106 |
| Page: 1 2 |
Top |
Cell-cell communication analysis |
| Identification of potential cell-cell interactions between two cell types and their ligand-receptor pairs for different disease states |
| Ligand | Receptor | LRpair | Pathway | Tissue | Disease Stage |
| Page: 1 |
Top |
Single-cell gene regulatory network inference analysis |
| Find out the significant the regulons (TFs) and the target genes of each regulon across cell types for different disease states |
| TF | Cell Type | Tissue | Disease Stage | Target Gene | RSS | Regulon Activity |
| ∗The dot plots of a searched regulon are shown for all cell subpopulations in each disease state of each tissue based on the regulon specific score inferred using pySCENIC and by calculating the average expression. |
| Page: 1 |
Top |
Somatic mutation of malignant transformation related genes |
| Annotation of somatic variants for genes involved in malignant transformation |
| Hugo Symbol | Variant Class | Variant Classification | dbSNP RS | HGVSc | HGVSp | HGVSp Short | SWISSPROT | BIOTYPE | SIFT | PolyPhen | Tumor Sample Barcode | Tissue | Histology | Sex | Age | Stage | Therapy Types | Drugs | Outcome |
| MPC1 | SNV | Missense_Mutation | c.110N>T | p.Pro37Leu | p.P37L | Q9Y5U8 | protein_coding | deleterious(0) | probably_damaging(0.99) | TCGA-BH-A0HF-01 | Breast | breast invasive carcinoma | Female | >=65 | I/II | Hormone Therapy | arimidex | SD | |
| MPC1 | SNV | Missense_Mutation | rs139776186 | c.253N>A | p.Ala85Thr | p.A85T | Q9Y5U8 | protein_coding | tolerated(0.36) | benign(0.027) | TCGA-E2-A15D-01 | Breast | breast invasive carcinoma | Female | <65 | I/II | Hormone Therapy | tamoxiphen | SD |
| MPC1 | SNV | Missense_Mutation | c.253N>T | p.Ala85Ser | p.A85S | Q9Y5U8 | protein_coding | tolerated(0.46) | benign(0.047) | TCGA-05-4244-01 | Lung | lung adenocarcinoma | Male | >=65 | III/IV | Unknown | Unknown | SD | |
| MPC1 | SNV | Missense_Mutation | rs767692880 | c.41N>A | p.Arg14Gln | p.R14Q | Q9Y5U8 | protein_coding | tolerated(0.09) | benign(0.009) | TCGA-CN-5374-01 | Oral cavity | head & neck squamous cell carcinoma | Female | <65 | I/II | Chemotherapy | cisplatin | PD |
| MPC1 | SNV | Missense_Mutation | novel | c.84G>T | p.Trp28Cys | p.W28C | Q9Y5U8 | protein_coding | deleterious(0) | probably_damaging(0.999) | TCGA-KU-A66S-01 | Oral cavity | head & neck squamous cell carcinoma | Female | >=65 | III/IV | Unknown | Unknown | PD |
| MPC1 | insertion | Frame_Shift_Ins | novel | c.104_105insG | p.Leu36SerfsTer8 | p.L36Sfs*8 | Q9Y5U8 | protein_coding | TCGA-UF-A71D-01 | Oral cavity | head & neck squamous cell carcinoma | Female | <65 | I/II | Unknown | Unknown | SD | ||
| MPC1 | SNV | Missense_Mutation | rs753601697 | c.160N>T | p.Arg54Trp | p.R54W | Q9Y5U8 | protein_coding | deleterious(0) | benign(0.112) | TCGA-XK-AAIW-01 | Prostate | prostate adenocarcinoma | Male | >=65 | 9 | Unknown | Unknown | PD |
| MPC1 | SNV | Missense_Mutation | rs387907237 | c.289N>T | p.Arg97Trp | p.R97W | Q9Y5U8 | protein_coding | deleterious(0.01) | possibly_damaging(0.741) | TCGA-VQ-AA6D-01 | Stomach | stomach adenocarcinoma | Female | <65 | III/IV | Chemotherapy | fluorouracil | CR |
| MPC1 | SNV | Missense_Mutation | rs753601697 | c.160N>T | p.Arg54Trp | p.R54W | Q9Y5U8 | protein_coding | deleterious(0) | benign(0.112) | TCGA-VQ-AA6D-01 | Stomach | stomach adenocarcinoma | Female | <65 | III/IV | Chemotherapy | fluorouracil | CR |
| Page: 1 |
Top |
Related drugs of malignant transformation related genes |
| Identification of chemicals and drugs interact with genes involved in malignant transfromation |
| (DGIdb 4.0) |
| Entrez ID | Symbol | Category | Interaction Types | Drug Claim Name | Drug Name | PMIDs |
| Page: 1 |

Copyright 2023-Present -The University of Texas Health Science Center at Houston |