
|
|||||
|
 | |
| |
| |
| |
| |
| |
|
Gene: MOXD1 |
Gene summary for MOXD1 |
| Gene information | Species | Human | Gene symbol | MOXD1 | Gene ID | 26002 |
| Gene name | monooxygenase DBH like 1 | |
| Gene Alias | MOX | |
| Cytomap | 6q23.2 | |
| Gene Type | protein-coding | GO ID | GO:0001505 | UniProtAcc | Q6UVY6 |
Top |
Malignant transformation analysis |
| Identification of the aberrant gene expression in precancerous and cancerous lesions by comparing the gene expression of stem-like cells in diseased tissues with normal stem cells |
| Entrez ID | Symbol | Replicates | Species | Organ | Tissue | Adj P-value | Log2FC | Malignancy |
| 26002 | MOXD1 | LZE4T | Human | Esophagus | ESCC | 4.08e-03 | -4.09e-01 | 0.0811 |
| 26002 | MOXD1 | LZE8T | Human | Esophagus | ESCC | 1.53e-02 | -3.72e-01 | 0.067 |
| 26002 | MOXD1 | LZE20T | Human | Esophagus | ESCC | 1.08e-02 | -4.09e-01 | 0.0662 |
| 26002 | MOXD1 | LZE24T | Human | Esophagus | ESCC | 2.54e-05 | -4.09e-01 | 0.0596 |
| 26002 | MOXD1 | P2T-E | Human | Esophagus | ESCC | 1.03e-27 | 9.55e-01 | 0.1177 |
| 26002 | MOXD1 | P4T-E | Human | Esophagus | ESCC | 4.64e-05 | -1.93e-01 | 0.1323 |
| 26002 | MOXD1 | P9T-E | Human | Esophagus | ESCC | 1.63e-02 | -2.81e-01 | 0.1131 |
| 26002 | MOXD1 | P10T-E | Human | Esophagus | ESCC | 6.94e-07 | -3.75e-01 | 0.116 |
| 26002 | MOXD1 | P11T-E | Human | Esophagus | ESCC | 1.81e-05 | 1.41e-01 | 0.1426 |
| 26002 | MOXD1 | P16T-E | Human | Esophagus | ESCC | 3.80e-17 | -1.15e-01 | 0.1153 |
| 26002 | MOXD1 | P21T-E | Human | Esophagus | ESCC | 3.93e-27 | 9.32e-01 | 0.1617 |
| 26002 | MOXD1 | P22T-E | Human | Esophagus | ESCC | 3.36e-15 | -2.73e-01 | 0.1236 |
| 26002 | MOXD1 | P26T-E | Human | Esophagus | ESCC | 2.97e-11 | -3.03e-01 | 0.1276 |
| 26002 | MOXD1 | P30T-E | Human | Esophagus | ESCC | 1.80e-07 | 7.66e-01 | 0.137 |
| 26002 | MOXD1 | P31T-E | Human | Esophagus | ESCC | 4.12e-11 | -4.05e-01 | 0.1251 |
| 26002 | MOXD1 | P32T-E | Human | Esophagus | ESCC | 8.17e-04 | -2.47e-01 | 0.1666 |
| 26002 | MOXD1 | P39T-E | Human | Esophagus | ESCC | 1.91e-08 | -2.87e-01 | 0.0894 |
| 26002 | MOXD1 | P52T-E | Human | Esophagus | ESCC | 9.20e-03 | -3.55e-01 | 0.1555 |
| 26002 | MOXD1 | P56T-E | Human | Esophagus | ESCC | 3.26e-04 | 1.30e+00 | 0.1613 |
| 26002 | MOXD1 | P61T-E | Human | Esophagus | ESCC | 2.87e-06 | -3.35e-01 | 0.099 |
| Page: 1 2 3 |
| Tissue | Expression Dynamics | Abbreviation |
| Esophagus | 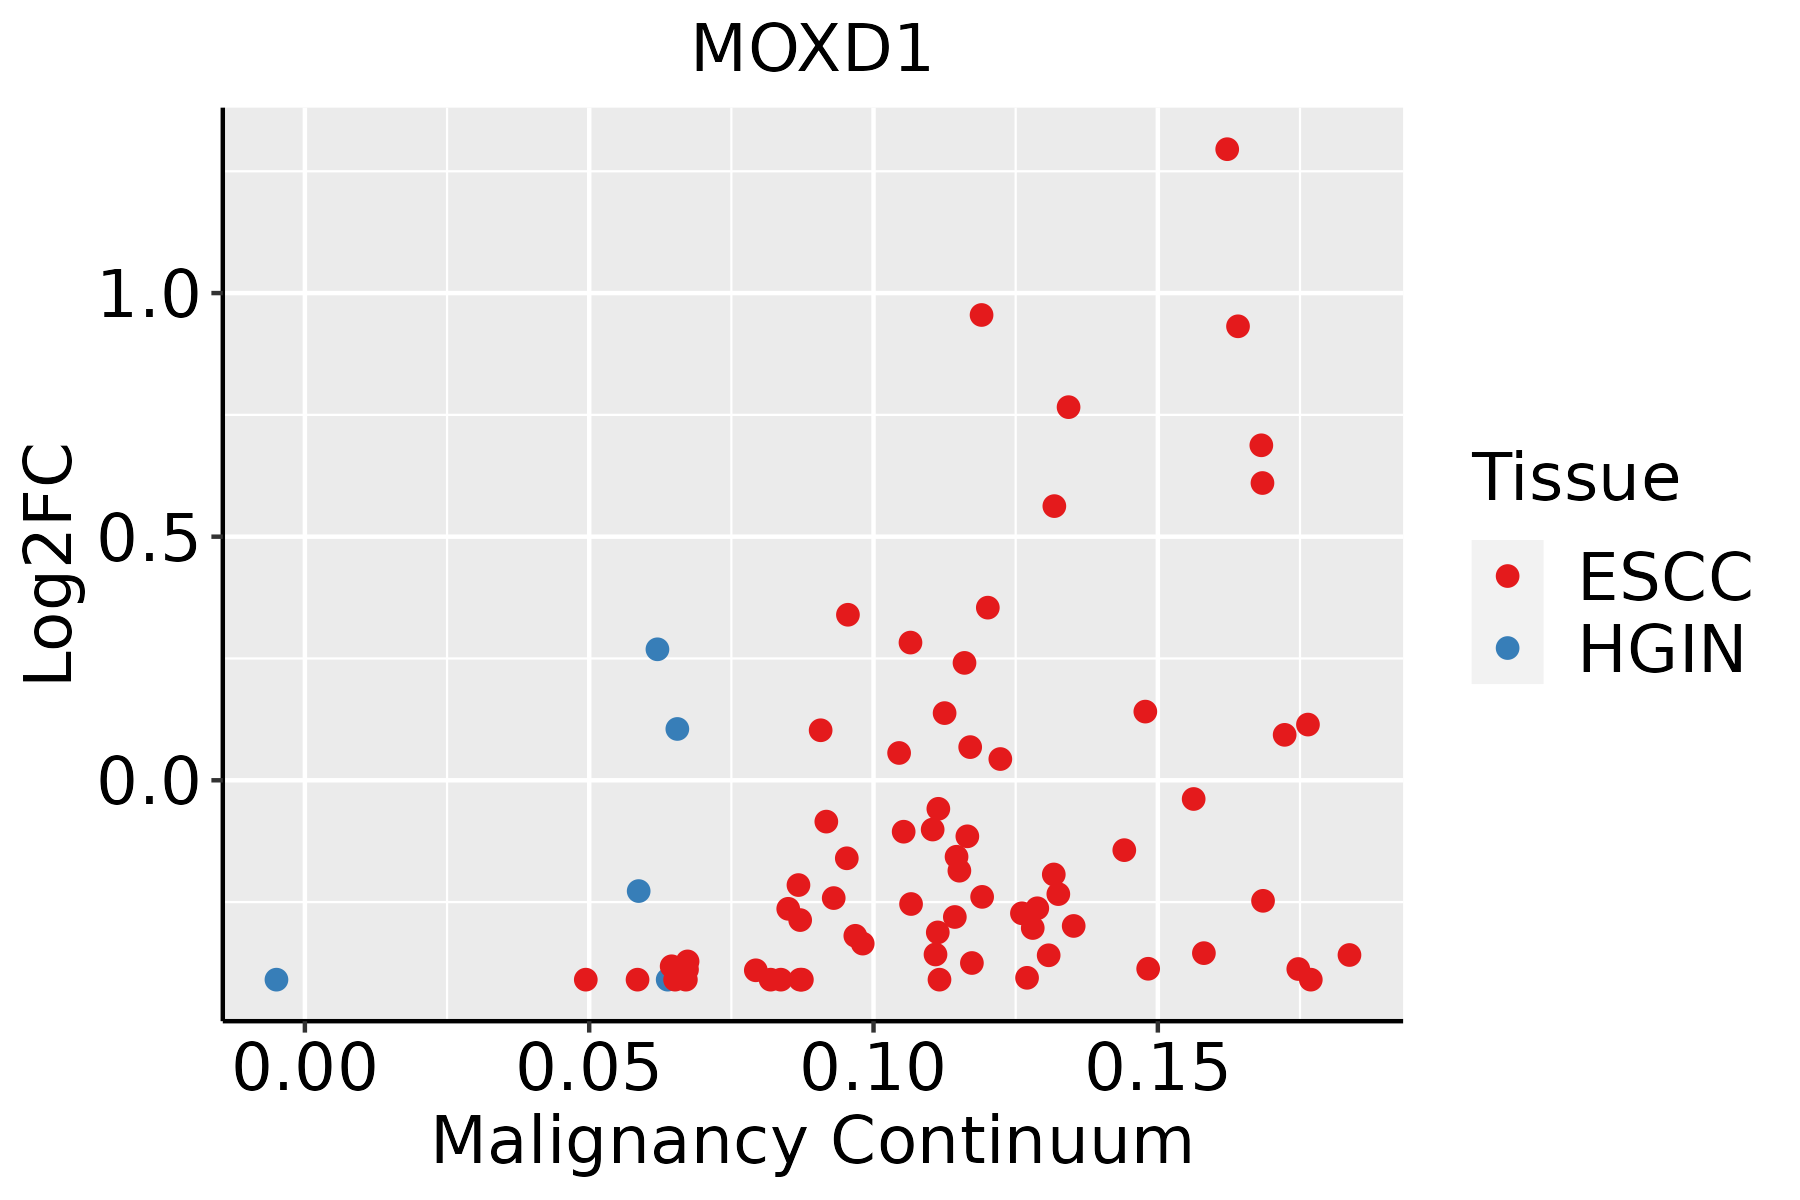 | ESCC: Esophageal squamous cell carcinoma |
| HGIN: High-grade intraepithelial neoplasias | ||
| LGIN: Low-grade intraepithelial neoplasias | ||
| Oral Cavity |  | EOLP: Erosive Oral lichen planus |
| LP: leukoplakia | ||
| NEOLP: Non-erosive oral lichen planus | ||
| OSCC: Oral squamous cell carcinoma | ||
| Skin | 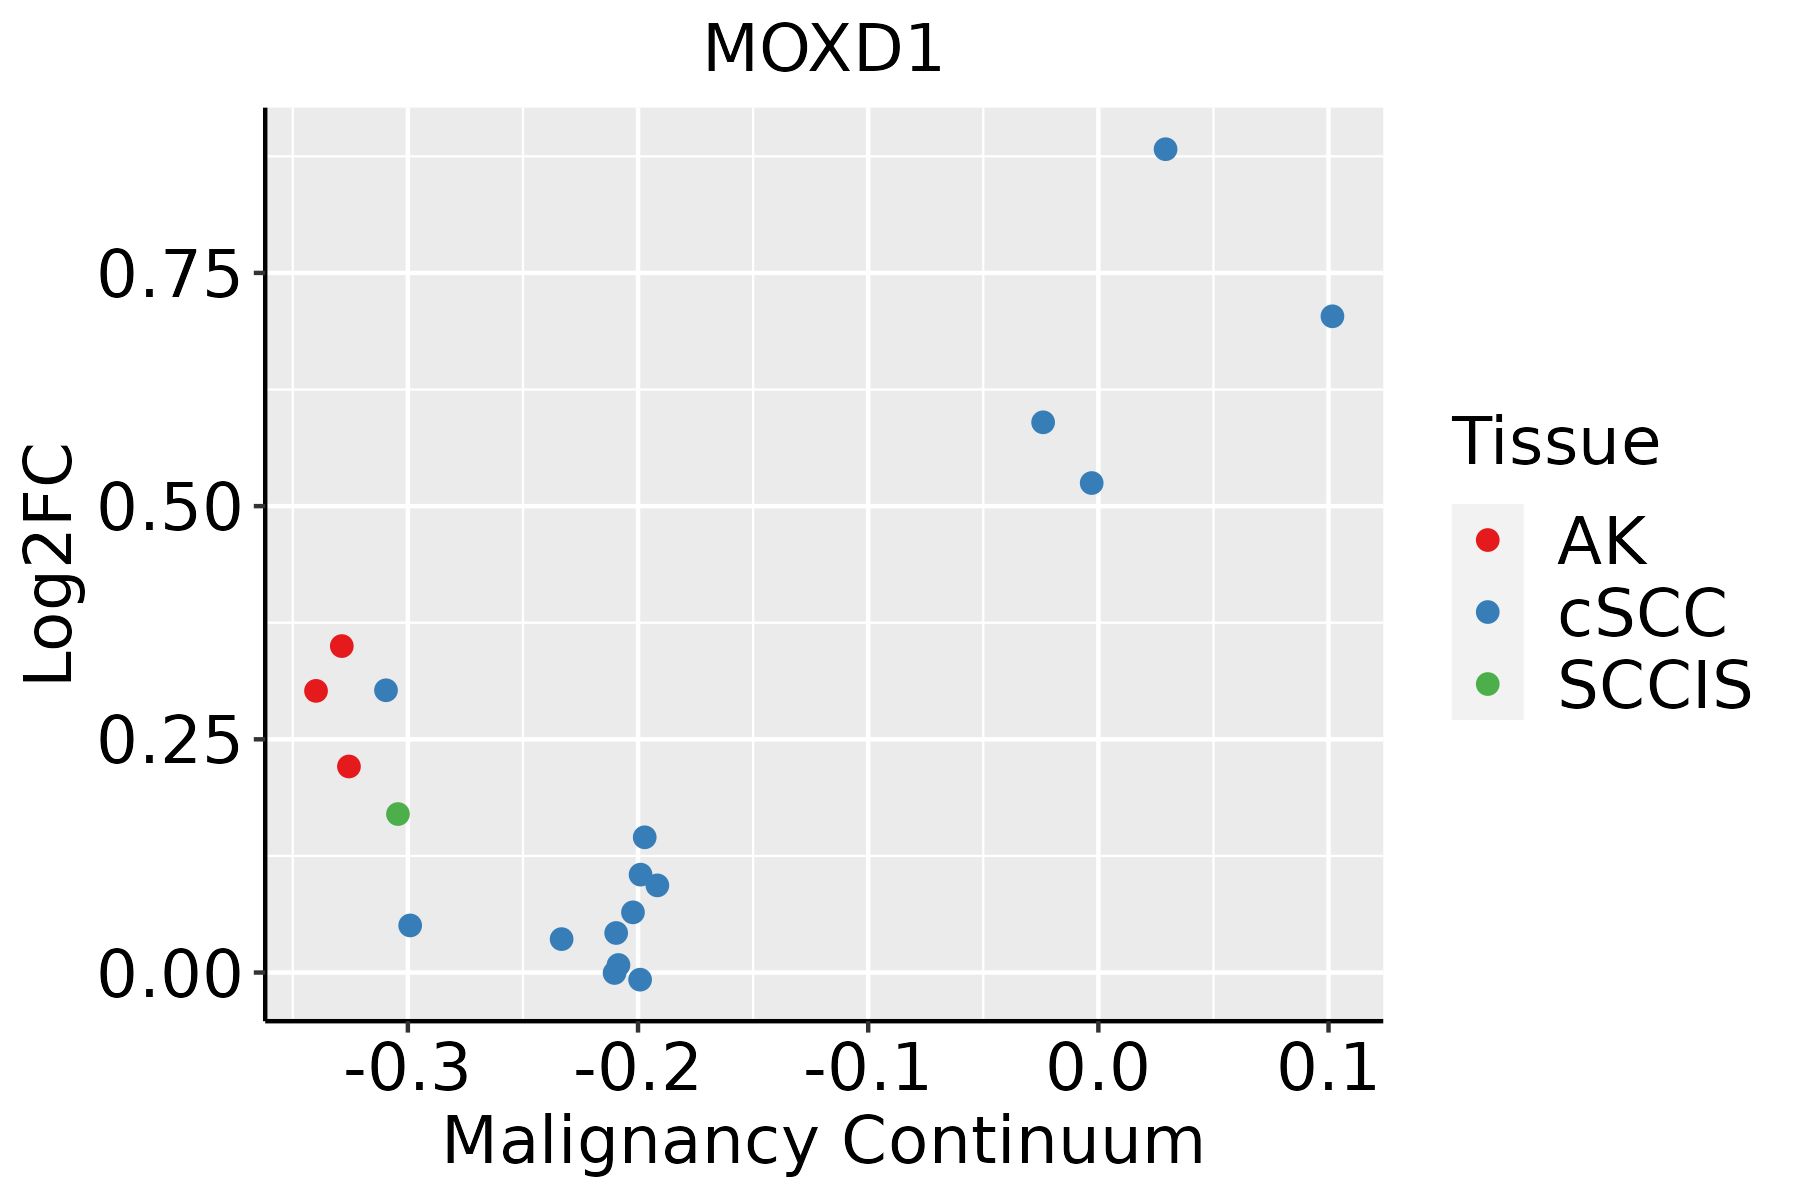 | AK: Actinic keratosis |
| cSCC: Cutaneous squamous cell carcinoma | ||
| SCCIS:squamous cell carcinoma in situ |
| ∗log2FC in expression of this searched gene in stem-like cells from each diseased tissue sample relative to stem-like cells in normal samples in each tissue plotted against the malignancy continuum. Samples are colored based on if they are from different disease stage. |
Top |
Malignant transformation related pathway analysis |
| Find out the enriched GO biological processes and KEGG pathways involved in transition from healthy to precancer to cancer |
| Tissue | Disease Stage | Enriched GO biological Processes |
| Colorectum | AD |  |
| Colorectum | SER |  |
| Colorectum | MSS |  |
| Colorectum | MSI-H |  |
| Colorectum | FAP |  |
| ∗Top 15 enriched GO BP terms are showed in the bar plot of each disease state in each tissue. Each row represents a significant GO biological process which is colored according to the -log10(p.adjust). |
| Page: 1 2 3 4 5 6 7 8 9 |
| GO ID | Tissue | Disease Stage | Description | Gene Ratio | Bg Ratio | pvalue | p.adjust | Count |
| GO:001943918 | Esophagus | ESCC | aromatic compound catabolic process | 295/8552 | 467/18723 | 1.09e-14 | 5.98e-13 | 295 |
| GO:190136118 | Esophagus | ESCC | organic cyclic compound catabolic process | 307/8552 | 495/18723 | 9.99e-14 | 4.80e-12 | 307 |
| GO:00060668 | Esophagus | ESCC | alcohol metabolic process | 202/8552 | 353/18723 | 7.32e-06 | 7.26e-05 | 202 |
| GO:00461653 | Esophagus | ESCC | alcohol biosynthetic process | 83/8552 | 140/18723 | 8.04e-04 | 4.16e-03 | 83 |
| GO:19016174 | Esophagus | ESCC | organic hydroxy compound biosynthetic process | 128/8552 | 237/18723 | 5.86e-03 | 2.16e-02 | 128 |
| GO:001943915 | Oral cavity | OSCC | aromatic compound catabolic process | 263/7305 | 467/18723 | 1.49e-14 | 8.84e-13 | 263 |
| GO:190136115 | Oral cavity | OSCC | organic cyclic compound catabolic process | 272/7305 | 495/18723 | 2.73e-13 | 1.36e-11 | 272 |
| GO:00060667 | Oral cavity | OSCC | alcohol metabolic process | 179/7305 | 353/18723 | 4.54e-06 | 5.21e-05 | 179 |
| GO:00461652 | Oral cavity | OSCC | alcohol biosynthetic process | 77/7305 | 140/18723 | 8.77e-05 | 6.70e-04 | 77 |
| GO:19016173 | Oral cavity | OSCC | organic hydroxy compound biosynthetic process | 115/7305 | 237/18723 | 1.73e-03 | 8.18e-03 | 115 |
| GO:001943916 | Oral cavity | LP | aromatic compound catabolic process | 176/4623 | 467/18723 | 1.96e-10 | 1.08e-08 | 176 |
| GO:190136116 | Oral cavity | LP | organic cyclic compound catabolic process | 180/4623 | 495/18723 | 3.11e-09 | 1.35e-07 | 180 |
| GO:000606613 | Oral cavity | LP | alcohol metabolic process | 111/4623 | 353/18723 | 2.24e-03 | 1.62e-02 | 111 |
| GO:001943919 | Skin | AK | aromatic compound catabolic process | 65/1910 | 467/18723 | 5.99e-03 | 3.24e-02 | 65 |
| GO:190136119 | Skin | AK | organic cyclic compound catabolic process | 67/1910 | 495/18723 | 9.91e-03 | 4.80e-02 | 67 |
| GO:00424014 | Skin | AK | cellular biogenic amine biosynthetic process | 9/1910 | 37/18723 | 1.04e-02 | 4.95e-02 | 9 |
| GO:0019439110 | Skin | cSCC | aromatic compound catabolic process | 183/4864 | 467/18723 | 1.76e-10 | 7.68e-09 | 183 |
| GO:1901361110 | Skin | cSCC | organic cyclic compound catabolic process | 188/4864 | 495/18723 | 1.92e-09 | 7.01e-08 | 188 |
| GO:00461654 | Skin | cSCC | alcohol biosynthetic process | 50/4864 | 140/18723 | 6.73e-03 | 3.27e-02 | 50 |
| Page: 1 |
| Pathway ID | Tissue | Disease Stage | Description | Gene Ratio | Bg Ratio | pvalue | p.adjust | qvalue | Count |
| Page: 1 |
Top |
Cell-cell communication analysis |
| Identification of potential cell-cell interactions between two cell types and their ligand-receptor pairs for different disease states |
| Ligand | Receptor | LRpair | Pathway | Tissue | Disease Stage |
| Page: 1 |
Top |
Single-cell gene regulatory network inference analysis |
| Find out the significant the regulons (TFs) and the target genes of each regulon across cell types for different disease states |
| TF | Cell Type | Tissue | Disease Stage | Target Gene | RSS | Regulon Activity |
| ∗The dot plots of a searched regulon are shown for all cell subpopulations in each disease state of each tissue based on the regulon specific score inferred using pySCENIC and by calculating the average expression. |
| Page: 1 |
Top |
Somatic mutation of malignant transformation related genes |
| Annotation of somatic variants for genes involved in malignant transformation |
| Hugo Symbol | Variant Class | Variant Classification | dbSNP RS | HGVSc | HGVSp | HGVSp Short | SWISSPROT | BIOTYPE | SIFT | PolyPhen | Tumor Sample Barcode | Tissue | Histology | Sex | Age | Stage | Therapy Types | Drugs | Outcome |
| MOXD1 | SNV | Missense_Mutation | rs753937080 | c.1069G>A | p.Glu357Lys | p.E357K | Q6UVY6 | protein_coding | tolerated(0.12) | benign(0.068) | TCGA-AC-A23H-01 | Breast | breast invasive carcinoma | Female | >=65 | I/II | Unknown | Unknown | PD |
| MOXD1 | SNV | Missense_Mutation | rs138817081 | c.1330N>T | p.Arg444Cys | p.R444C | Q6UVY6 | protein_coding | tolerated(0.2) | benign(0.022) | TCGA-BH-A0HF-01 | Breast | breast invasive carcinoma | Female | >=65 | I/II | Hormone Therapy | arimidex | SD |
| MOXD1 | SNV | Missense_Mutation | c.1711G>C | p.Glu571Gln | p.E571Q | Q6UVY6 | protein_coding | tolerated(0.12) | benign(0.001) | TCGA-GI-A2C8-01 | Breast | breast invasive carcinoma | Female | <65 | III/IV | Unspecific | Adriamycin | SD | |
| MOXD1 | SNV | Missense_Mutation | rs760605242 | c.1187G>A | p.Gly396Asp | p.G396D | Q6UVY6 | protein_coding | deleterious(0.02) | benign(0.111) | TCGA-2W-A8YY-01 | Cervix | cervical & endocervical cancer | Female | <65 | I/II | Chemotherapy | cisplatin | CR |
| MOXD1 | SNV | Missense_Mutation | novel | c.1408N>A | p.Leu470Ile | p.L470I | Q6UVY6 | protein_coding | deleterious(0.04) | possibly_damaging(0.823) | TCGA-FU-A3HZ-01 | Cervix | cervical & endocervical cancer | Female | <65 | I/II | Chemotherapy | cisplatin | CR |
| MOXD1 | SNV | Missense_Mutation | c.1765N>A | p.Leu589Met | p.L589M | Q6UVY6 | protein_coding | tolerated_low_confidence(0.06) | benign(0.206) | TCGA-A6-2686-01 | Colorectum | colon adenocarcinoma | Female | >=65 | I/II | Unknown | Unknown | SD | |
| MOXD1 | SNV | Missense_Mutation | c.1276N>C | p.Tyr426His | p.Y426H | Q6UVY6 | protein_coding | deleterious(0.04) | benign(0.101) | TCGA-A6-2686-01 | Colorectum | colon adenocarcinoma | Female | >=65 | I/II | Unknown | Unknown | SD | |
| MOXD1 | SNV | Missense_Mutation | c.1556C>A | p.Ser519Tyr | p.S519Y | Q6UVY6 | protein_coding | deleterious(0) | probably_damaging(0.948) | TCGA-AA-3977-01 | Colorectum | colon adenocarcinoma | Male | >=65 | I/II | Unknown | Unknown | SD | |
| MOXD1 | SNV | Missense_Mutation | rs768904208 | c.742N>A | p.Asp248Asn | p.D248N | Q6UVY6 | protein_coding | tolerated(0.18) | benign(0.165) | TCGA-AA-3984-01 | Colorectum | colon adenocarcinoma | Female | <65 | I/II | Unknown | Unknown | SD |
| MOXD1 | SNV | Missense_Mutation | c.820T>G | p.Phe274Val | p.F274V | Q6UVY6 | protein_coding | tolerated(0.12) | benign(0.02) | TCGA-AA-A00N-01 | Colorectum | colon adenocarcinoma | Male | >=65 | I/II | Unknown | Unknown | PD |
| Page: 1 2 3 4 5 6 7 8 |
Top |
Related drugs of malignant transformation related genes |
| Identification of chemicals and drugs interact with genes involved in malignant transfromation |
| (DGIdb 4.0) |
| Entrez ID | Symbol | Category | Interaction Types | Drug Claim Name | Drug Name | PMIDs |
| Page: 1 |

Copyright 2023-Present -The University of Texas Health Science Center at Houston |