
|
|||||
|
 | |
| |
| |
| |
| |
| |
|
Gene: MOSPD3 |
Gene summary for MOSPD3 |
| Gene information | Species | Human | Gene symbol | MOSPD3 | Gene ID | 64598 |
| Gene name | motile sperm domain containing 3 | |
| Gene Alias | CDS3 | |
| Cytomap | 7q22.1 | |
| Gene Type | protein-coding | GO ID | GO:0006996 | UniProtAcc | O75425 |
Top |
Malignant transformation analysis |
| Identification of the aberrant gene expression in precancerous and cancerous lesions by comparing the gene expression of stem-like cells in diseased tissues with normal stem cells |
| Entrez ID | Symbol | Replicates | Species | Organ | Tissue | Adj P-value | Log2FC | Malignancy |
| 64598 | MOSPD3 | HTA11_1938_2000001011 | Human | Colorectum | AD | 3.50e-04 | 2.14e-01 | -0.0811 |
| 64598 | MOSPD3 | HTA11_78_2000001011 | Human | Colorectum | AD | 8.81e-04 | 1.84e-01 | -0.1088 |
| 64598 | MOSPD3 | HTA11_347_2000001011 | Human | Colorectum | AD | 1.01e-04 | 1.49e-01 | -0.1954 |
| 64598 | MOSPD3 | HTA11_696_2000001011 | Human | Colorectum | AD | 4.38e-06 | 1.44e-01 | -0.1464 |
| 64598 | MOSPD3 | HTA11_866_2000001011 | Human | Colorectum | AD | 3.85e-03 | 1.04e-01 | -0.1001 |
| 64598 | MOSPD3 | HTA11_1391_2000001011 | Human | Colorectum | AD | 5.95e-10 | 3.14e-01 | -0.059 |
| 64598 | MOSPD3 | HTA11_546_2000001011 | Human | Colorectum | AD | 9.97e-04 | 2.08e-01 | -0.0842 |
| 64598 | MOSPD3 | HTA11_866_3004761011 | Human | Colorectum | AD | 1.98e-03 | 1.42e-01 | 0.096 |
| 64598 | MOSPD3 | HTA11_9408_2000001011 | Human | Colorectum | AD | 3.36e-05 | 4.61e-01 | 0.0451 |
| 64598 | MOSPD3 | HTA11_10623_2000001011 | Human | Colorectum | AD | 2.62e-03 | 2.75e-01 | -0.0177 |
| 64598 | MOSPD3 | HTA11_10711_2000001011 | Human | Colorectum | AD | 1.04e-04 | 1.86e-01 | 0.0338 |
| 64598 | MOSPD3 | HTA11_7696_3000711011 | Human | Colorectum | AD | 3.52e-13 | 2.48e-01 | 0.0674 |
| 64598 | MOSPD3 | HTA11_99999970781_79442 | Human | Colorectum | MSS | 9.04e-05 | 1.24e-01 | 0.294 |
| 64598 | MOSPD3 | HTA11_99999971662_82457 | Human | Colorectum | MSS | 2.07e-08 | 1.92e-01 | 0.3859 |
| 64598 | MOSPD3 | HTA11_99999973899_84307 | Human | Colorectum | MSS | 4.92e-02 | 1.78e-01 | 0.2585 |
| 64598 | MOSPD3 | HTA11_99999974143_84620 | Human | Colorectum | MSS | 4.28e-10 | 2.22e-01 | 0.3005 |
| 64598 | MOSPD3 | LZE4T | Human | Esophagus | ESCC | 4.42e-03 | 1.17e-01 | 0.0811 |
| 64598 | MOSPD3 | LZE7T | Human | Esophagus | ESCC | 1.94e-03 | 1.86e-01 | 0.0667 |
| 64598 | MOSPD3 | LZE20T | Human | Esophagus | ESCC | 8.63e-14 | 4.00e-01 | 0.0662 |
| 64598 | MOSPD3 | LZE22D1 | Human | Esophagus | HGIN | 3.29e-05 | 2.81e-01 | 0.0595 |
| Page: 1 2 3 4 5 6 |
| Tissue | Expression Dynamics | Abbreviation |
| Colorectum (GSE201348) |  | FAP: Familial adenomatous polyposis |
| CRC: Colorectal cancer | ||
| Colorectum (HTA11) |  | AD: Adenomas |
| SER: Sessile serrated lesions | ||
| MSI-H: Microsatellite-high colorectal cancer | ||
| MSS: Microsatellite stable colorectal cancer | ||
| Esophagus | 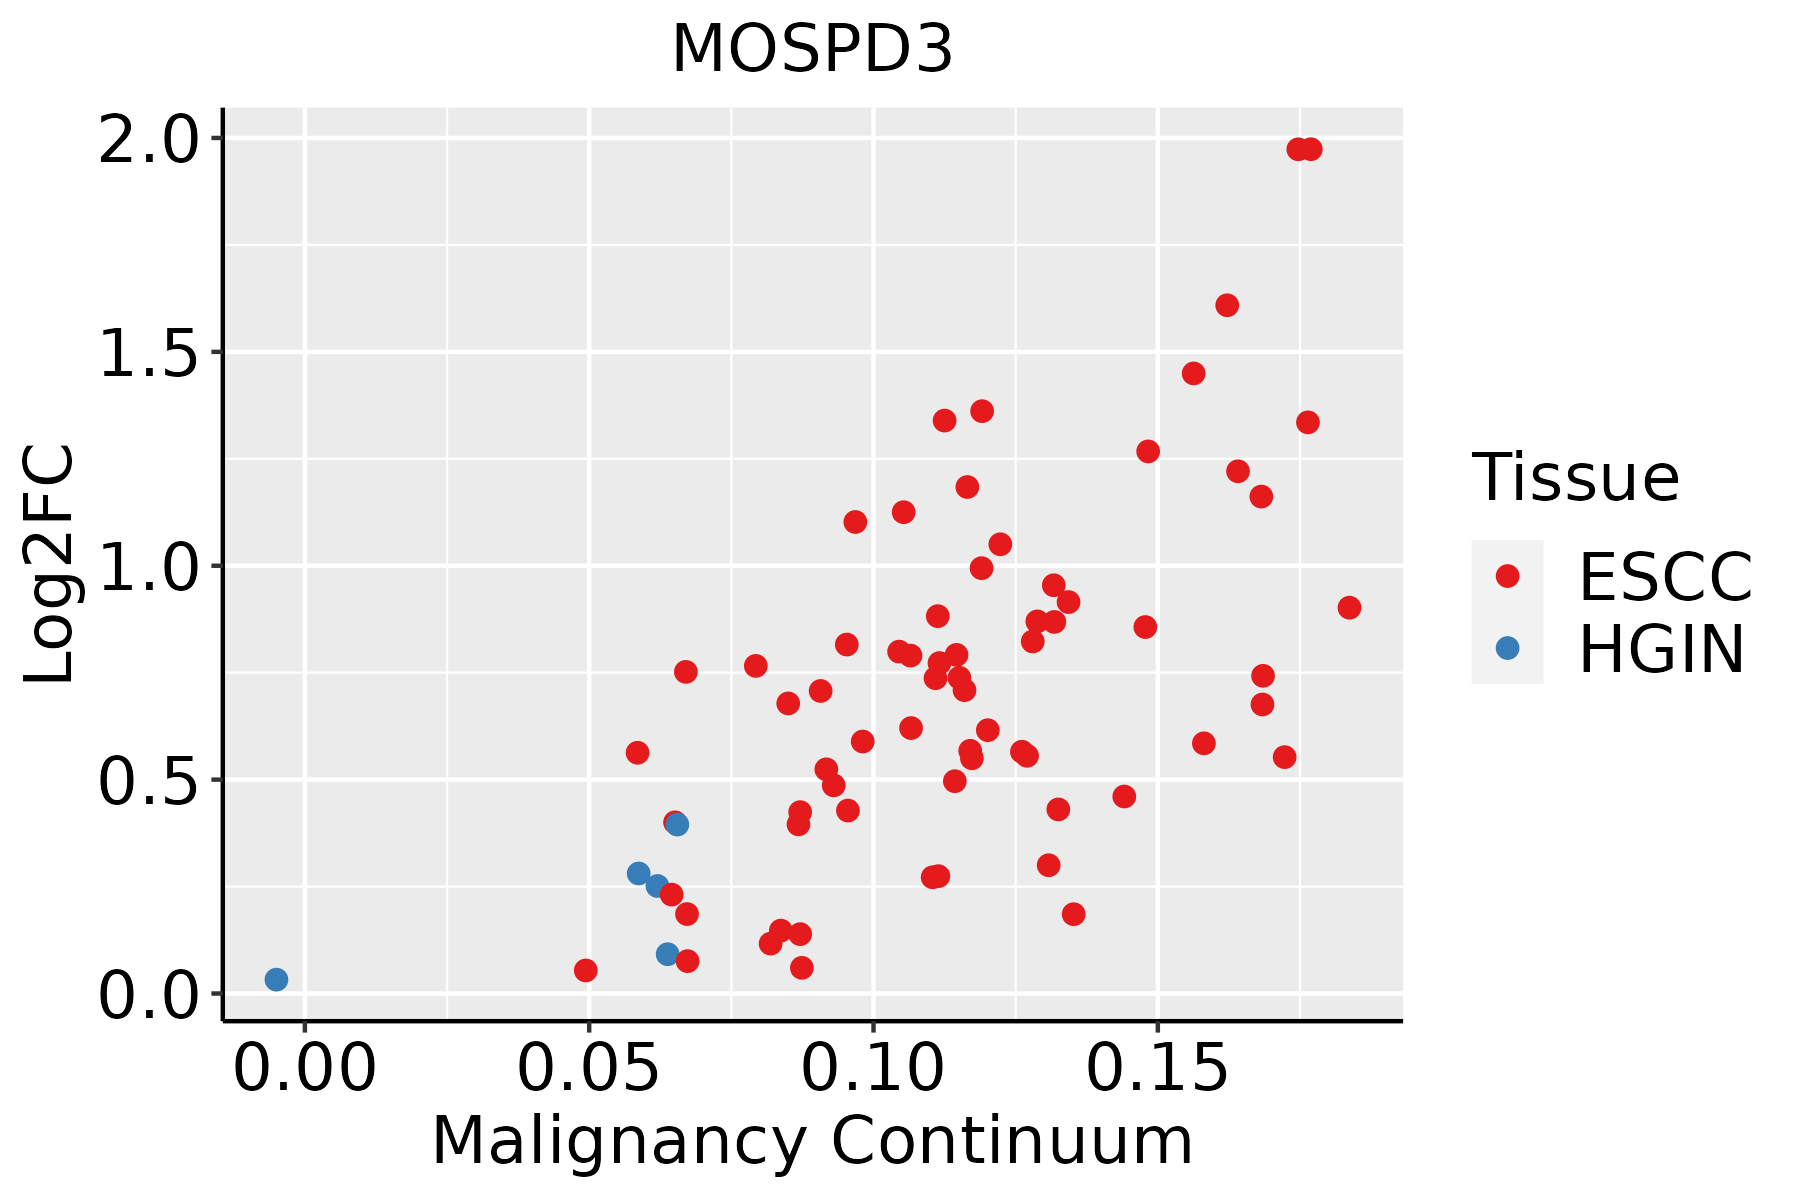 | ESCC: Esophageal squamous cell carcinoma |
| HGIN: High-grade intraepithelial neoplasias | ||
| LGIN: Low-grade intraepithelial neoplasias | ||
| Liver |  | HCC: Hepatocellular carcinoma |
| NAFLD: Non-alcoholic fatty liver disease | ||
| Oral Cavity |  | EOLP: Erosive Oral lichen planus |
| LP: leukoplakia | ||
| NEOLP: Non-erosive oral lichen planus | ||
| OSCC: Oral squamous cell carcinoma |
| ∗log2FC in expression of this searched gene in stem-like cells from each diseased tissue sample relative to stem-like cells in normal samples in each tissue plotted against the malignancy continuum. Samples are colored based on if they are from different disease stage. |
Top |
Malignant transformation related pathway analysis |
| Find out the enriched GO biological processes and KEGG pathways involved in transition from healthy to precancer to cancer |
| Tissue | Disease Stage | Enriched GO biological Processes |
| Colorectum | AD |  |
| Colorectum | SER |  |
| Colorectum | MSS |  |
| Colorectum | MSI-H |  |
| Colorectum | FAP |  |
| ∗Top 15 enriched GO BP terms are showed in the bar plot of each disease state in each tissue. Each row represents a significant GO biological process which is colored according to the -log10(p.adjust). |
| Page: 1 2 3 4 5 6 7 8 9 |
| GO ID | Tissue | Disease Stage | Description | Gene Ratio | Bg Ratio | pvalue | p.adjust | Count |
| GO:0022406 | Colorectum | AD | membrane docking | 31/3918 | 86/18723 | 8.67e-04 | 8.45e-03 | 31 |
| GO:0007029 | Colorectum | AD | endoplasmic reticulum organization | 31/3918 | 87/18723 | 1.08e-03 | 1.00e-02 | 31 |
| GO:0140056 | Colorectum | AD | organelle localization by membrane tethering | 28/3918 | 77/18723 | 1.29e-03 | 1.14e-02 | 28 |
| GO:00224062 | Colorectum | MSS | membrane docking | 28/3467 | 86/18723 | 1.27e-03 | 1.21e-02 | 28 |
| GO:01400562 | Colorectum | MSS | organelle localization by membrane tethering | 25/3467 | 77/18723 | 2.34e-03 | 1.91e-02 | 25 |
| GO:00070295 | Esophagus | HGIN | endoplasmic reticulum organization | 22/2587 | 87/18723 | 3.07e-03 | 2.90e-02 | 22 |
| GO:000702914 | Esophagus | ESCC | endoplasmic reticulum organization | 65/8552 | 87/18723 | 3.28e-08 | 6.08e-07 | 65 |
| GO:00224069 | Esophagus | ESCC | membrane docking | 62/8552 | 86/18723 | 5.93e-07 | 7.79e-06 | 62 |
| GO:01400567 | Esophagus | ESCC | organelle localization by membrane tethering | 53/8552 | 77/18723 | 3.33e-05 | 2.74e-04 | 53 |
| GO:00070292 | Liver | Cirrhotic | endoplasmic reticulum organization | 42/4634 | 87/18723 | 1.67e-06 | 3.22e-05 | 42 |
| GO:00224065 | Liver | Cirrhotic | membrane docking | 39/4634 | 86/18723 | 2.47e-05 | 3.22e-04 | 39 |
| GO:01400565 | Liver | Cirrhotic | organelle localization by membrane tethering | 32/4634 | 77/18723 | 8.65e-04 | 6.23e-03 | 32 |
| GO:000702911 | Liver | HCC | endoplasmic reticulum organization | 64/7958 | 87/18723 | 3.92e-09 | 1.04e-07 | 64 |
| GO:002240611 | Liver | HCC | membrane docking | 57/7958 | 86/18723 | 7.14e-06 | 8.47e-05 | 57 |
| GO:014005611 | Liver | HCC | organelle localization by membrane tethering | 49/7958 | 77/18723 | 1.46e-04 | 1.18e-03 | 49 |
| GO:0090158 | Liver | HCC | endoplasmic reticulum membrane organization | 10/7958 | 13/18723 | 1.28e-02 | 4.61e-02 | 10 |
| GO:00070294 | Oral cavity | OSCC | endoplasmic reticulum organization | 58/7305 | 87/18723 | 1.59e-07 | 2.61e-06 | 58 |
| GO:00224068 | Oral cavity | OSCC | membrane docking | 52/7305 | 86/18723 | 4.50e-05 | 3.84e-04 | 52 |
| GO:01400566 | Oral cavity | OSCC | organelle localization by membrane tethering | 43/7305 | 77/18723 | 2.00e-03 | 9.28e-03 | 43 |
| GO:00901581 | Oral cavity | OSCC | endoplasmic reticulum membrane organization | 10/7305 | 13/18723 | 6.32e-03 | 2.35e-02 | 10 |
| Page: 1 2 |
| Pathway ID | Tissue | Disease Stage | Description | Gene Ratio | Bg Ratio | pvalue | p.adjust | qvalue | Count |
| Page: 1 |
Top |
Cell-cell communication analysis |
| Identification of potential cell-cell interactions between two cell types and their ligand-receptor pairs for different disease states |
| Ligand | Receptor | LRpair | Pathway | Tissue | Disease Stage |
| Page: 1 |
Top |
Single-cell gene regulatory network inference analysis |
| Find out the significant the regulons (TFs) and the target genes of each regulon across cell types for different disease states |
| TF | Cell Type | Tissue | Disease Stage | Target Gene | RSS | Regulon Activity |
| ∗The dot plots of a searched regulon are shown for all cell subpopulations in each disease state of each tissue based on the regulon specific score inferred using pySCENIC and by calculating the average expression. |
| Page: 1 |
Top |
Somatic mutation of malignant transformation related genes |
| Annotation of somatic variants for genes involved in malignant transformation |
| Hugo Symbol | Variant Class | Variant Classification | dbSNP RS | HGVSc | HGVSp | HGVSp Short | SWISSPROT | BIOTYPE | SIFT | PolyPhen | Tumor Sample Barcode | Tissue | Histology | Sex | Age | Stage | Therapy Types | Drugs | Outcome |
| MOSPD3 | deletion | Frame_Shift_Del | novel | c.238delN | p.Phe80LeufsTer7 | p.F80Lfs*7 | O75425 | protein_coding | TCGA-D8-A27V-01 | Breast | breast invasive carcinoma | Female | <65 | I/II | Hormone Therapy | tamoxiphen | SD | ||
| MOSPD3 | SNV | Missense_Mutation | rs757636025 | c.28G>A | p.Glu10Lys | p.E10K | O75425 | protein_coding | deleterious_low_confidence(0.01) | benign(0.034) | TCGA-2W-A8YY-01 | Cervix | cervical & endocervical cancer | Female | <65 | I/II | Chemotherapy | cisplatin | CR |
| MOSPD3 | SNV | Missense_Mutation | rs761672945 | c.604G>A | p.Glu202Lys | p.E202K | O75425 | protein_coding | tolerated(0.05) | possibly_damaging(0.695) | TCGA-AA-3815-01 | Colorectum | colon adenocarcinoma | Female | >=65 | I/II | Unknown | Unknown | SD |
| MOSPD3 | SNV | Missense_Mutation | c.691N>A | p.Val231Met | p.V231M | O75425 | protein_coding | deleterious(0) | probably_damaging(0.995) | TCGA-EI-6507-01 | Colorectum | rectum adenocarcinoma | Male | <65 | I/II | Unknown | Unknown | SD | |
| MOSPD3 | SNV | Missense_Mutation | novel | c.313C>A | p.His105Asn | p.H105N | O75425 | protein_coding | tolerated(0.66) | benign(0) | TCGA-A5-A0G2-01 | Endometrium | uterine corpus endometrioid carcinoma | Female | <65 | III/IV | Unknown | Unknown | SD |
| MOSPD3 | SNV | Missense_Mutation | rs373438135 | c.338N>A | p.Arg113His | p.R113H | O75425 | protein_coding | deleterious(0.02) | probably_damaging(0.998) | TCGA-AX-A1CE-01 | Endometrium | uterine corpus endometrioid carcinoma | Female | <65 | I/II | Unspecific | Paclitaxel | SD |
| MOSPD3 | SNV | Missense_Mutation | rs770930212 | c.289C>T | p.Arg97Cys | p.R97C | O75425 | protein_coding | deleterious(0) | probably_damaging(0.996) | TCGA-AX-A2HC-01 | Endometrium | uterine corpus endometrioid carcinoma | Female | <65 | III/IV | Chemotherapy | paclitaxel | PD |
| MOSPD3 | SNV | Missense_Mutation | novel | c.103N>A | p.Leu35Met | p.L35M | O75425 | protein_coding | deleterious(0.01) | probably_damaging(0.977) | TCGA-B5-A1MX-01 | Endometrium | uterine corpus endometrioid carcinoma | Female | <65 | I/II | Hormone Therapy | megace | SD |
| MOSPD3 | SNV | Missense_Mutation | novel | c.311N>T | p.Ser104Ile | p.S104I | O75425 | protein_coding | tolerated(0.09) | possibly_damaging(0.465) | TCGA-EY-A215-01 | Endometrium | uterine corpus endometrioid carcinoma | Female | <65 | I/II | Unknown | Unknown | SD |
| MOSPD3 | SNV | Missense_Mutation | rs761404739 | c.416N>T | p.Ala139Val | p.A139V | O75425 | protein_coding | tolerated(0.05) | benign(0.017) | TCGA-G3-A3CH-01 | Liver | liver hepatocellular carcinoma | Male | <65 | III/IV | Targeted Molecular therapy | sorafenib | SD |
| Page: 1 2 3 |
Top |
Related drugs of malignant transformation related genes |
| Identification of chemicals and drugs interact with genes involved in malignant transfromation |
| (DGIdb 4.0) |
| Entrez ID | Symbol | Category | Interaction Types | Drug Claim Name | Drug Name | PMIDs |
| Page: 1 |

Copyright 2023-Present -The University of Texas Health Science Center at Houston |