
|
|||||
|
 | |
| |
| |
| |
| |
| |
|
Gene: MOSMO |
Gene summary for MOSMO |
| Gene information | Species | Human | Gene symbol | MOSMO | Gene ID | 730094 |
| Gene name | modulator of smoothened | |
| Gene Alias | ATTHOG | |
| Cytomap | 16p12.2 | |
| Gene Type | protein-coding | GO ID | GO:0007154 | UniProtAcc | Q8NHV5 |
Top |
Malignant transformation analysis |
| Identification of the aberrant gene expression in precancerous and cancerous lesions by comparing the gene expression of stem-like cells in diseased tissues with normal stem cells |
| Entrez ID | Symbol | Replicates | Species | Organ | Tissue | Adj P-value | Log2FC | Malignancy |
| 730094 | MOSMO | AEH-subject1 | Human | Endometrium | AEH | 1.78e-10 | 2.78e-01 | -0.3059 |
| 730094 | MOSMO | AEH-subject2 | Human | Endometrium | AEH | 7.86e-04 | 1.51e-01 | -0.2525 |
| 730094 | MOSMO | AEH-subject3 | Human | Endometrium | AEH | 1.82e-05 | 1.86e-01 | -0.2576 |
| 730094 | MOSMO | AEH-subject4 | Human | Endometrium | AEH | 9.74e-11 | 3.21e-01 | -0.2657 |
| 730094 | MOSMO | AEH-subject5 | Human | Endometrium | AEH | 1.75e-04 | 1.36e-01 | -0.2953 |
| 730094 | MOSMO | EEC-subject1 | Human | Endometrium | EEC | 4.07e-08 | 2.30e-01 | -0.2682 |
| 730094 | MOSMO | EEC-subject2 | Human | Endometrium | EEC | 8.49e-10 | 1.88e-01 | -0.2607 |
| 730094 | MOSMO | EEC-subject3 | Human | Endometrium | EEC | 3.72e-11 | 3.09e-01 | -0.2525 |
| 730094 | MOSMO | EEC-subject4 | Human | Endometrium | EEC | 7.40e-03 | 1.90e-01 | -0.2571 |
| 730094 | MOSMO | EEC-subject5 | Human | Endometrium | EEC | 8.23e-05 | 1.20e-01 | -0.249 |
| 730094 | MOSMO | GSM5276934 | Human | Endometrium | EEC | 3.50e-22 | 4.12e-01 | -0.0913 |
| 730094 | MOSMO | GSM5276935 | Human | Endometrium | EEC | 4.06e-07 | 1.35e-01 | -0.123 |
| 730094 | MOSMO | GSM5276937 | Human | Endometrium | EEC | 3.31e-45 | 7.37e-01 | -0.0897 |
| 730094 | MOSMO | GSM5252130_BPH340PrGF_Via | Human | Prostate | BPH | 1.02e-10 | 4.71e-01 | -0.1972 |
| 730094 | MOSMO | GSM5252131_BPH340PrSF_Via | Human | Prostate | BPH | 7.80e-15 | 5.36e-01 | -0.2126 |
| 730094 | MOSMO | GSM5252132_BPH389PrGF | Human | Prostate | BPH | 4.98e-12 | 8.69e-01 | -0.2247 |
| 730094 | MOSMO | GSM5252133_BPH389PrSF | Human | Prostate | BPH | 2.24e-04 | 5.96e-01 | -0.2027 |
| 730094 | MOSMO | GSM5252134_BPH511PrG_Fcol_3GEX | Human | Prostate | BPH | 1.61e-10 | 5.06e-01 | -0.1433 |
| 730094 | MOSMO | GSM5252135_BPH511PrPUr_Fcol_3GEX | Human | Prostate | BPH | 9.20e-21 | 7.09e-01 | -0.1833 |
| 730094 | MOSMO | GSM5252136_BPH556PrGA1_Fcol | Human | Prostate | BPH | 1.84e-07 | 4.20e-01 | -0.23 |
| Page: 1 2 3 |
| Tissue | Expression Dynamics | Abbreviation |
| Endometrium | 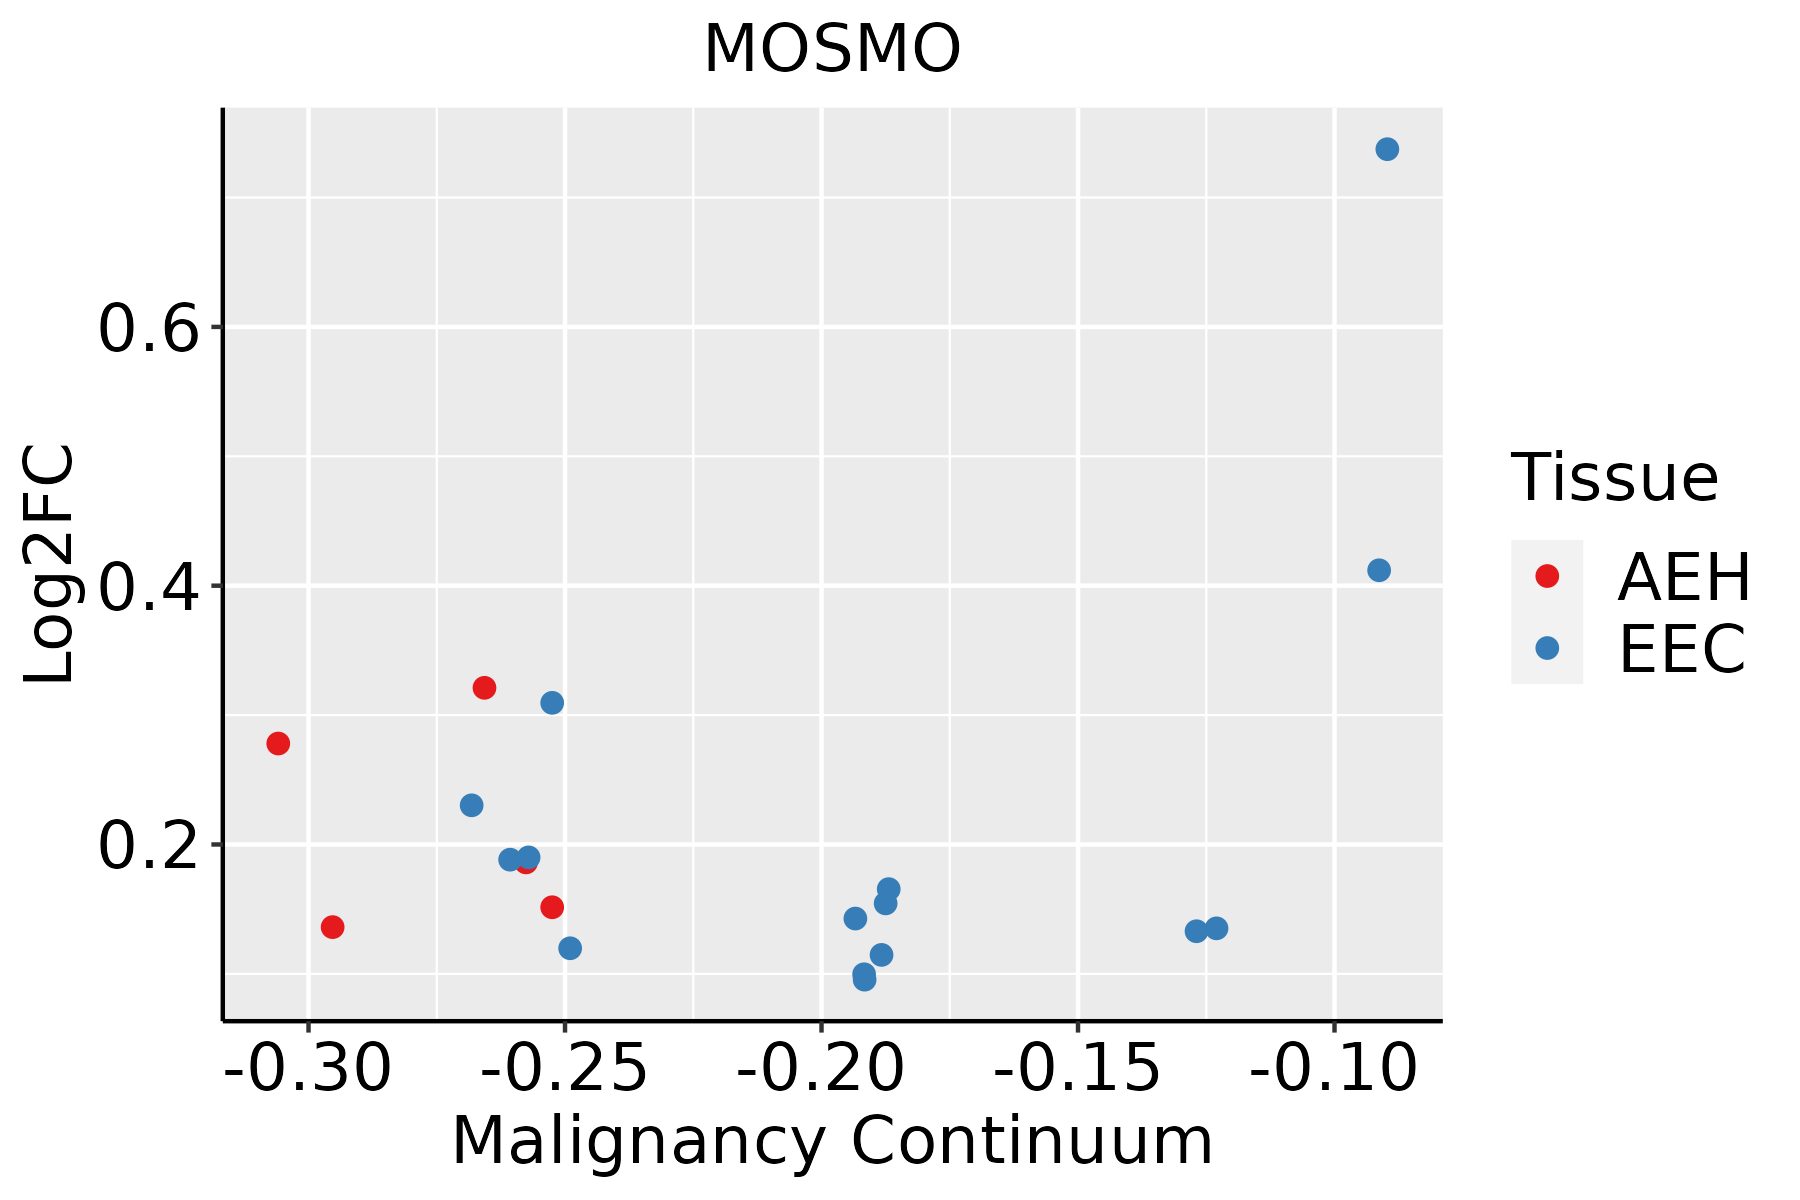 | AEH: Atypical endometrial hyperplasia |
| EEC: Endometrioid Cancer | ||
| Prostate | 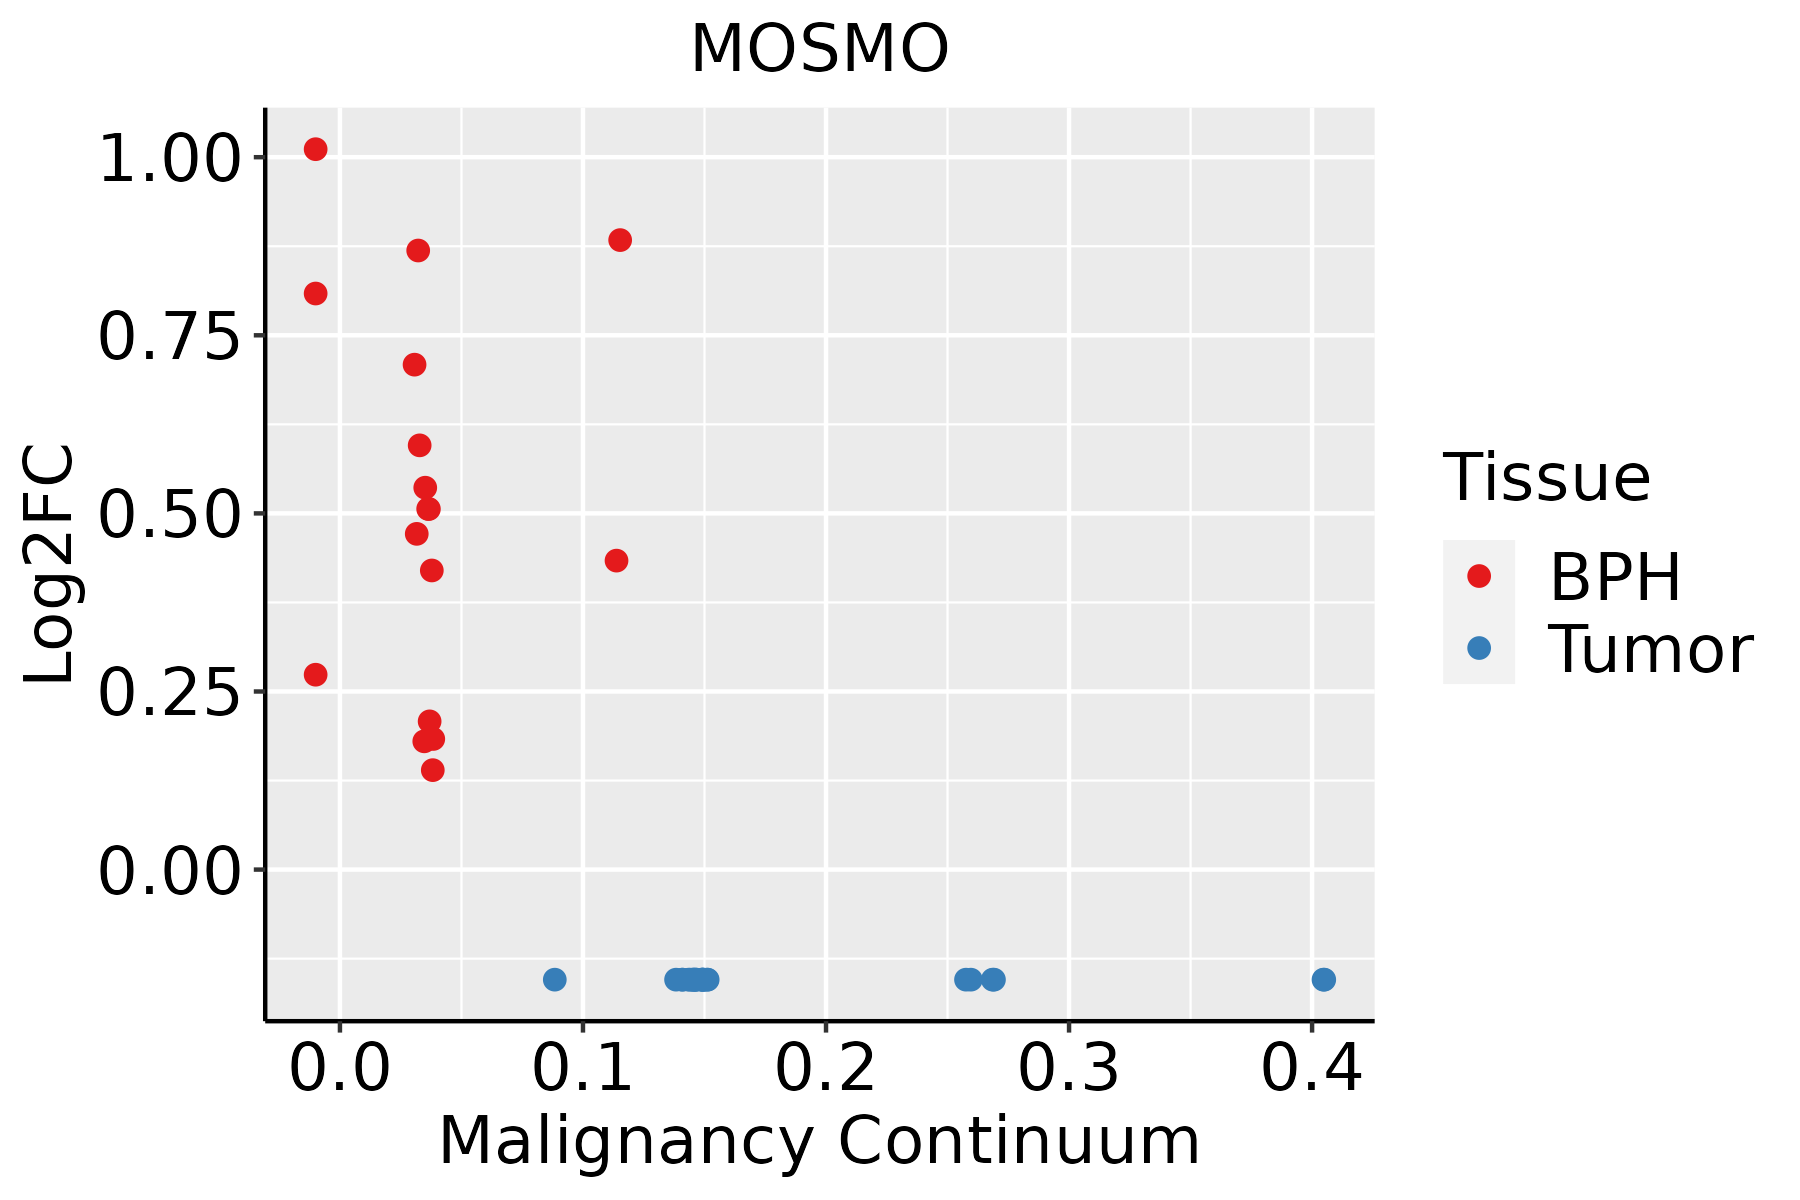 | BPH: Benign Prostatic Hyperplasia |
| Thyroid |  | ATC: Anaplastic thyroid cancer |
| HT: Hashimoto's thyroiditis | ||
| PTC: Papillary thyroid cancer |
| ∗log2FC in expression of this searched gene in stem-like cells from each diseased tissue sample relative to stem-like cells in normal samples in each tissue plotted against the malignancy continuum. Samples are colored based on if they are from different disease stage. |
Top |
Malignant transformation related pathway analysis |
| Find out the enriched GO biological processes and KEGG pathways involved in transition from healthy to precancer to cancer |
| Tissue | Disease Stage | Enriched GO biological Processes |
| Colorectum | AD |  |
| Colorectum | SER |  |
| Colorectum | MSS |  |
| Colorectum | MSI-H |  |
| Colorectum | FAP |  |
| ∗Top 15 enriched GO BP terms are showed in the bar plot of each disease state in each tissue. Each row represents a significant GO biological process which is colored according to the -log10(p.adjust). |
| Page: 1 2 3 4 5 6 7 8 9 |
| GO ID | Tissue | Disease Stage | Description | Gene Ratio | Bg Ratio | pvalue | p.adjust | Count |
| GO:003164716 | Endometrium | AEH | regulation of protein stability | 77/2100 | 298/18723 | 1.13e-12 | 2.26e-10 | 77 |
| GO:003164717 | Endometrium | EEC | regulation of protein stability | 80/2168 | 298/18723 | 2.48e-13 | 5.96e-11 | 80 |
| GO:003164718 | Prostate | BPH | regulation of protein stability | 111/3107 | 298/18723 | 4.58e-18 | 1.42e-15 | 111 |
| GO:0045664 | Prostate | BPH | regulation of neuron differentiation | 46/3107 | 196/18723 | 7.95e-03 | 3.47e-02 | 46 |
| GO:003164719 | Prostate | Tumor | regulation of protein stability | 112/3246 | 298/18723 | 4.18e-17 | 1.18e-14 | 112 |
| GO:00456641 | Prostate | Tumor | regulation of neuron differentiation | 52/3246 | 196/18723 | 7.90e-04 | 5.38e-03 | 52 |
| GO:0031647113 | Thyroid | PTC | regulation of protein stability | 174/5968 | 298/18723 | 2.05e-21 | 4.05e-19 | 174 |
| GO:0045879 | Thyroid | PTC | negative regulation of smoothened signaling pathway | 17/5968 | 32/18723 | 1.02e-02 | 4.11e-02 | 17 |
| GO:003164734 | Thyroid | ATC | regulation of protein stability | 177/6293 | 298/18723 | 4.08e-20 | 6.46e-18 | 177 |
| GO:00458791 | Thyroid | ATC | negative regulation of smoothened signaling pathway | 20/6293 | 32/18723 | 7.67e-04 | 4.24e-03 | 20 |
| GO:0008589 | Thyroid | ATC | regulation of smoothened signaling pathway | 40/6293 | 81/18723 | 2.36e-03 | 1.10e-02 | 40 |
| GO:0007224 | Thyroid | ATC | smoothened signaling pathway | 60/6293 | 138/18723 | 9.75e-03 | 3.57e-02 | 60 |
| Page: 1 |
| Pathway ID | Tissue | Disease Stage | Description | Gene Ratio | Bg Ratio | pvalue | p.adjust | qvalue | Count |
| Page: 1 |
Top |
Cell-cell communication analysis |
| Identification of potential cell-cell interactions between two cell types and their ligand-receptor pairs for different disease states |
| Ligand | Receptor | LRpair | Pathway | Tissue | Disease Stage |
| Page: 1 |
Top |
Single-cell gene regulatory network inference analysis |
| Find out the significant the regulons (TFs) and the target genes of each regulon across cell types for different disease states |
| TF | Cell Type | Tissue | Disease Stage | Target Gene | RSS | Regulon Activity |
| ∗The dot plots of a searched regulon are shown for all cell subpopulations in each disease state of each tissue based on the regulon specific score inferred using pySCENIC and by calculating the average expression. |
| Page: 1 |
Top |
Somatic mutation of malignant transformation related genes |
| Annotation of somatic variants for genes involved in malignant transformation |
| Hugo Symbol | Variant Class | Variant Classification | dbSNP RS | HGVSc | HGVSp | HGVSp Short | SWISSPROT | BIOTYPE | SIFT | PolyPhen | Tumor Sample Barcode | Tissue | Histology | Sex | Age | Stage | Therapy Types | Drugs | Outcome |
| Page: 1 |
Top |
Related drugs of malignant transformation related genes |
| Identification of chemicals and drugs interact with genes involved in malignant transfromation |
| (DGIdb 4.0) |
| Entrez ID | Symbol | Category | Interaction Types | Drug Claim Name | Drug Name | PMIDs |
| Page: 1 |

Copyright 2023-Present -The University of Texas Health Science Center at Houston |