
|
|||||
|
 | |
| |
| |
| |
| |
| |
|
Gene: MORF4L2 |
Gene summary for MORF4L2 |
| Gene information | Species | Human | Gene symbol | MORF4L2 | Gene ID | 9643 |
| Gene name | mortality factor 4 like 2 | |
| Gene Alias | MORFL2 | |
| Cytomap | Xq22.2 | |
| Gene Type | protein-coding | GO ID | GO:0006139 | UniProtAcc | Q15014 |
Top |
Malignant transformation analysis |
| Identification of the aberrant gene expression in precancerous and cancerous lesions by comparing the gene expression of stem-like cells in diseased tissues with normal stem cells |
| Entrez ID | Symbol | Replicates | Species | Organ | Tissue | Adj P-value | Log2FC | Malignancy |
| 9643 | MORF4L2 | CA_HPV_1 | Human | Cervix | CC | 3.38e-02 | -7.95e-02 | 0.0264 |
| 9643 | MORF4L2 | CA_HPV_3 | Human | Cervix | CC | 9.47e-04 | 1.03e-01 | 0.0414 |
| 9643 | MORF4L2 | Tumor | Human | Cervix | CC | 4.61e-14 | 5.23e-01 | 0.1241 |
| 9643 | MORF4L2 | sample3 | Human | Cervix | CC | 2.29e-31 | 5.97e-01 | 0.1387 |
| 9643 | MORF4L2 | T3 | Human | Cervix | CC | 4.29e-31 | 6.09e-01 | 0.1389 |
| 9643 | MORF4L2 | HTA11_78_2000001011 | Human | Colorectum | AD | 1.14e-02 | 3.08e-01 | -0.1088 |
| 9643 | MORF4L2 | HTA11_347_2000001011 | Human | Colorectum | AD | 2.14e-02 | 2.39e-01 | -0.1954 |
| 9643 | MORF4L2 | HTA11_99999970781_79442 | Human | Colorectum | MSS | 3.13e-14 | 7.38e-01 | 0.294 |
| 9643 | MORF4L2 | HTA11_99999965062_69753 | Human | Colorectum | MSI-H | 2.78e-03 | 9.62e-01 | 0.3487 |
| 9643 | MORF4L2 | HTA11_99999965104_69814 | Human | Colorectum | MSS | 1.50e-09 | 6.08e-01 | 0.281 |
| 9643 | MORF4L2 | A015-C-203 | Human | Colorectum | FAP | 1.14e-10 | -2.16e-01 | -0.1294 |
| 9643 | MORF4L2 | A002-C-203 | Human | Colorectum | FAP | 7.33e-04 | -1.58e-01 | 0.2786 |
| 9643 | MORF4L2 | A001-C-108 | Human | Colorectum | FAP | 1.78e-04 | -1.72e-01 | -0.0272 |
| 9643 | MORF4L2 | A002-C-205 | Human | Colorectum | FAP | 5.43e-05 | -1.71e-01 | -0.1236 |
| 9643 | MORF4L2 | A015-C-006 | Human | Colorectum | FAP | 2.68e-02 | -1.39e-01 | -0.0994 |
| 9643 | MORF4L2 | A015-C-106 | Human | Colorectum | FAP | 3.66e-05 | -1.84e-01 | -0.0511 |
| 9643 | MORF4L2 | A002-C-114 | Human | Colorectum | FAP | 4.01e-03 | -2.00e-01 | -0.1561 |
| 9643 | MORF4L2 | A015-C-104 | Human | Colorectum | FAP | 9.86e-09 | -1.81e-01 | -0.1899 |
| 9643 | MORF4L2 | A001-C-014 | Human | Colorectum | FAP | 1.95e-04 | -2.03e-01 | 0.0135 |
| 9643 | MORF4L2 | A002-C-016 | Human | Colorectum | FAP | 8.36e-07 | -2.26e-01 | 0.0521 |
| Page: 1 2 3 4 5 6 7 8 9 10 11 12 13 |
| Tissue | Expression Dynamics | Abbreviation |
| Cervix | 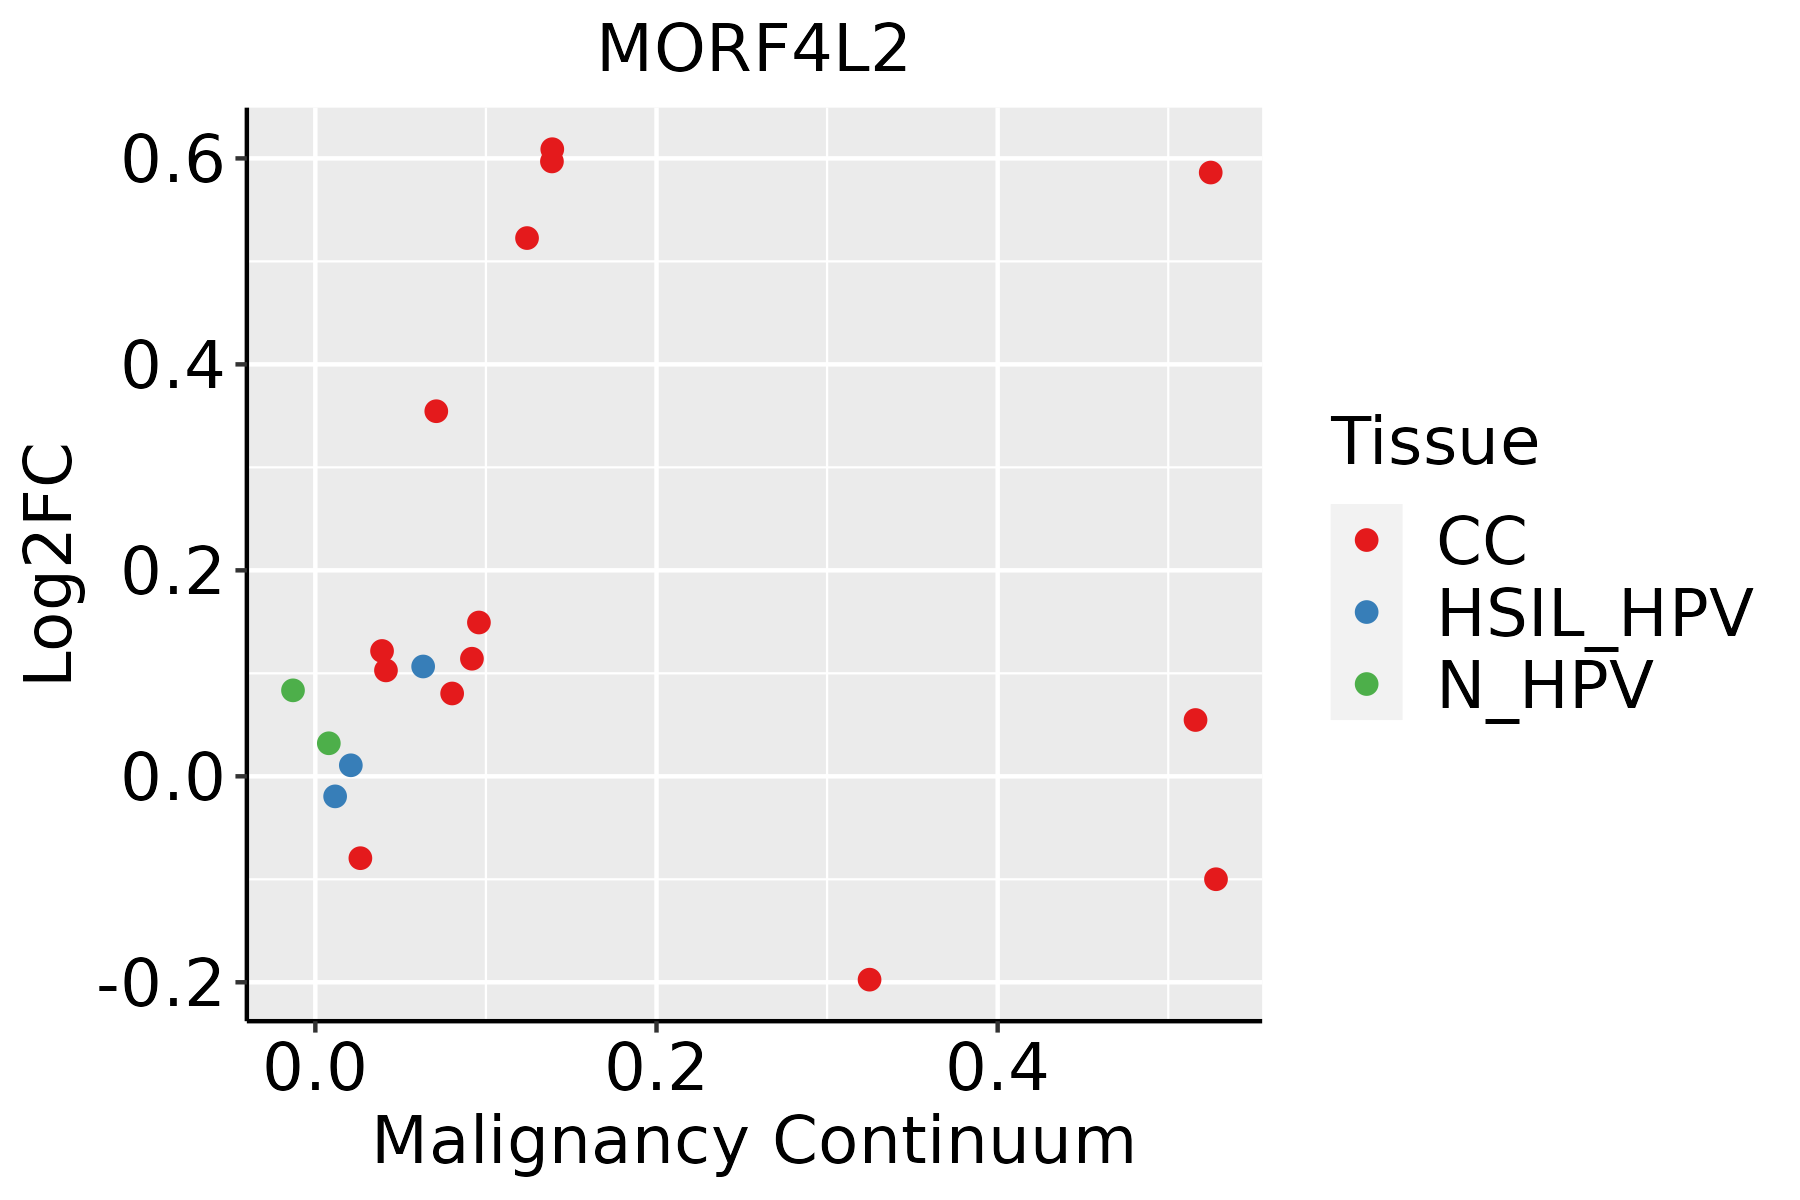 | CC: Cervix cancer |
| HSIL_HPV: HPV-infected high-grade squamous intraepithelial lesions | ||
| N_HPV: HPV-infected normal cervix | ||
| Colorectum (GSE201348) |  | FAP: Familial adenomatous polyposis |
| CRC: Colorectal cancer | ||
| Colorectum (HTA11) |  | AD: Adenomas |
| SER: Sessile serrated lesions | ||
| MSI-H: Microsatellite-high colorectal cancer | ||
| MSS: Microsatellite stable colorectal cancer | ||
| Endometrium |  | AEH: Atypical endometrial hyperplasia |
| EEC: Endometrioid Cancer | ||
| Esophagus | 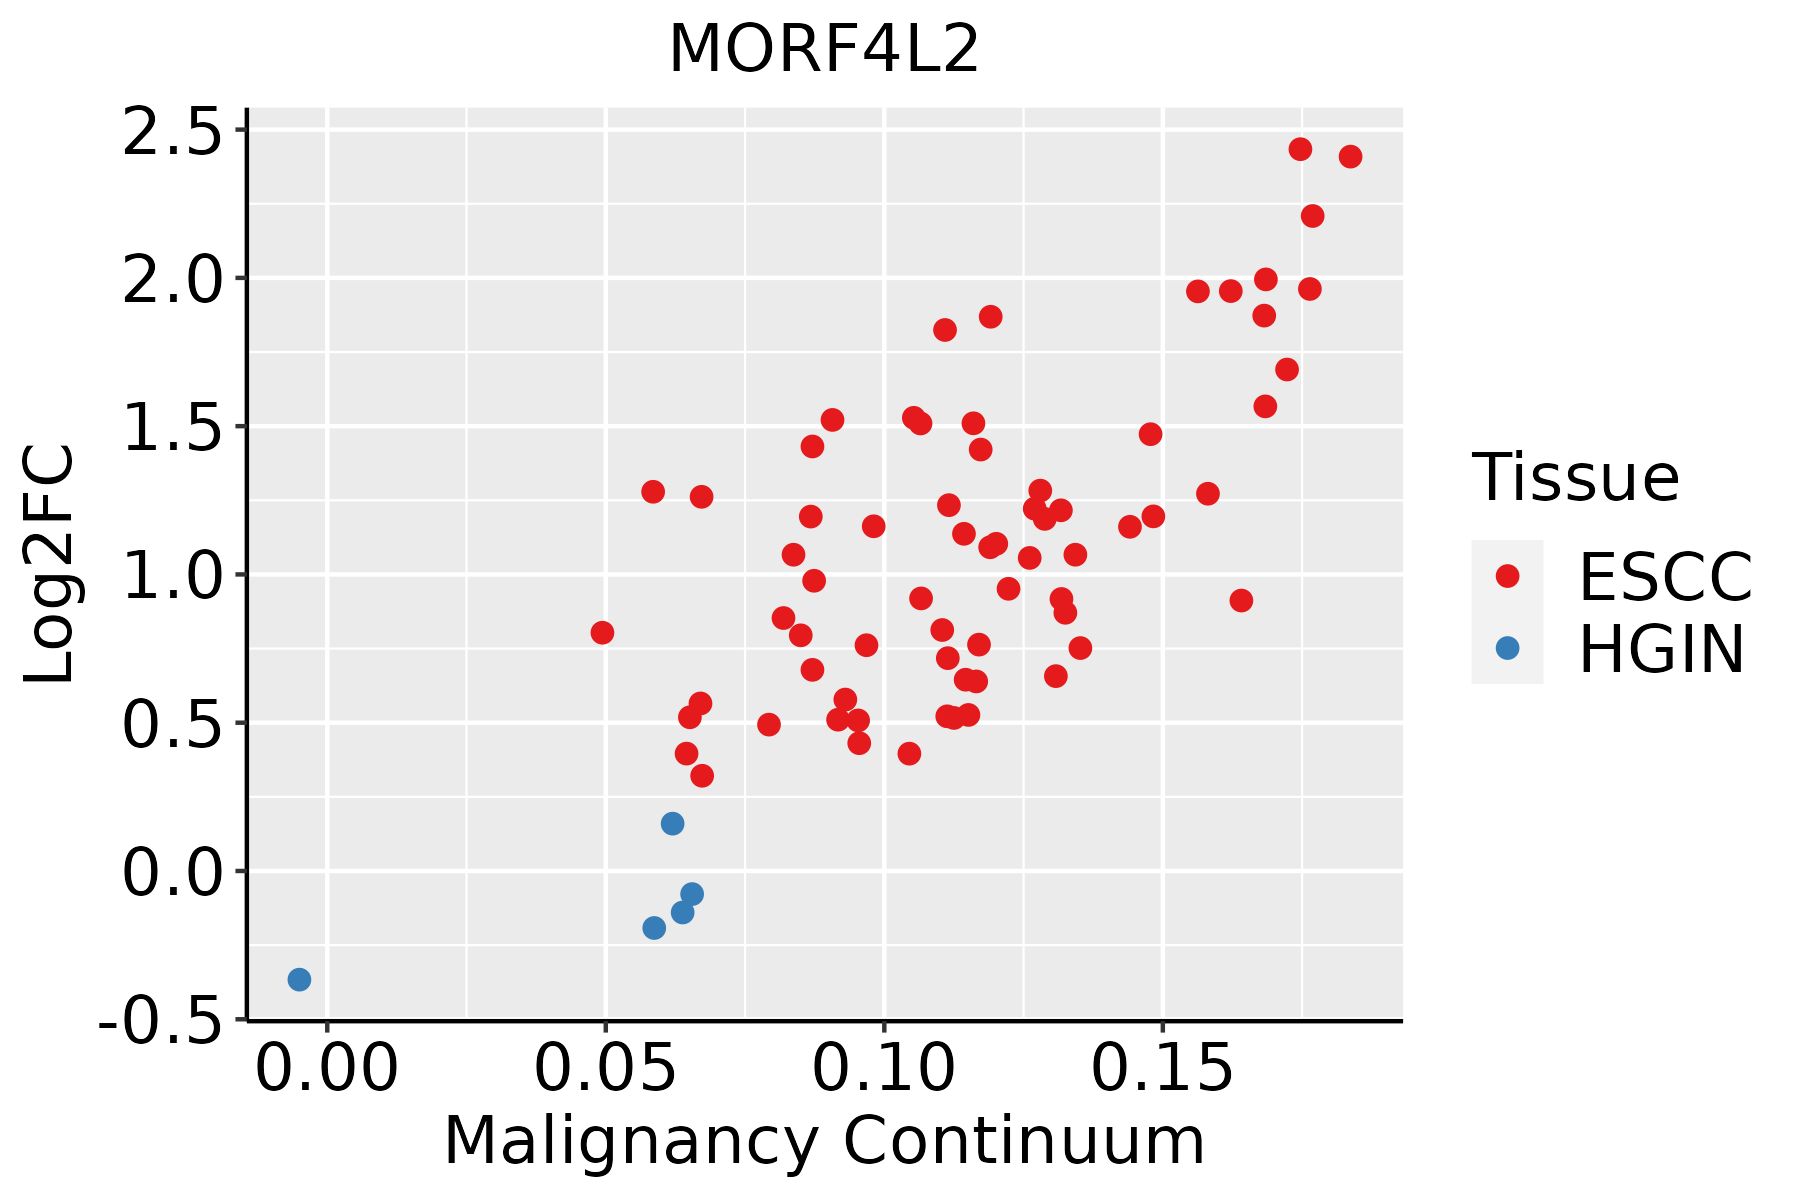 | ESCC: Esophageal squamous cell carcinoma |
| HGIN: High-grade intraepithelial neoplasias | ||
| LGIN: Low-grade intraepithelial neoplasias | ||
| GC |  | CAG: Chronic atrophic gastritis |
| CAG with IM: Chronic atrophic gastritis with intestinal metaplasia | ||
| CSG: Chronic superficial gastritis | ||
| GC: Gastric cancer | ||
| SIM: Severe intestinal metaplasia | ||
| WIM: Wild intestinal metaplasia | ||
| Liver |  | HCC: Hepatocellular carcinoma |
| NAFLD: Non-alcoholic fatty liver disease | ||
| Lung | 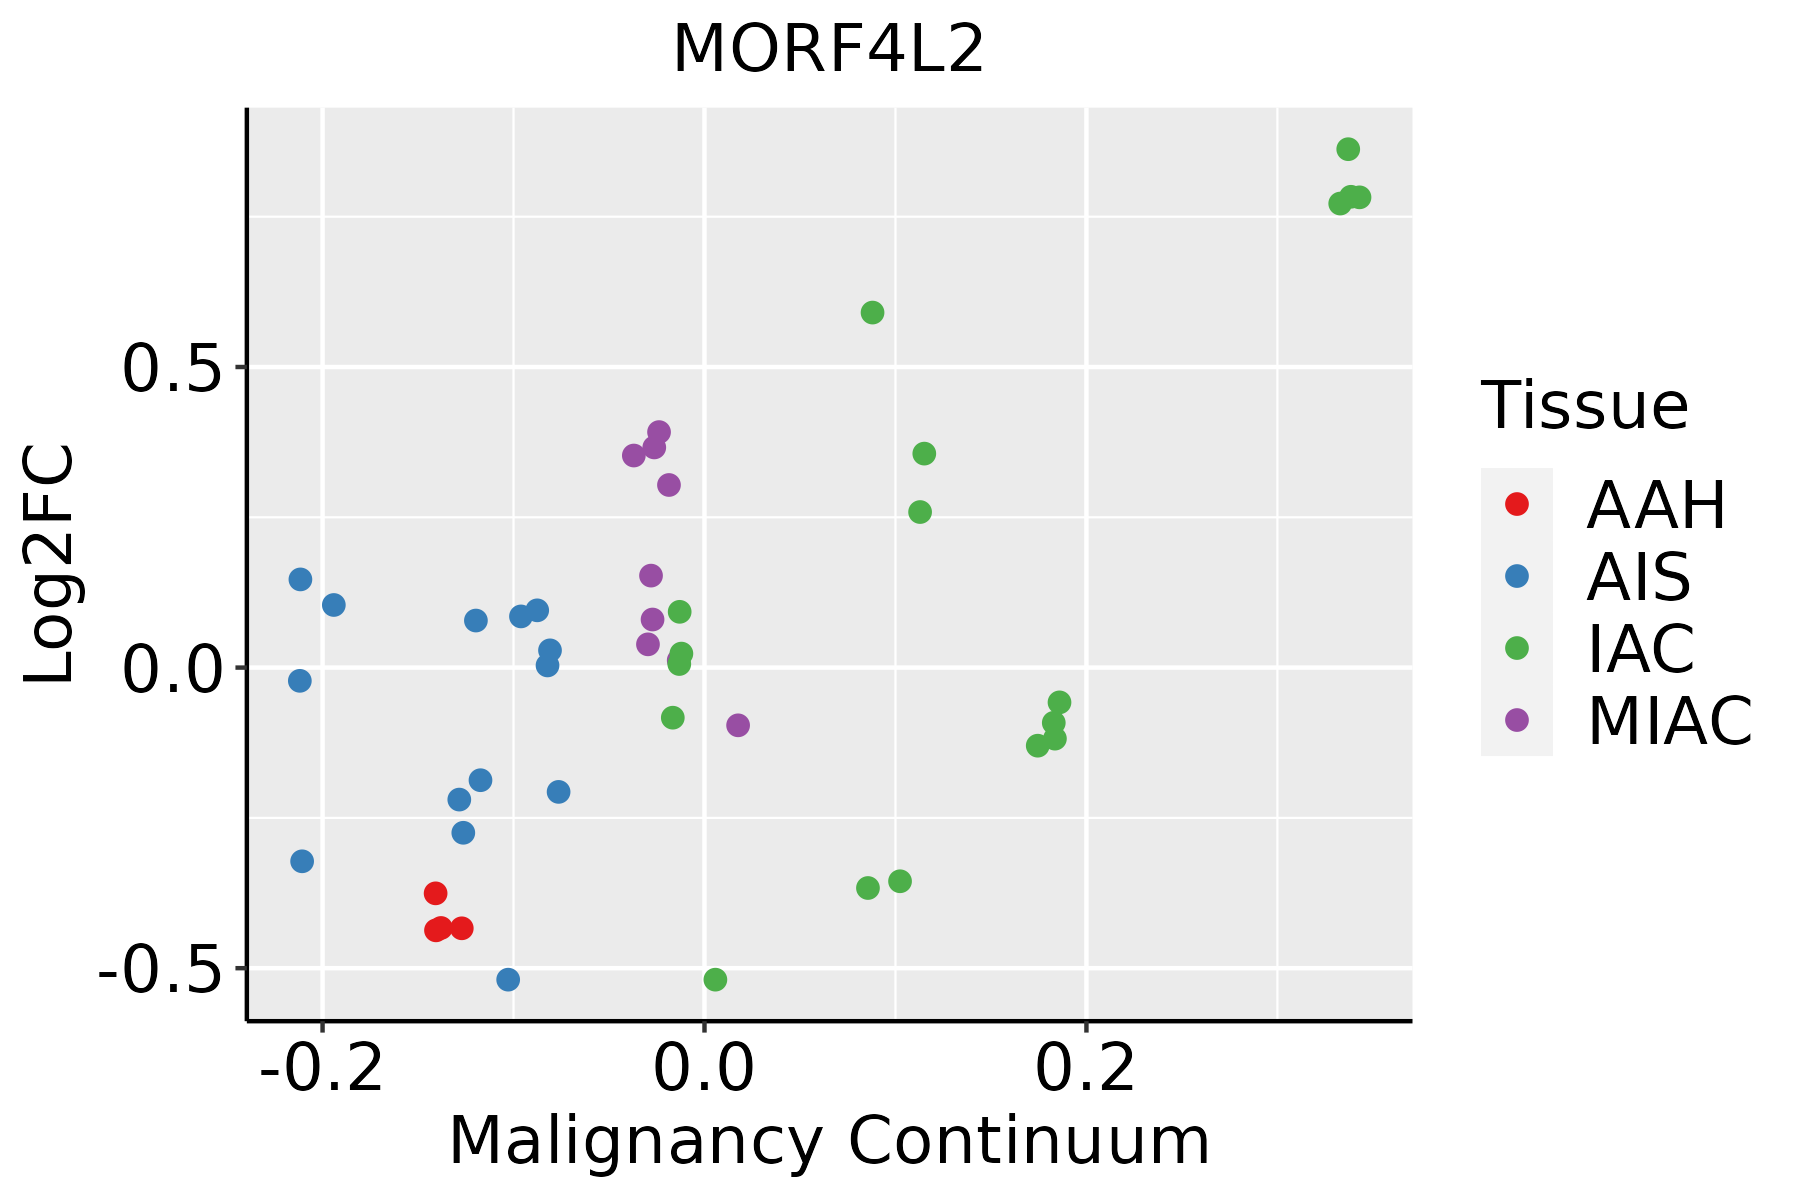 | AAH: Atypical adenomatous hyperplasia |
| AIS: Adenocarcinoma in situ | ||
| IAC: Invasive lung adenocarcinoma | ||
| MIA: Minimally invasive adenocarcinoma | ||
| Oral Cavity | 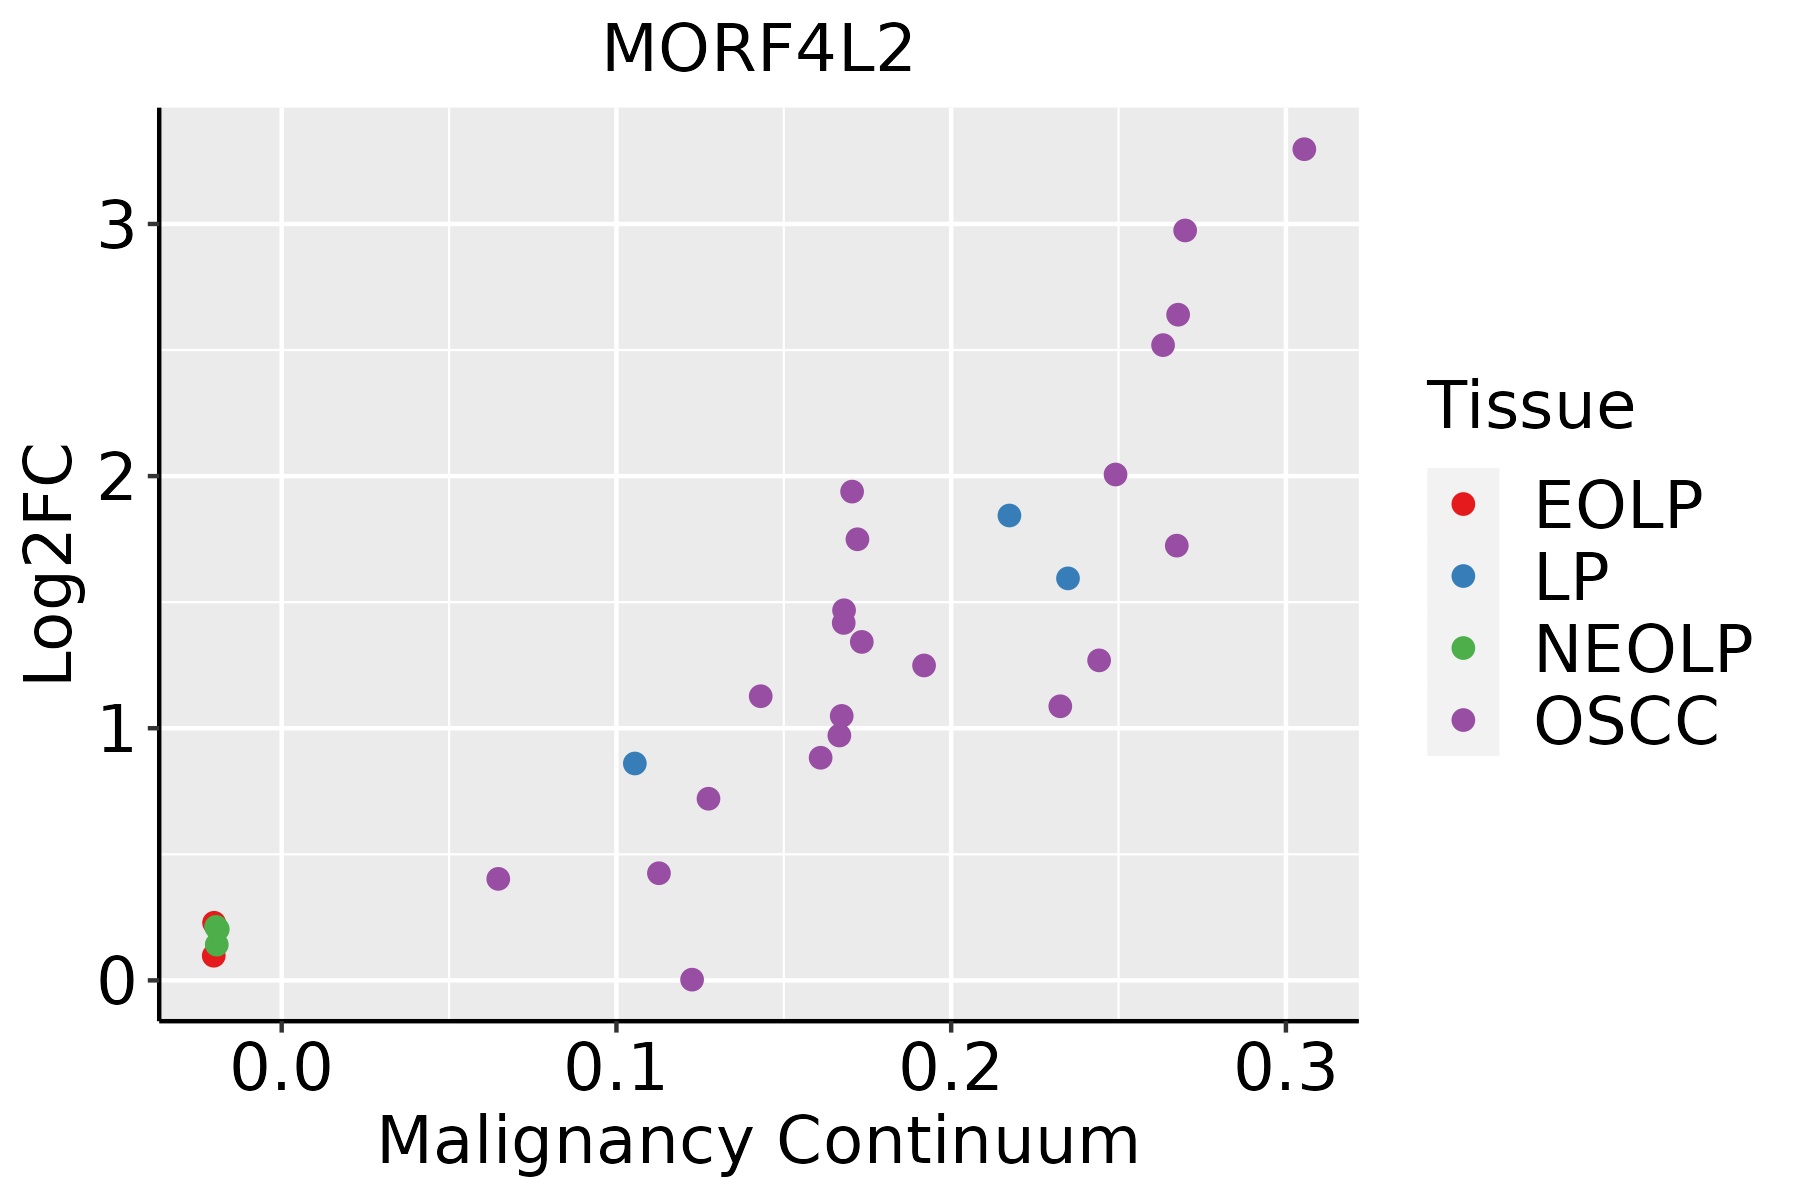 | EOLP: Erosive Oral lichen planus |
| LP: leukoplakia | ||
| NEOLP: Non-erosive oral lichen planus | ||
| OSCC: Oral squamous cell carcinoma | ||
| Prostate | 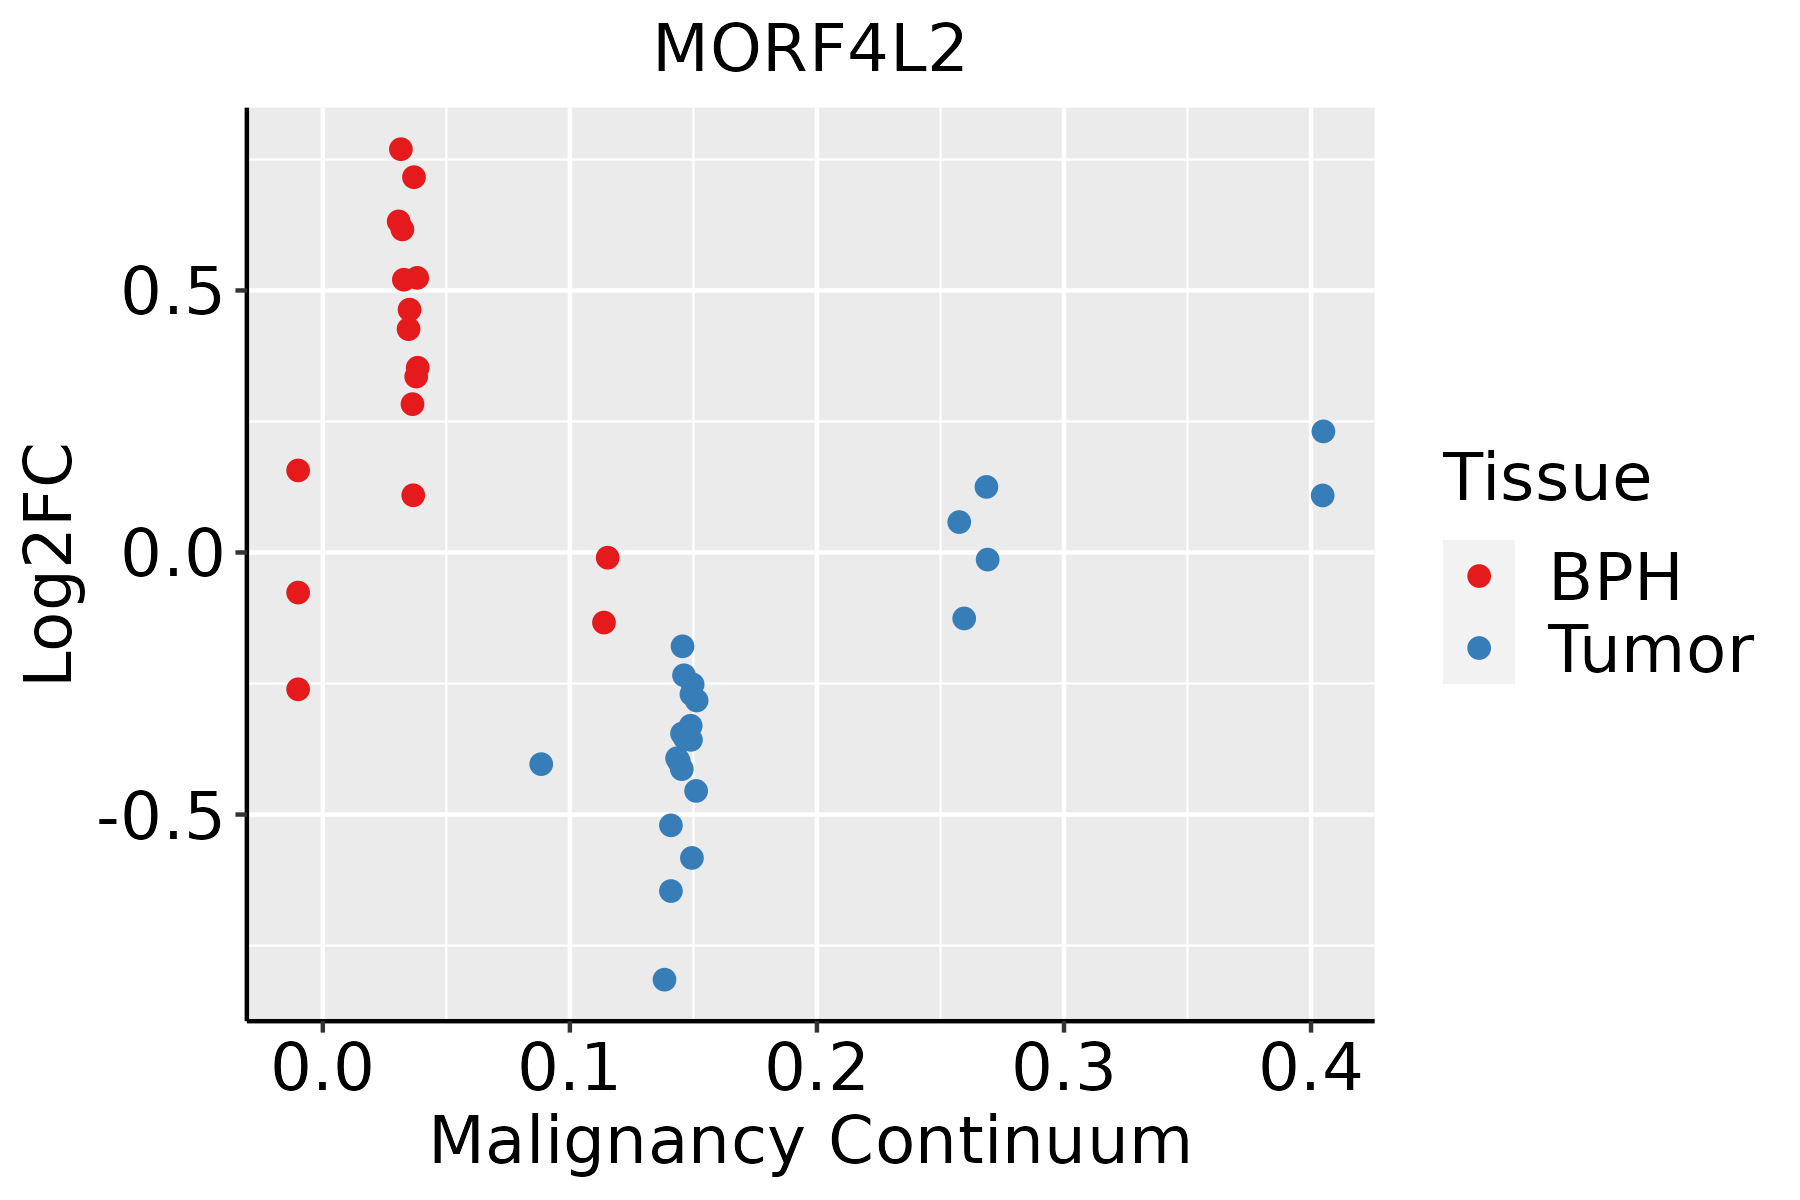 | BPH: Benign Prostatic Hyperplasia |
| Skin | 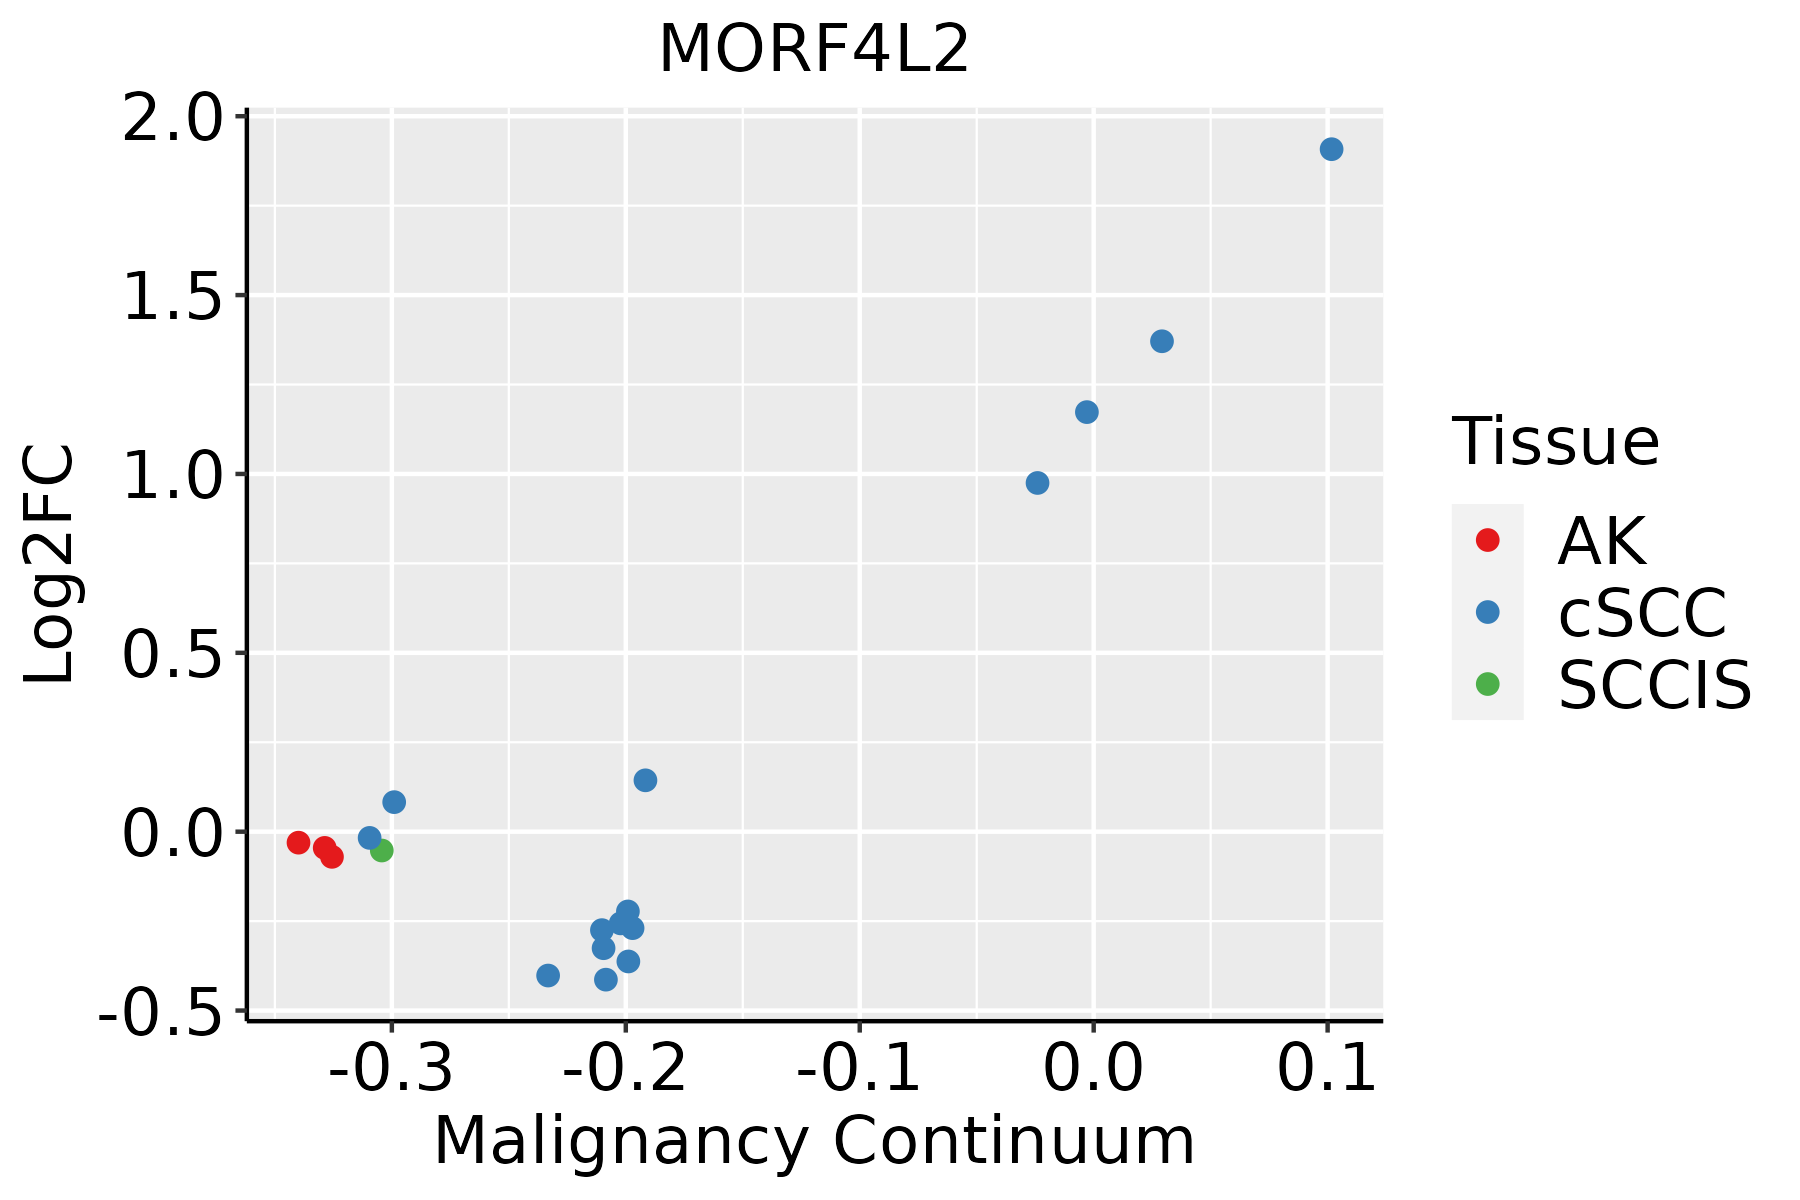 | AK: Actinic keratosis |
| cSCC: Cutaneous squamous cell carcinoma | ||
| SCCIS:squamous cell carcinoma in situ | ||
| Thyroid |  | ATC: Anaplastic thyroid cancer |
| HT: Hashimoto's thyroiditis | ||
| PTC: Papillary thyroid cancer |
| ∗log2FC in expression of this searched gene in stem-like cells from each diseased tissue sample relative to stem-like cells in normal samples in each tissue plotted against the malignancy continuum. Samples are colored based on if they are from different disease stage. |
Top |
Malignant transformation related pathway analysis |
| Find out the enriched GO biological processes and KEGG pathways involved in transition from healthy to precancer to cancer |
| Tissue | Disease Stage | Enriched GO biological Processes |
| Colorectum | AD |  |
| Colorectum | SER |  |
| Colorectum | MSS |  |
| Colorectum | MSI-H |  |
| Colorectum | FAP |  |
| ∗Top 15 enriched GO BP terms are showed in the bar plot of each disease state in each tissue. Each row represents a significant GO biological process which is colored according to the -log10(p.adjust). |
| Page: 1 2 3 4 5 6 7 8 9 |
| GO ID | Tissue | Disease Stage | Description | Gene Ratio | Bg Ratio | pvalue | p.adjust | Count |
| GO:00165705 | Cervix | CC | histone modification | 84/2311 | 463/18723 | 1.70e-04 | 2.01e-03 | 84 |
| GO:00426924 | Cervix | CC | muscle cell differentiation | 69/2311 | 384/18723 | 8.12e-04 | 7.09e-03 | 69 |
| GO:00511464 | Cervix | CC | striated muscle cell differentiation | 50/2311 | 283/18723 | 5.53e-03 | 3.19e-02 | 50 |
| GO:00182054 | Cervix | CC | peptidyl-lysine modification | 62/2311 | 376/18723 | 1.04e-02 | 4.97e-02 | 62 |
| GO:0016570 | Colorectum | MSS | histone modification | 113/3467 | 463/18723 | 8.37e-04 | 8.68e-03 | 113 |
| GO:00165701 | Colorectum | FAP | histone modification | 94/2622 | 463/18723 | 1.06e-04 | 1.76e-03 | 94 |
| GO:00426925 | Endometrium | AEH | muscle cell differentiation | 68/2100 | 384/18723 | 8.88e-05 | 1.30e-03 | 68 |
| GO:00511465 | Endometrium | AEH | striated muscle cell differentiation | 51/2100 | 283/18723 | 4.20e-04 | 4.46e-03 | 51 |
| GO:004269212 | Endometrium | EEC | muscle cell differentiation | 67/2168 | 384/18723 | 3.87e-04 | 4.12e-03 | 67 |
| GO:005114613 | Endometrium | EEC | striated muscle cell differentiation | 51/2168 | 283/18723 | 8.71e-04 | 7.97e-03 | 51 |
| GO:001657015 | Esophagus | ESCC | histone modification | 323/8552 | 463/18723 | 2.61e-26 | 7.88e-24 | 323 |
| GO:001820514 | Esophagus | ESCC | peptidyl-lysine modification | 259/8552 | 376/18723 | 3.90e-20 | 5.26e-18 | 259 |
| GO:001839413 | Esophagus | ESCC | peptidyl-lysine acetylation | 123/8552 | 169/18723 | 6.58e-13 | 2.94e-11 | 123 |
| GO:004354313 | Esophagus | ESCC | protein acylation | 165/8552 | 243/18723 | 1.69e-12 | 7.14e-11 | 165 |
| GO:000647313 | Esophagus | ESCC | protein acetylation | 140/8552 | 201/18723 | 4.37e-12 | 1.69e-10 | 140 |
| GO:001839313 | Esophagus | ESCC | internal peptidyl-lysine acetylation | 114/8552 | 158/18723 | 1.16e-11 | 4.24e-10 | 114 |
| GO:000647513 | Esophagus | ESCC | internal protein amino acid acetylation | 115/8552 | 160/18723 | 1.43e-11 | 5.08e-10 | 115 |
| GO:00165735 | Esophagus | ESCC | histone acetylation | 110/8552 | 152/18723 | 1.95e-11 | 6.81e-10 | 110 |
| GO:004396712 | Esophagus | ESCC | histone H4 acetylation | 53/8552 | 67/18723 | 2.11e-08 | 4.03e-07 | 53 |
| GO:00356015 | Esophagus | ESCC | protein deacylation | 79/8552 | 112/18723 | 8.30e-08 | 1.42e-06 | 79 |
| Page: 1 2 3 4 5 6 7 8 9 10 11 |
| Pathway ID | Tissue | Disease Stage | Description | Gene Ratio | Bg Ratio | pvalue | p.adjust | qvalue | Count |
| Page: 1 |
Top |
Cell-cell communication analysis |
| Identification of potential cell-cell interactions between two cell types and their ligand-receptor pairs for different disease states |
| Ligand | Receptor | LRpair | Pathway | Tissue | Disease Stage |
| Page: 1 |
Top |
Single-cell gene regulatory network inference analysis |
| Find out the significant the regulons (TFs) and the target genes of each regulon across cell types for different disease states |
| TF | Cell Type | Tissue | Disease Stage | Target Gene | RSS | Regulon Activity |
| ∗The dot plots of a searched regulon are shown for all cell subpopulations in each disease state of each tissue based on the regulon specific score inferred using pySCENIC and by calculating the average expression. |
| Page: 1 |
Top |
Somatic mutation of malignant transformation related genes |
| Annotation of somatic variants for genes involved in malignant transformation |
| Hugo Symbol | Variant Class | Variant Classification | dbSNP RS | HGVSc | HGVSp | HGVSp Short | SWISSPROT | BIOTYPE | SIFT | PolyPhen | Tumor Sample Barcode | Tissue | Histology | Sex | Age | Stage | Therapy Types | Drugs | Outcome |
| MORF4L2 | SNV | Missense_Mutation | c.680A>C | p.His227Pro | p.H227P | Q15014 | protein_coding | deleterious(0) | probably_damaging(0.999) | TCGA-GM-A2DL-01 | Breast | breast invasive carcinoma | Female | <65 | I/II | Hormone Therapy | tamoxiphen | CR | |
| MORF4L2 | insertion | Frame_Shift_Ins | novel | c.295_296insTAGATAACCTC | p.Arg99LeufsTer29 | p.R99Lfs*29 | Q15014 | protein_coding | TCGA-VS-A9UP-01 | Cervix | cervical & endocervical cancer | Female | <65 | I/II | Chemotherapy | cisplatin | PD | ||
| MORF4L2 | SNV | Missense_Mutation | c.827N>G | p.Tyr276Cys | p.Y276C | Q15014 | protein_coding | deleterious(0) | probably_damaging(1) | TCGA-AA-3715-01 | Colorectum | colon adenocarcinoma | Male | >=65 | I/II | Unknown | Unknown | PD | |
| MORF4L2 | SNV | Missense_Mutation | c.469N>A | p.Ala157Thr | p.A157T | Q15014 | protein_coding | tolerated(0.11) | benign(0.009) | TCGA-CK-4951-01 | Colorectum | colon adenocarcinoma | Female | >=65 | I/II | Unknown | Unknown | PD | |
| MORF4L2 | SNV | Missense_Mutation | c.577N>G | p.Met193Val | p.M193V | Q15014 | protein_coding | tolerated(0.08) | benign(0.353) | TCGA-CK-6746-01 | Colorectum | colon adenocarcinoma | Female | >=65 | I/II | Unknown | Unknown | SD | |
| MORF4L2 | SNV | Missense_Mutation | c.854N>A | p.Arg285His | p.R285H | Q15014 | protein_coding | tolerated(0.07) | benign(0.003) | TCGA-AJ-A3EL-01 | Endometrium | uterine corpus endometrioid carcinoma | Female | <65 | I/II | Unknown | Unknown | SD | |
| MORF4L2 | SNV | Missense_Mutation | c.842C>A | p.Ala281Asp | p.A281D | Q15014 | protein_coding | deleterious(0) | benign(0.317) | TCGA-AP-A051-01 | Endometrium | uterine corpus endometrioid carcinoma | Female | >=65 | I/II | Unknown | Unknown | SD | |
| MORF4L2 | SNV | Missense_Mutation | rs200858326 | c.503N>T | p.Ser168Leu | p.S168L | Q15014 | protein_coding | tolerated(0.23) | benign(0.17) | TCGA-AP-A0LM-01 | Endometrium | uterine corpus endometrioid carcinoma | Female | <65 | III/IV | Chemotherapy | cisplatin | SD |
| MORF4L2 | SNV | Missense_Mutation | novel | c.763T>C | p.Tyr255His | p.Y255H | Q15014 | protein_coding | tolerated(0.64) | benign(0.403) | TCGA-AP-A1DK-01 | Endometrium | uterine corpus endometrioid carcinoma | Female | <65 | I/II | Unknown | Unknown | SD |
| MORF4L2 | SNV | Missense_Mutation | rs377051485 | c.533N>T | p.Ala178Val | p.A178V | Q15014 | protein_coding | tolerated(0.07) | probably_damaging(0.962) | TCGA-AX-A0J1-01 | Endometrium | uterine corpus endometrioid carcinoma | Female | >=65 | I/II | Unknown | Unknown | SD |
| Page: 1 2 3 4 |
Top |
Related drugs of malignant transformation related genes |
| Identification of chemicals and drugs interact with genes involved in malignant transfromation |
| (DGIdb 4.0) |
| Entrez ID | Symbol | Category | Interaction Types | Drug Claim Name | Drug Name | PMIDs |
| Page: 1 |

Copyright 2023-Present -The University of Texas Health Science Center at Houston |