
|
|||||
|
 | |
| |
| |
| |
| |
| |
|
Gene: MORC2 |
Gene summary for MORC2 |
| Gene information | Species | Human | Gene symbol | MORC2 | Gene ID | 22880 |
| Gene name | MORC family CW-type zinc finger 2 | |
| Gene Alias | CMT2Z | |
| Cytomap | 22q12.2 | |
| Gene Type | protein-coding | GO ID | GO:0006082 | UniProtAcc | Q9Y6X9 |
Top |
Malignant transformation analysis |
| Identification of the aberrant gene expression in precancerous and cancerous lesions by comparing the gene expression of stem-like cells in diseased tissues with normal stem cells |
| Entrez ID | Symbol | Replicates | Species | Organ | Tissue | Adj P-value | Log2FC | Malignancy |
| 22880 | MORC2 | HCC1_Meng | Human | Liver | HCC | 3.67e-28 | 8.27e-04 | 0.0246 |
| 22880 | MORC2 | HCC2_Meng | Human | Liver | HCC | 1.19e-06 | 3.09e-02 | 0.0107 |
| 22880 | MORC2 | HCC2 | Human | Liver | HCC | 2.07e-10 | 3.34e+00 | 0.5341 |
| 22880 | MORC2 | S027 | Human | Liver | HCC | 2.31e-03 | 4.43e-01 | 0.2446 |
| 22880 | MORC2 | S028 | Human | Liver | HCC | 6.79e-04 | 3.62e-01 | 0.2503 |
| 22880 | MORC2 | S029 | Human | Liver | HCC | 4.06e-08 | 5.02e-01 | 0.2581 |
| Page: 1 |
| Tissue | Expression Dynamics | Abbreviation |
| Liver | 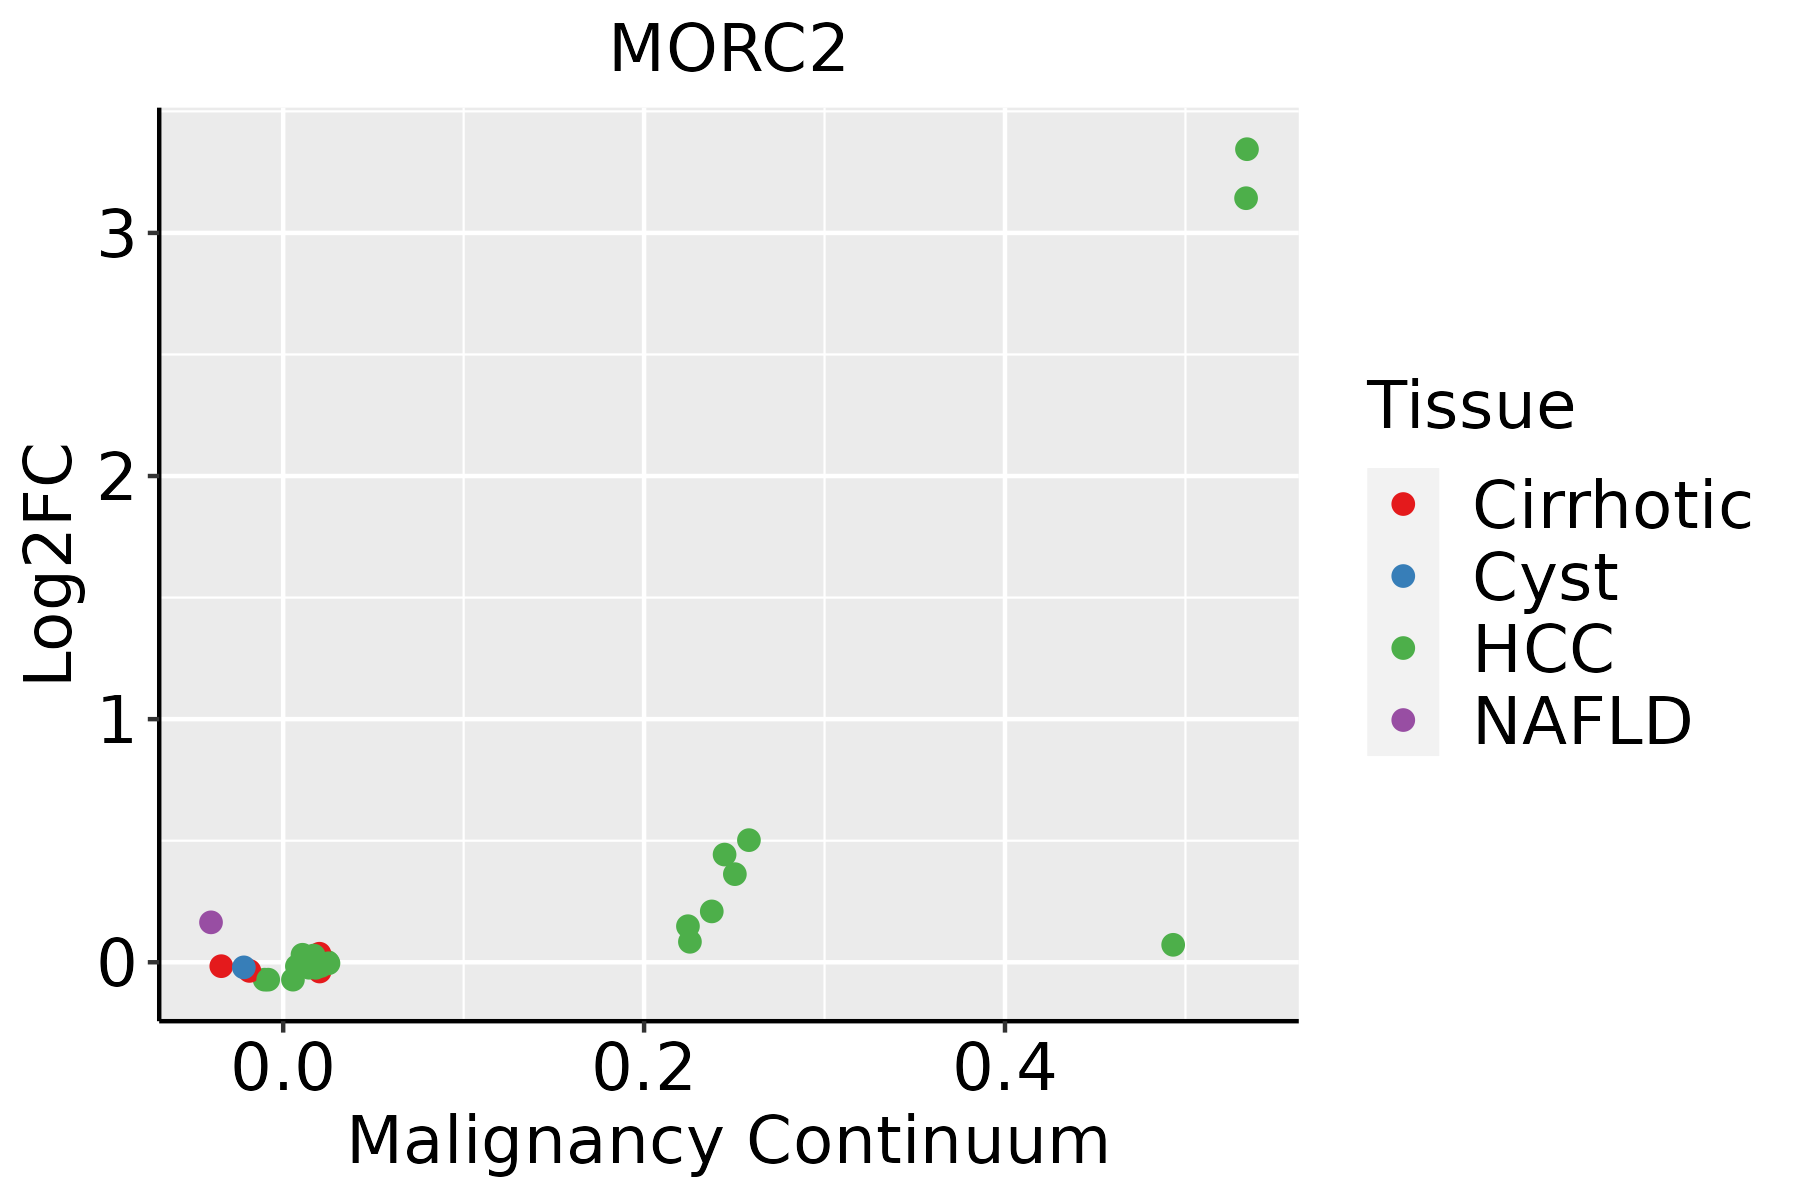 | HCC: Hepatocellular carcinoma |
| NAFLD: Non-alcoholic fatty liver disease |
| ∗log2FC in expression of this searched gene in stem-like cells from each diseased tissue sample relative to stem-like cells in normal samples in each tissue plotted against the malignancy continuum. Samples are colored based on if they are from different disease stage. |
Top |
Malignant transformation related pathway analysis |
| Find out the enriched GO biological processes and KEGG pathways involved in transition from healthy to precancer to cancer |
| Tissue | Disease Stage | Enriched GO biological Processes |
| Colorectum | AD |  |
| Colorectum | SER |  |
| Colorectum | MSS |  |
| Colorectum | MSI-H |  |
| Colorectum | FAP |  |
| ∗Top 15 enriched GO BP terms are showed in the bar plot of each disease state in each tissue. Each row represents a significant GO biological process which is colored according to the -log10(p.adjust). |
| Page: 1 2 3 4 5 6 7 8 9 |
| GO ID | Tissue | Disease Stage | Description | Gene Ratio | Bg Ratio | pvalue | p.adjust | Count |
| GO:001603222 | Liver | HCC | viral process | 286/7958 | 415/18723 | 4.41e-28 | 1.86e-25 | 286 |
| GO:001905822 | Liver | HCC | viral life cycle | 209/7958 | 317/18723 | 2.05e-17 | 2.09e-15 | 209 |
| GO:000663122 | Liver | HCC | fatty acid metabolic process | 238/7958 | 390/18723 | 8.24e-14 | 4.84e-12 | 238 |
| GO:001907922 | Liver | HCC | viral genome replication | 94/7958 | 131/18723 | 1.02e-11 | 4.18e-10 | 94 |
| GO:003304421 | Liver | HCC | regulation of chromosome organization | 125/7958 | 187/18723 | 1.35e-11 | 5.40e-10 | 125 |
| GO:005079212 | Liver | HCC | regulation of viral process | 109/7958 | 164/18723 | 4.52e-10 | 1.45e-08 | 109 |
| GO:190390012 | Liver | HCC | regulation of viral life cycle | 94/7958 | 148/18723 | 1.93e-07 | 3.49e-06 | 94 |
| GO:004506922 | Liver | HCC | regulation of viral genome replication | 59/7958 | 85/18723 | 4.66e-07 | 7.61e-06 | 59 |
| GO:200125211 | Liver | HCC | positive regulation of chromosome organization | 55/7958 | 82/18723 | 5.97e-06 | 7.35e-05 | 55 |
| GO:004852511 | Liver | HCC | negative regulation of viral process | 59/7958 | 92/18723 | 2.28e-05 | 2.41e-04 | 59 |
| GO:000632511 | Liver | HCC | chromatin organization | 206/7958 | 409/18723 | 7.23e-04 | 4.41e-03 | 206 |
| GO:0040029 | Liver | HCC | regulation of gene expression, epigenetic | 61/7958 | 105/18723 | 9.02e-04 | 5.31e-03 | 61 |
| GO:00450711 | Liver | HCC | negative regulation of viral genome replication | 35/7958 | 56/18723 | 2.00e-03 | 1.01e-02 | 35 |
| GO:0039694 | Liver | HCC | viral RNA genome replication | 22/7958 | 35/18723 | 1.21e-02 | 4.41e-02 | 22 |
| Page: 1 |
| Pathway ID | Tissue | Disease Stage | Description | Gene Ratio | Bg Ratio | pvalue | p.adjust | qvalue | Count |
| Page: 1 |
Top |
Cell-cell communication analysis |
| Identification of potential cell-cell interactions between two cell types and their ligand-receptor pairs for different disease states |
| Ligand | Receptor | LRpair | Pathway | Tissue | Disease Stage |
| Page: 1 |
Top |
Single-cell gene regulatory network inference analysis |
| Find out the significant the regulons (TFs) and the target genes of each regulon across cell types for different disease states |
| TF | Cell Type | Tissue | Disease Stage | Target Gene | RSS | Regulon Activity |
| ∗The dot plots of a searched regulon are shown for all cell subpopulations in each disease state of each tissue based on the regulon specific score inferred using pySCENIC and by calculating the average expression. |
| Page: 1 |
Top |
Somatic mutation of malignant transformation related genes |
| Annotation of somatic variants for genes involved in malignant transformation |
| Hugo Symbol | Variant Class | Variant Classification | dbSNP RS | HGVSc | HGVSp | HGVSp Short | SWISSPROT | BIOTYPE | SIFT | PolyPhen | Tumor Sample Barcode | Tissue | Histology | Sex | Age | Stage | Therapy Types | Drugs | Outcome |
| MORC2 | SNV | Missense_Mutation | c.647N>C | p.Ile216Thr | p.I216T | Q9Y6X9 | protein_coding | deleterious(0) | benign(0.058) | TCGA-A2-A1G6-01 | Breast | breast invasive carcinoma | Female | <65 | III/IV | Chemotherapy | adriamycin | SD | |
| MORC2 | SNV | Missense_Mutation | c.529N>G | p.Pro177Ala | p.P177A | Q9Y6X9 | protein_coding | deleterious(0) | probably_damaging(0.994) | TCGA-AC-A23H-01 | Breast | breast invasive carcinoma | Female | >=65 | I/II | Unknown | Unknown | PD | |
| MORC2 | SNV | Missense_Mutation | c.395G>A | p.Arg132His | p.R132H | Q9Y6X9 | protein_coding | deleterious(0.01) | probably_damaging(0.95) | TCGA-AN-A0AK-01 | Breast | breast invasive carcinoma | Female | >=65 | I/II | Unknown | Unknown | SD | |
| MORC2 | SNV | Missense_Mutation | c.830N>G | p.Tyr277Cys | p.Y277C | Q9Y6X9 | protein_coding | deleterious(0) | probably_damaging(0.997) | TCGA-B6-A0RU-01 | Breast | breast invasive carcinoma | Female | <65 | I/II | Unknown | Unknown | PD | |
| MORC2 | SNV | Missense_Mutation | c.570G>C | p.Lys190Asn | p.K190N | Q9Y6X9 | protein_coding | deleterious(0.03) | probably_damaging(0.994) | TCGA-D8-A147-01 | Breast | breast invasive carcinoma | Female | <65 | I/II | Chemotherapy | doxorubicine | SD | |
| MORC2 | SNV | Missense_Mutation | novel | c.759N>A | p.Met253Ile | p.M253I | Q9Y6X9 | protein_coding | deleterious(0) | probably_damaging(0.914) | TCGA-GM-A2D9-01 | Breast | breast invasive carcinoma | Female | >=65 | I/II | Hormone Therapy | arimidex | SD |
| MORC2 | insertion | In_Frame_Ins | novel | c.1520_1521insTTATATACTTCAAAGTGGTCCAATTCATTTAGA | p.Thr507_Leu508insTyrIleLeuGlnSerGlyProIleHisLeuAsp | p.T507_L508insYILQSGPIHLD | Q9Y6X9 | protein_coding | TCGA-B6-A0I5-01 | Breast | breast invasive carcinoma | Female | <65 | I/II | Unknown | Unknown | SD | ||
| MORC2 | insertion | Nonsense_Mutation | novel | c.1169_1170insCCAGGTCCACGTGTACTATTTGCCAACAGTGTTATTTTAA | p.Ile391GlnfsTer13 | p.I391Qfs*13 | Q9Y6X9 | protein_coding | TCGA-BH-A0B8-01 | Breast | breast invasive carcinoma | Female | <65 | I/II | Hormone Therapy | arimidex | SD | ||
| MORC2 | deletion | Frame_Shift_Del | novel | c.1978delG | p.Glu660ArgfsTer61 | p.E660Rfs*61 | Q9Y6X9 | protein_coding | TCGA-EW-A2FV-01 | Breast | breast invasive carcinoma | Female | <65 | III/IV | Chemotherapy | docetaxel | SD | ||
| MORC2 | SNV | Missense_Mutation | c.79N>A | p.Glu27Lys | p.E27K | Q9Y6X9 | protein_coding | deleterious(0.01) | benign(0.255) | TCGA-2W-A8YY-01 | Cervix | cervical & endocervical cancer | Female | <65 | I/II | Chemotherapy | cisplatin | CR |
| Page: 1 2 3 4 5 6 7 8 9 10 |
Top |
Related drugs of malignant transformation related genes |
| Identification of chemicals and drugs interact with genes involved in malignant transfromation |
| (DGIdb 4.0) |
| Entrez ID | Symbol | Category | Interaction Types | Drug Claim Name | Drug Name | PMIDs |
| Page: 1 |

Copyright 2023-Present -The University of Texas Health Science Center at Houston |