
|
|||||
|
 | |
| |
| |
| |
| |
| |
|
Gene: MON1B |
Gene summary for MON1B |
| Gene information | Species | Human | Gene symbol | MON1B | Gene ID | 22879 |
| Gene name | MON1 homolog B, secretory trafficking associated | |
| Gene Alias | HSRG1 | |
| Cytomap | 16q23.1 | |
| Gene Type | protein-coding | GO ID | GO:0006605 | UniProtAcc | B4DKA0 |
Top |
Malignant transformation analysis |
| Identification of the aberrant gene expression in precancerous and cancerous lesions by comparing the gene expression of stem-like cells in diseased tissues with normal stem cells |
| Entrez ID | Symbol | Replicates | Species | Organ | Tissue | Adj P-value | Log2FC | Malignancy |
| 22879 | MON1B | LZE4T | Human | Esophagus | ESCC | 2.34e-10 | 2.25e-01 | 0.0811 |
| 22879 | MON1B | LZE7T | Human | Esophagus | ESCC | 1.37e-02 | 1.30e-01 | 0.0667 |
| 22879 | MON1B | LZE8T | Human | Esophagus | ESCC | 2.45e-03 | 1.28e-01 | 0.067 |
| 22879 | MON1B | LZE20T | Human | Esophagus | ESCC | 4.38e-02 | 1.14e-01 | 0.0662 |
| 22879 | MON1B | LZE22T | Human | Esophagus | ESCC | 3.26e-02 | 3.57e-01 | 0.068 |
| 22879 | MON1B | LZE24T | Human | Esophagus | ESCC | 1.78e-15 | 3.20e-01 | 0.0596 |
| 22879 | MON1B | LZE21T | Human | Esophagus | ESCC | 7.33e-05 | 2.60e-01 | 0.0655 |
| 22879 | MON1B | P1T-E | Human | Esophagus | ESCC | 1.64e-18 | 6.67e-01 | 0.0875 |
| 22879 | MON1B | P2T-E | Human | Esophagus | ESCC | 1.79e-18 | 1.63e-01 | 0.1177 |
| 22879 | MON1B | P4T-E | Human | Esophagus | ESCC | 3.71e-12 | 2.50e-01 | 0.1323 |
| 22879 | MON1B | P5T-E | Human | Esophagus | ESCC | 3.91e-12 | 1.01e-01 | 0.1327 |
| 22879 | MON1B | P8T-E | Human | Esophagus | ESCC | 8.17e-22 | 3.95e-01 | 0.0889 |
| 22879 | MON1B | P9T-E | Human | Esophagus | ESCC | 7.35e-04 | 1.05e-01 | 0.1131 |
| 22879 | MON1B | P10T-E | Human | Esophagus | ESCC | 1.65e-15 | 1.22e-01 | 0.116 |
| 22879 | MON1B | P11T-E | Human | Esophagus | ESCC | 4.45e-09 | 2.66e-01 | 0.1426 |
| 22879 | MON1B | P12T-E | Human | Esophagus | ESCC | 2.40e-14 | 1.42e-01 | 0.1122 |
| 22879 | MON1B | P15T-E | Human | Esophagus | ESCC | 8.08e-13 | 1.95e-01 | 0.1149 |
| 22879 | MON1B | P16T-E | Human | Esophagus | ESCC | 2.49e-10 | 9.83e-02 | 0.1153 |
| 22879 | MON1B | P17T-E | Human | Esophagus | ESCC | 3.94e-03 | 9.05e-02 | 0.1278 |
| 22879 | MON1B | P20T-E | Human | Esophagus | ESCC | 1.58e-29 | 6.39e-01 | 0.1124 |
| Page: 1 2 3 4 5 |
| Tissue | Expression Dynamics | Abbreviation |
| Esophagus | 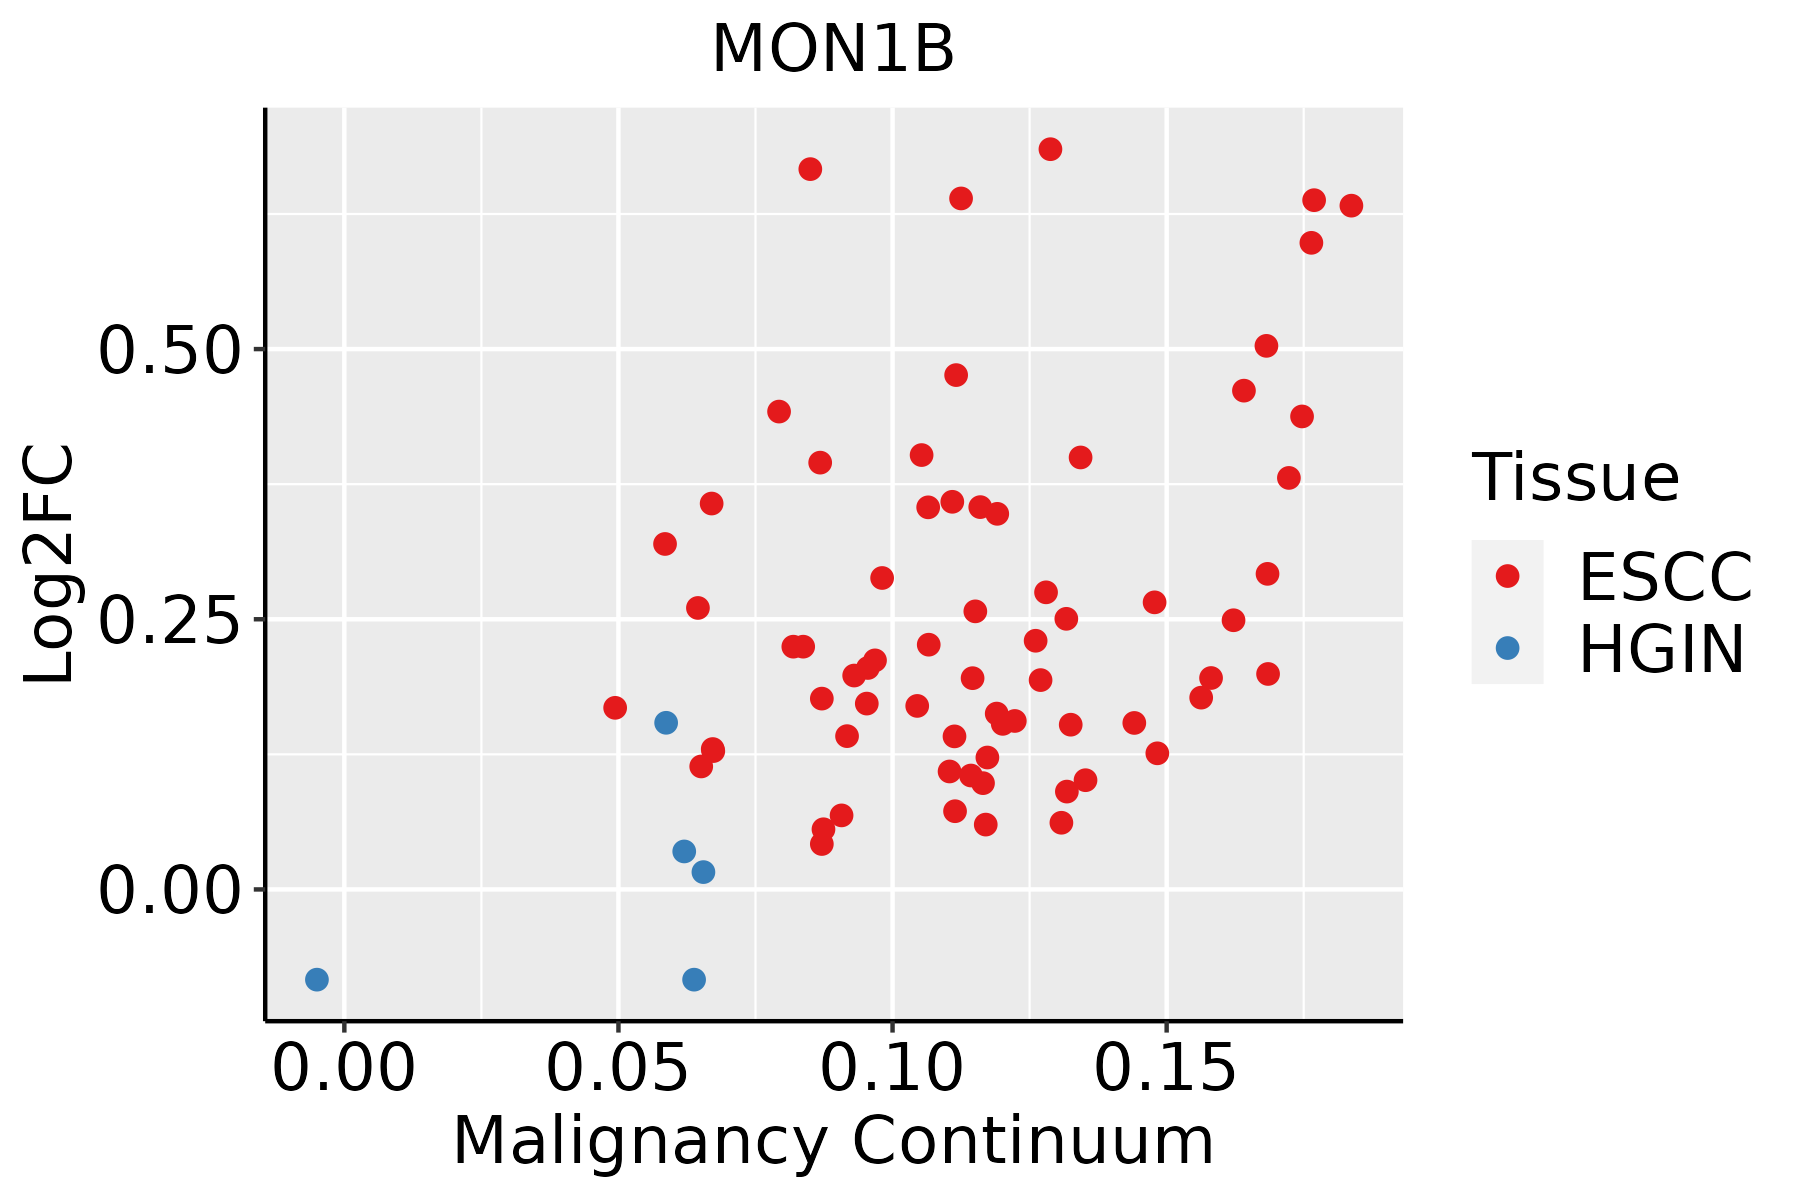 | ESCC: Esophageal squamous cell carcinoma |
| HGIN: High-grade intraepithelial neoplasias | ||
| LGIN: Low-grade intraepithelial neoplasias | ||
| Liver | 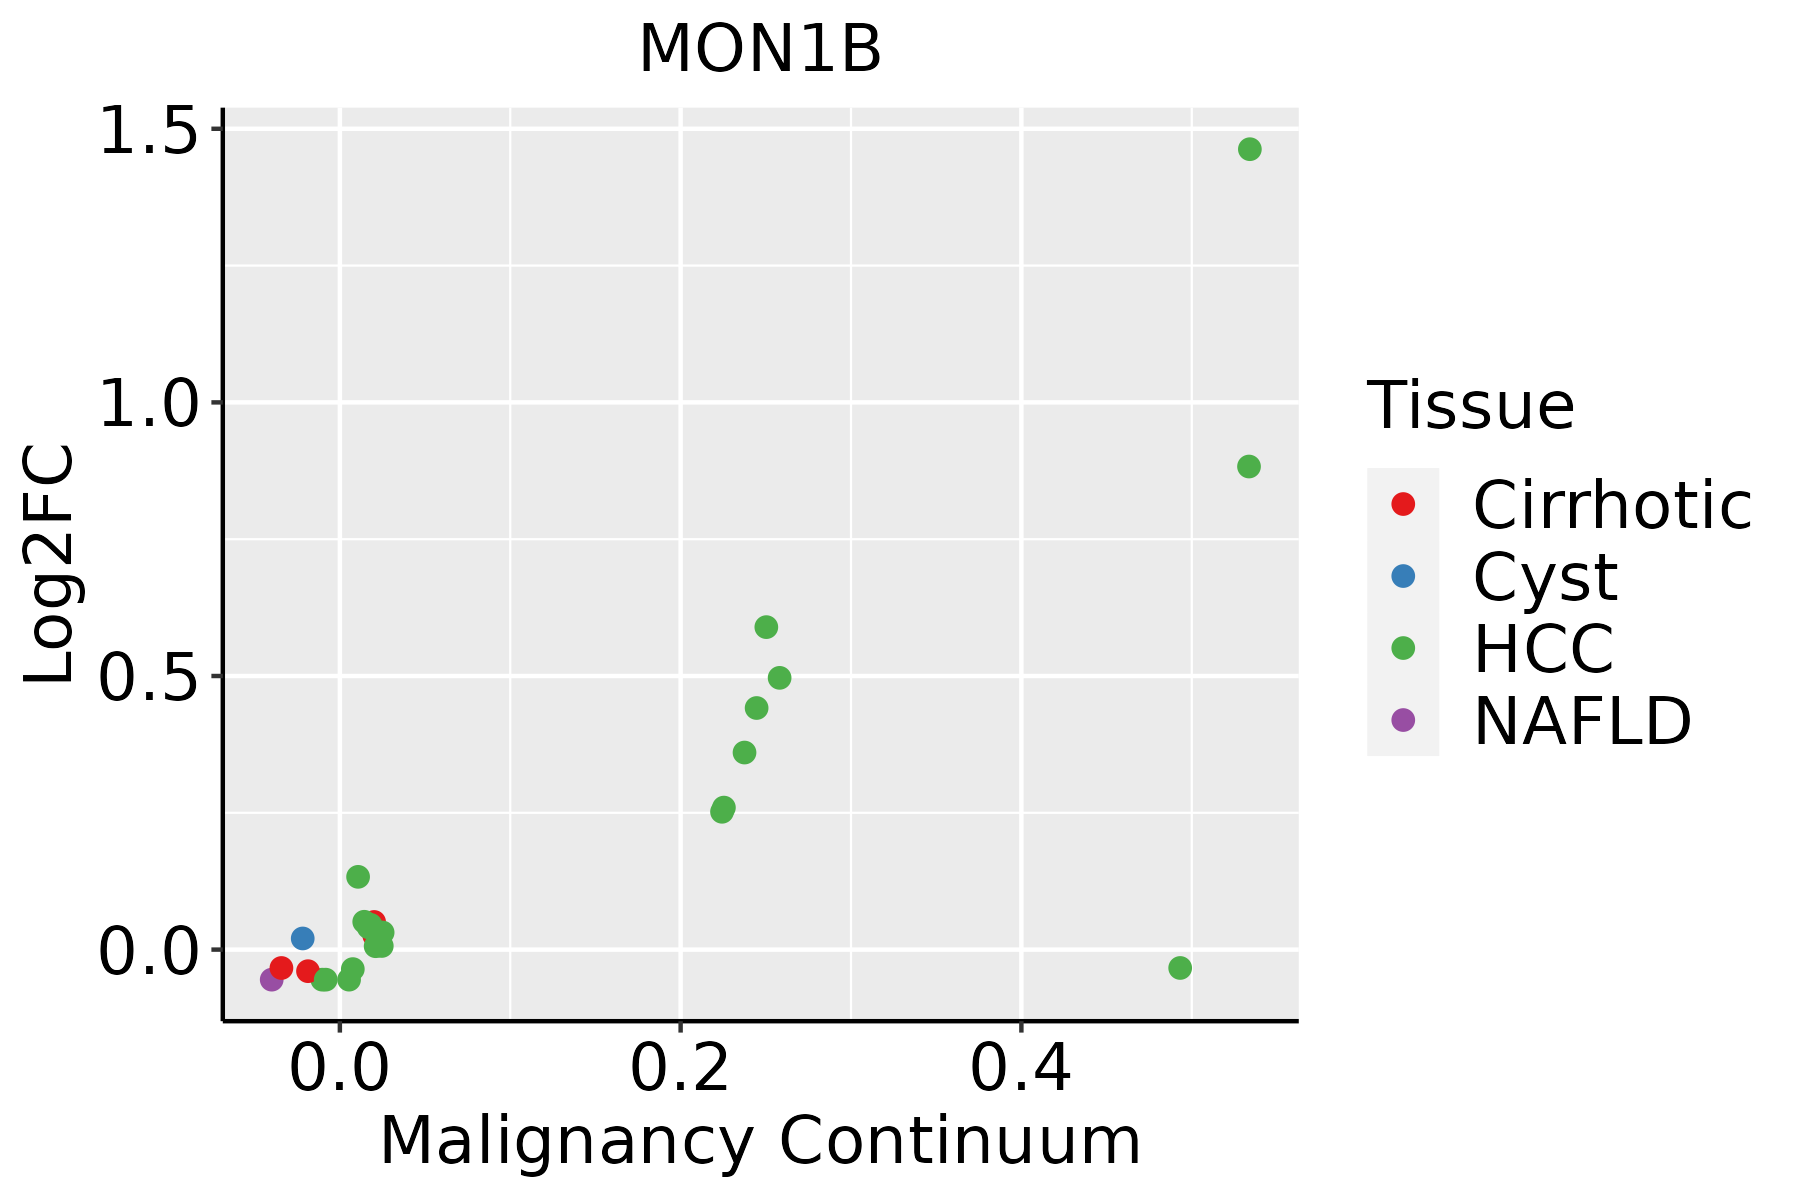 | HCC: Hepatocellular carcinoma |
| NAFLD: Non-alcoholic fatty liver disease | ||
| Oral Cavity | 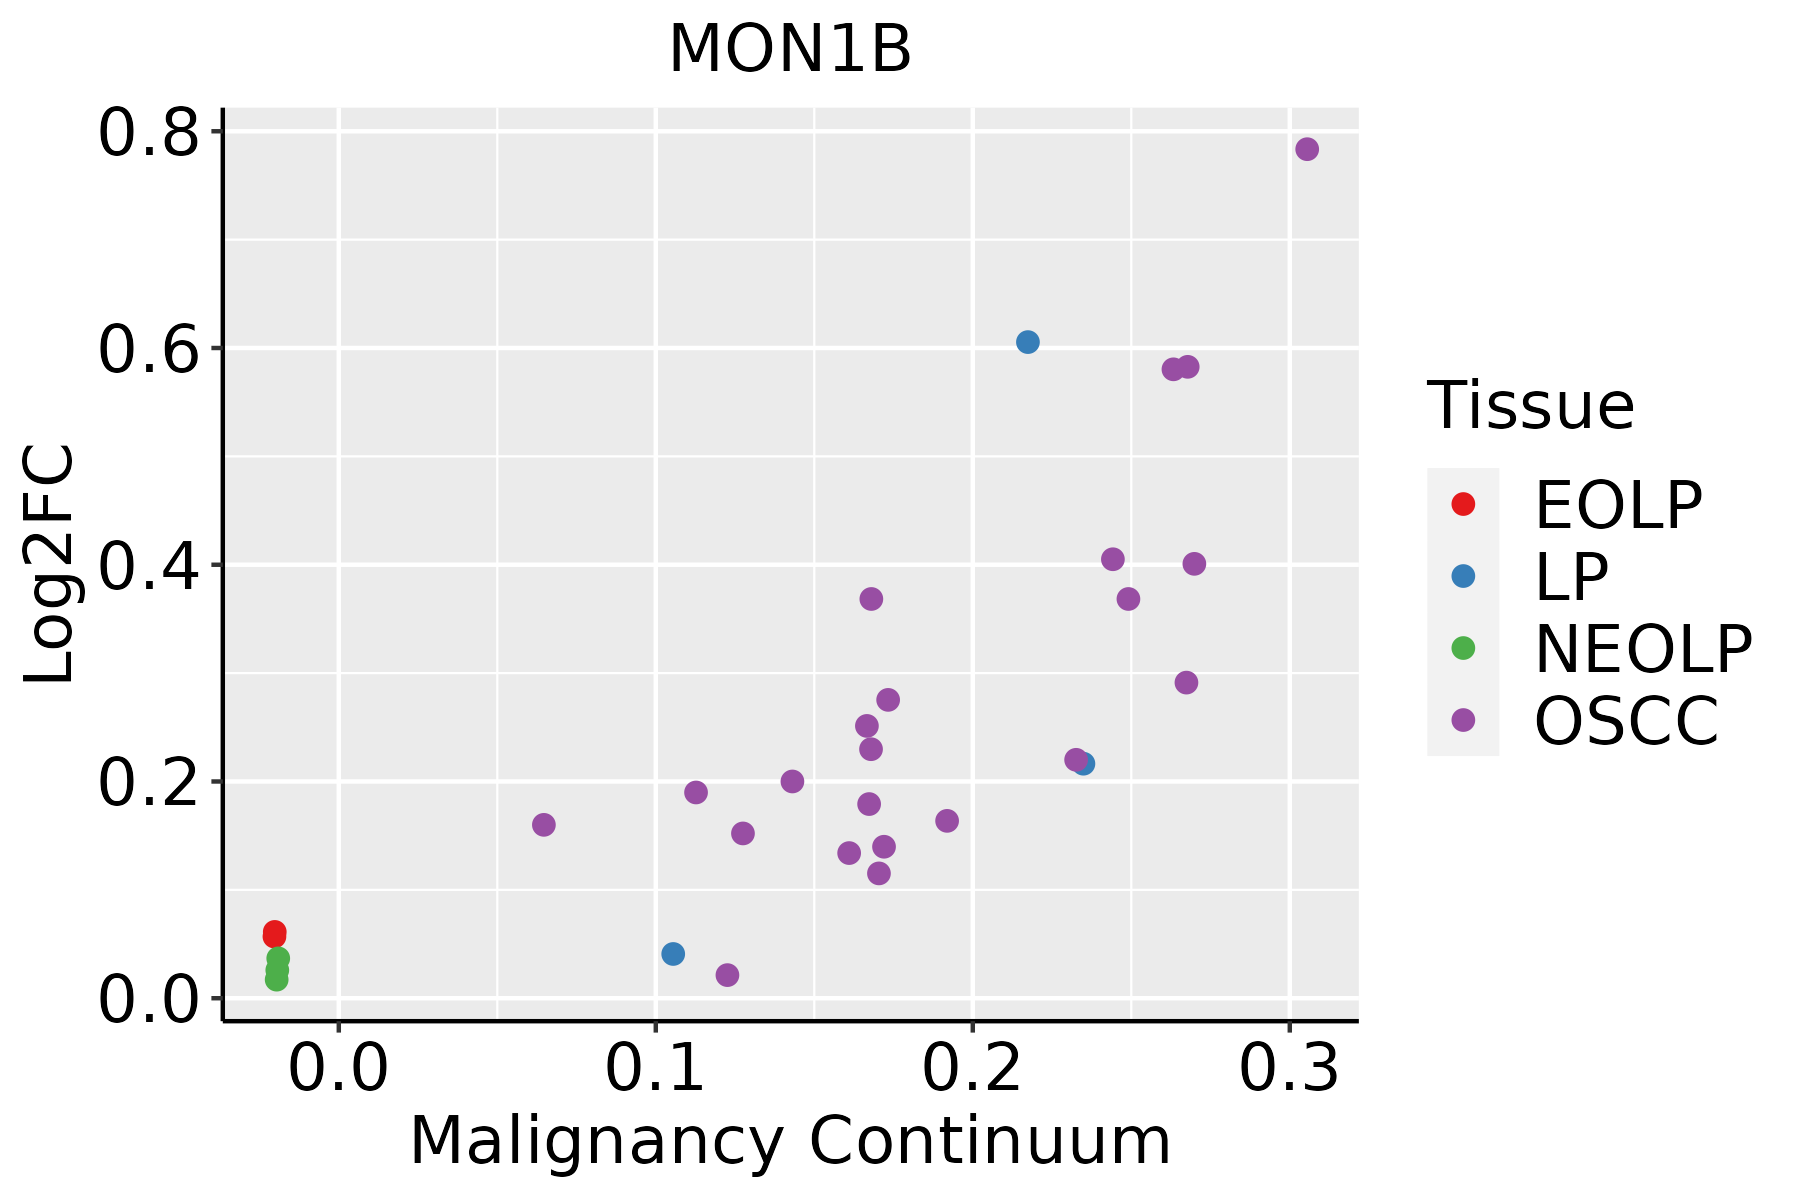 | EOLP: Erosive Oral lichen planus |
| LP: leukoplakia | ||
| NEOLP: Non-erosive oral lichen planus | ||
| OSCC: Oral squamous cell carcinoma | ||
| Prostate | 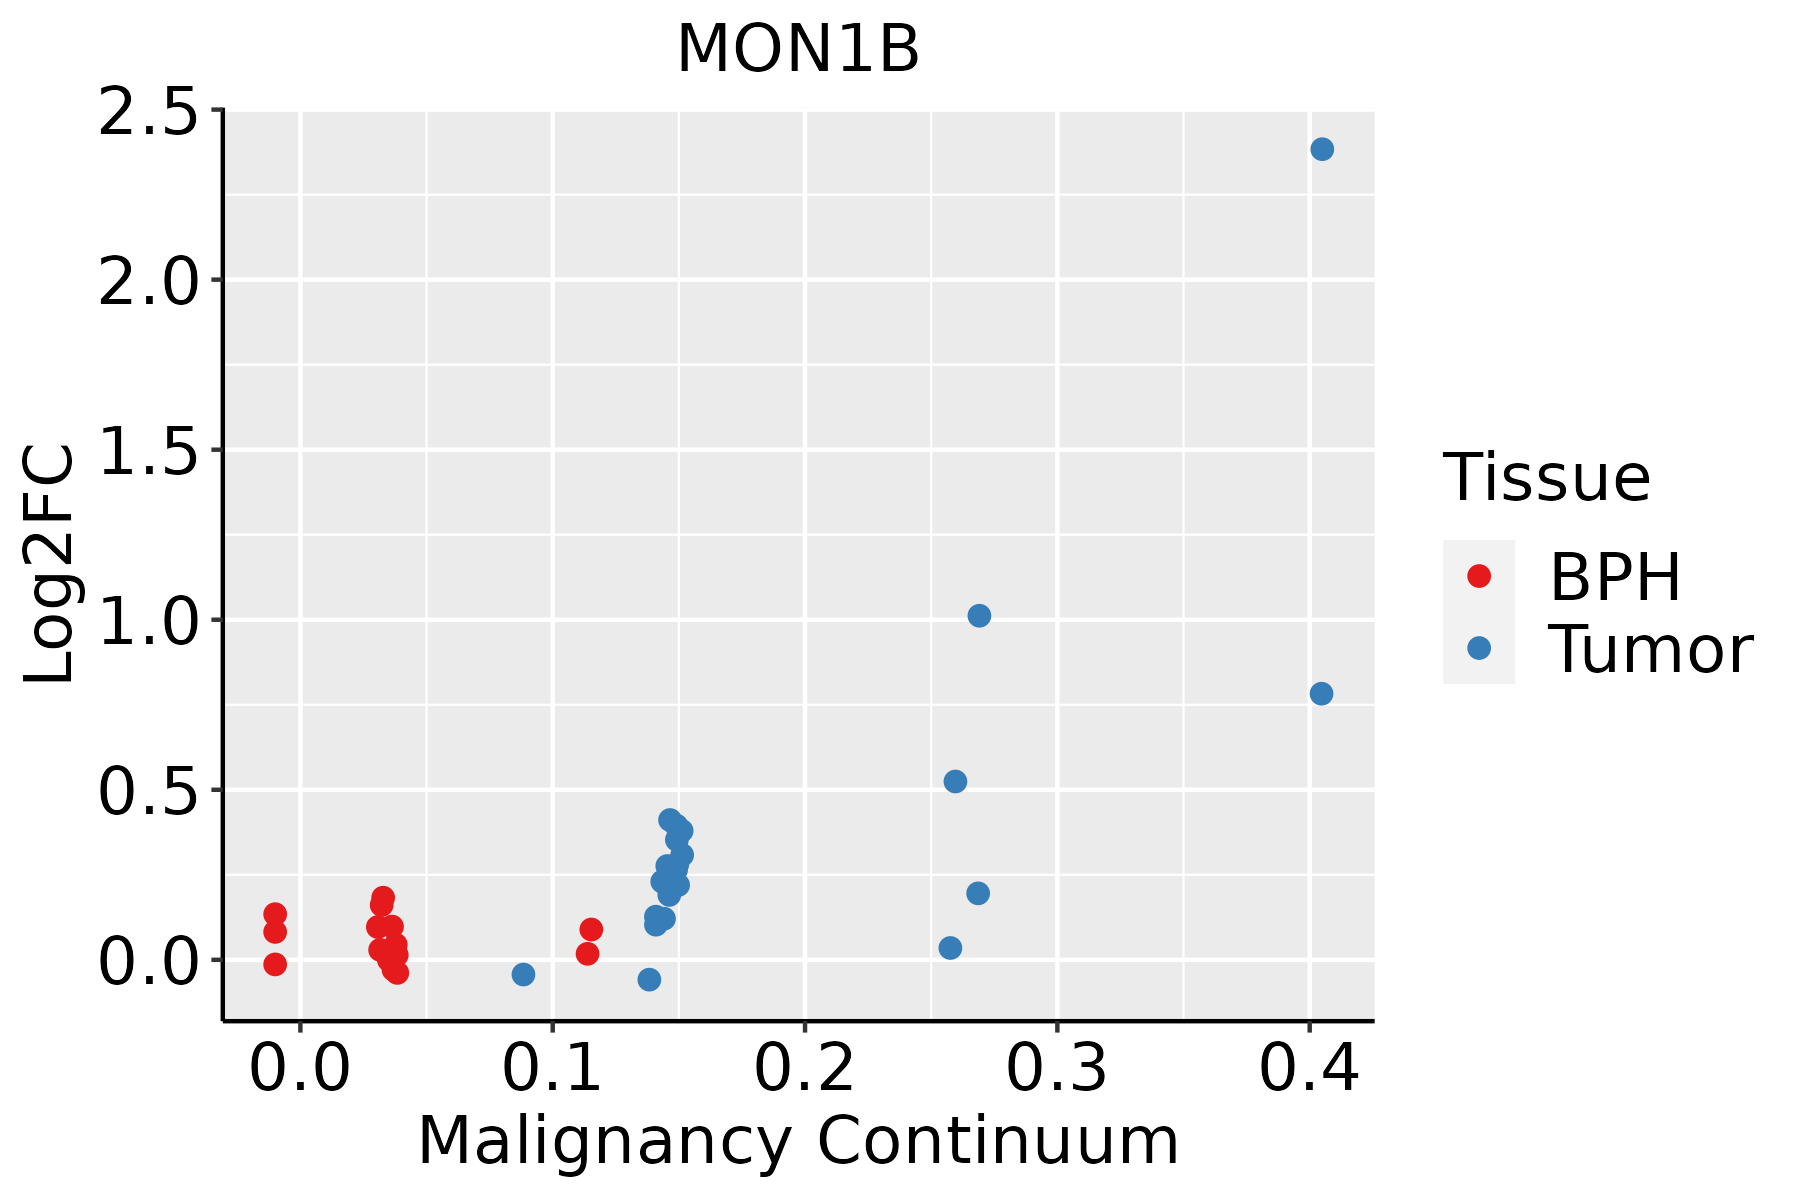 | BPH: Benign Prostatic Hyperplasia |
| Thyroid |  | ATC: Anaplastic thyroid cancer |
| HT: Hashimoto's thyroiditis | ||
| PTC: Papillary thyroid cancer |
| ∗log2FC in expression of this searched gene in stem-like cells from each diseased tissue sample relative to stem-like cells in normal samples in each tissue plotted against the malignancy continuum. Samples are colored based on if they are from different disease stage. |
Top |
Malignant transformation related pathway analysis |
| Find out the enriched GO biological processes and KEGG pathways involved in transition from healthy to precancer to cancer |
| Tissue | Disease Stage | Enriched GO biological Processes |
| Colorectum | AD |  |
| Colorectum | SER |  |
| Colorectum | MSS |  |
| Colorectum | MSI-H |  |
| Colorectum | FAP |  |
| ∗Top 15 enriched GO BP terms are showed in the bar plot of each disease state in each tissue. Each row represents a significant GO biological process which is colored according to the -log10(p.adjust). |
| Page: 1 2 3 4 5 6 7 8 9 |
| GO ID | Tissue | Disease Stage | Description | Gene Ratio | Bg Ratio | pvalue | p.adjust | Count |
| GO:0072594110 | Esophagus | ESCC | establishment of protein localization to organelle | 311/8552 | 422/18723 | 3.02e-32 | 2.13e-29 | 311 |
| GO:0016032111 | Esophagus | ESCC | viral process | 301/8552 | 415/18723 | 3.34e-29 | 1.32e-26 | 301 |
| GO:0006605111 | Esophagus | ESCC | protein targeting | 229/8552 | 314/18723 | 4.93e-23 | 1.01e-20 | 229 |
| GO:001908017 | Esophagus | ESCC | viral gene expression | 80/8552 | 94/18723 | 2.04e-15 | 1.28e-13 | 80 |
| GO:000703417 | Esophagus | ESCC | vacuolar transport | 119/8552 | 157/18723 | 1.16e-14 | 6.30e-13 | 119 |
| GO:00726659 | Esophagus | ESCC | protein localization to vacuole | 52/8552 | 67/18723 | 9.14e-08 | 1.52e-06 | 52 |
| GO:001908312 | Esophagus | ESCC | viral transcription | 41/8552 | 50/18723 | 1.35e-07 | 2.17e-06 | 41 |
| GO:00066238 | Esophagus | ESCC | protein targeting to vacuole | 31/8552 | 37/18723 | 1.95e-06 | 2.26e-05 | 31 |
| GO:00726668 | Esophagus | ESCC | establishment of protein localization to vacuole | 37/8552 | 49/18723 | 2.05e-05 | 1.78e-04 | 37 |
| GO:007259422 | Liver | HCC | establishment of protein localization to organelle | 299/7958 | 422/18723 | 1.06e-32 | 6.10e-30 | 299 |
| GO:001603222 | Liver | HCC | viral process | 286/7958 | 415/18723 | 4.41e-28 | 1.86e-25 | 286 |
| GO:000660512 | Liver | HCC | protein targeting | 219/7958 | 314/18723 | 7.74e-23 | 1.49e-20 | 219 |
| GO:001908021 | Liver | HCC | viral gene expression | 77/7958 | 94/18723 | 4.33e-15 | 3.12e-13 | 77 |
| GO:000703421 | Liver | HCC | vacuolar transport | 108/7958 | 157/18723 | 2.22e-11 | 8.69e-10 | 108 |
| GO:00190831 | Liver | HCC | viral transcription | 40/7958 | 50/18723 | 6.50e-08 | 1.35e-06 | 40 |
| GO:007266521 | Liver | HCC | protein localization to vacuole | 48/7958 | 67/18723 | 1.27e-06 | 1.85e-05 | 48 |
| GO:00726662 | Liver | HCC | establishment of protein localization to vacuole | 35/7958 | 49/18723 | 3.90e-05 | 3.85e-04 | 35 |
| GO:000662321 | Liver | HCC | protein targeting to vacuole | 28/7958 | 37/18723 | 4.26e-05 | 4.16e-04 | 28 |
| GO:007259418 | Oral cavity | OSCC | establishment of protein localization to organelle | 284/7305 | 422/18723 | 1.50e-32 | 1.35e-29 | 284 |
| GO:001603220 | Oral cavity | OSCC | viral process | 274/7305 | 415/18723 | 2.42e-29 | 1.70e-26 | 274 |
| Page: 1 2 3 4 |
| Pathway ID | Tissue | Disease Stage | Description | Gene Ratio | Bg Ratio | pvalue | p.adjust | qvalue | Count |
| Page: 1 |
Top |
Cell-cell communication analysis |
| Identification of potential cell-cell interactions between two cell types and their ligand-receptor pairs for different disease states |
| Ligand | Receptor | LRpair | Pathway | Tissue | Disease Stage |
| Page: 1 |
Top |
Single-cell gene regulatory network inference analysis |
| Find out the significant the regulons (TFs) and the target genes of each regulon across cell types for different disease states |
| TF | Cell Type | Tissue | Disease Stage | Target Gene | RSS | Regulon Activity |
| ∗The dot plots of a searched regulon are shown for all cell subpopulations in each disease state of each tissue based on the regulon specific score inferred using pySCENIC and by calculating the average expression. |
| Page: 1 |
Top |
Somatic mutation of malignant transformation related genes |
| Annotation of somatic variants for genes involved in malignant transformation |
| Hugo Symbol | Variant Class | Variant Classification | dbSNP RS | HGVSc | HGVSp | HGVSp Short | SWISSPROT | BIOTYPE | SIFT | PolyPhen | Tumor Sample Barcode | Tissue | Histology | Sex | Age | Stage | Therapy Types | Drugs | Outcome |
| MON1B | SNV | Missense_Mutation | rs769422811 | c.1496C>A | p.Ala499Glu | p.A499E | Q7L1V2 | protein_coding | tolerated(0.05) | probably_damaging(0.966) | TCGA-A7-A3IZ-01 | Breast | breast invasive carcinoma | Female | <65 | I/II | Chemotherapy | cytoxan | SD |
| MON1B | SNV | Missense_Mutation | rs758500834 | c.1553N>A | p.Arg518Gln | p.R518Q | Q7L1V2 | protein_coding | deleterious(0.02) | probably_damaging(0.998) | TCGA-A8-A09Z-01 | Breast | breast invasive carcinoma | Female | >=65 | I/II | Unknown | Unknown | SD |
| MON1B | SNV | Missense_Mutation | novel | c.1313C>T | p.Pro438Leu | p.P438L | Q7L1V2 | protein_coding | tolerated(0.06) | probably_damaging(0.999) | TCGA-BH-A0E2-01 | Breast | breast invasive carcinoma | Female | <65 | III/IV | Chemotherapy | doxorubicin | SD |
| MON1B | SNV | Missense_Mutation | c.244N>C | p.Glu82Gln | p.E82Q | Q7L1V2 | protein_coding | tolerated(0.15) | benign(0.011) | TCGA-D8-A13Y-01 | Breast | breast invasive carcinoma | Female | <65 | I/II | Chemotherapy | doxorubicin | SD | |
| MON1B | SNV | Missense_Mutation | novel | c.1564C>T | p.Arg522Cys | p.R522C | Q7L1V2 | protein_coding | deleterious(0.02) | benign(0.27) | TCGA-OL-A5D6-01 | Breast | breast invasive carcinoma | Female | >=65 | I/II | Unknown | Unknown | SD |
| MON1B | insertion | Frame_Shift_Ins | novel | c.1315_1316insTCTGGTGG | p.Tyr439PhefsTer47 | p.Y439Ffs*47 | Q7L1V2 | protein_coding | TCGA-BH-A0E2-01 | Breast | breast invasive carcinoma | Female | <65 | III/IV | Chemotherapy | doxorubicin | SD | ||
| MON1B | SNV | Missense_Mutation | c.1111N>A | p.Glu371Lys | p.E371K | Q7L1V2 | protein_coding | tolerated(0.65) | possibly_damaging(0.883) | TCGA-DS-A1OB-01 | Cervix | cervical & endocervical cancer | Female | <65 | I/II | Chemotherapy | carboplatin | PD | |
| MON1B | SNV | Missense_Mutation | rs200585249 | c.1025N>A | p.Arg342His | p.R342H | Q7L1V2 | protein_coding | deleterious(0.03) | benign(0.435) | TCGA-ZJ-AAXF-01 | Cervix | cervical & endocervical cancer | Female | <65 | I/II | Unknown | Unknown | SD |
| MON1B | insertion | In_Frame_Ins | novel | c.870_871insGTCATAGTT | p.Glu290_Arg291insValIleVal | p.E290_R291insVIV | Q7L1V2 | protein_coding | TCGA-DS-A1OC-01 | Cervix | cervical & endocervical cancer | Female | <65 | I/II | Chemotherapy | gemcitabine | SD | ||
| MON1B | SNV | Missense_Mutation | c.1099N>T | p.Arg367Trp | p.R367W | Q7L1V2 | protein_coding | deleterious(0) | probably_damaging(0.965) | TCGA-A6-5665-01 | Colorectum | colon adenocarcinoma | Female | >=65 | I/II | Unknown | Unknown | PD |
| Page: 1 2 3 4 5 6 7 8 |
Top |
Related drugs of malignant transformation related genes |
| Identification of chemicals and drugs interact with genes involved in malignant transfromation |
| (DGIdb 4.0) |
| Entrez ID | Symbol | Category | Interaction Types | Drug Claim Name | Drug Name | PMIDs |
| Page: 1 |

Copyright 2023-Present -The University of Texas Health Science Center at Houston |