
|
|||||
|
 | |
| |
| |
| |
| |
| |
|
Gene: MOGS |
Gene summary for MOGS |
| Gene information | Species | Human | Gene symbol | MOGS | Gene ID | 7841 |
| Gene name | mannosyl-oligosaccharide glucosidase | |
| Gene Alias | CDG2B | |
| Cytomap | 2p13.1 | |
| Gene Type | protein-coding | GO ID | GO:0005975 | UniProtAcc | Q13724 |
Top |
Malignant transformation analysis |
| Identification of the aberrant gene expression in precancerous and cancerous lesions by comparing the gene expression of stem-like cells in diseased tissues with normal stem cells |
| Entrez ID | Symbol | Replicates | Species | Organ | Tissue | Adj P-value | Log2FC | Malignancy |
| 7841 | MOGS | HTA11_3410_2000001011 | Human | Colorectum | AD | 3.70e-04 | 1.42e-01 | 0.0155 |
| 7841 | MOGS | HTA11_1938_2000001011 | Human | Colorectum | AD | 2.49e-06 | 3.08e-01 | -0.0811 |
| 7841 | MOGS | HTA11_78_2000001011 | Human | Colorectum | AD | 1.23e-05 | 2.35e-01 | -0.1088 |
| 7841 | MOGS | HTA11_347_2000001011 | Human | Colorectum | AD | 3.98e-14 | 4.17e-01 | -0.1954 |
| 7841 | MOGS | HTA11_411_2000001011 | Human | Colorectum | SER | 1.85e-03 | 4.77e-01 | -0.2602 |
| 7841 | MOGS | HTA11_3361_2000001011 | Human | Colorectum | AD | 5.23e-08 | 4.14e-01 | -0.1207 |
| 7841 | MOGS | HTA11_83_2000001011 | Human | Colorectum | SER | 1.28e-05 | 3.42e-01 | -0.1526 |
| 7841 | MOGS | HTA11_696_2000001011 | Human | Colorectum | AD | 1.17e-08 | 3.88e-01 | -0.1464 |
| 7841 | MOGS | HTA11_866_2000001011 | Human | Colorectum | AD | 7.95e-03 | 2.03e-01 | -0.1001 |
| 7841 | MOGS | HTA11_1391_2000001011 | Human | Colorectum | AD | 1.46e-12 | 5.20e-01 | -0.059 |
| 7841 | MOGS | HTA11_546_2000001011 | Human | Colorectum | AD | 4.12e-03 | 3.18e-01 | -0.0842 |
| 7841 | MOGS | HTA11_7862_2000001011 | Human | Colorectum | AD | 1.09e-06 | 4.19e-01 | -0.0179 |
| 7841 | MOGS | HTA11_866_3004761011 | Human | Colorectum | AD | 3.46e-18 | 4.92e-01 | 0.096 |
| 7841 | MOGS | HTA11_7663_2000001011 | Human | Colorectum | SER | 7.95e-05 | 4.82e-01 | 0.0131 |
| 7841 | MOGS | HTA11_7696_3000711011 | Human | Colorectum | AD | 1.72e-05 | 2.63e-01 | 0.0674 |
| 7841 | MOGS | HTA11_6818_2000001021 | Human | Colorectum | AD | 7.31e-09 | 3.95e-01 | 0.0588 |
| 7841 | MOGS | HTA11_99999970781_79442 | Human | Colorectum | MSS | 2.49e-04 | 2.83e-01 | 0.294 |
| 7841 | MOGS | HTA11_99999971662_82457 | Human | Colorectum | MSS | 1.32e-13 | 5.27e-01 | 0.3859 |
| 7841 | MOGS | HTA11_99999973899_84307 | Human | Colorectum | MSS | 1.72e-03 | 3.83e-01 | 0.2585 |
| 7841 | MOGS | HTA11_99999974143_84620 | Human | Colorectum | MSS | 3.18e-11 | 4.22e-01 | 0.3005 |
| Page: 1 2 3 4 5 6 |
| Tissue | Expression Dynamics | Abbreviation |
| Colorectum (GSE201348) |  | FAP: Familial adenomatous polyposis |
| CRC: Colorectal cancer | ||
| Colorectum (HTA11) |  | AD: Adenomas |
| SER: Sessile serrated lesions | ||
| MSI-H: Microsatellite-high colorectal cancer | ||
| MSS: Microsatellite stable colorectal cancer | ||
| Esophagus | 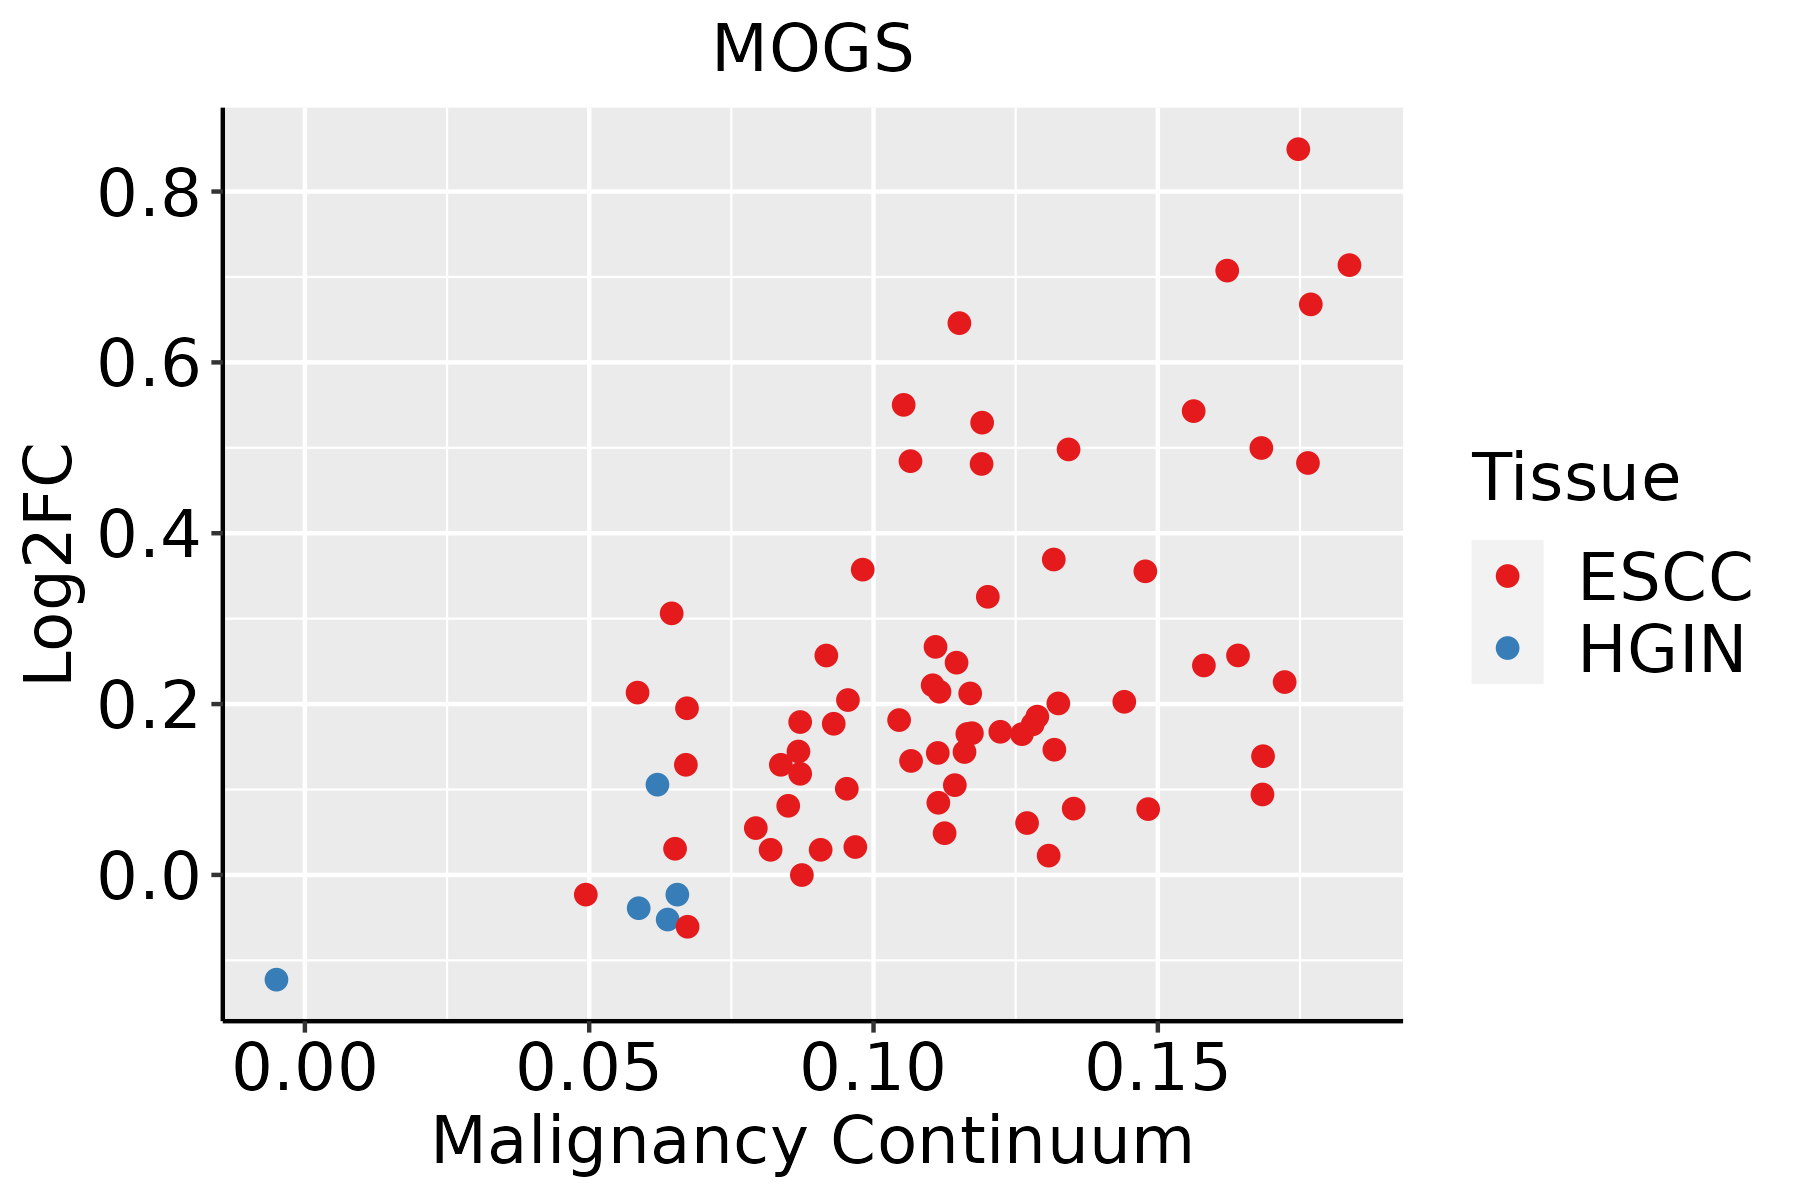 | ESCC: Esophageal squamous cell carcinoma |
| HGIN: High-grade intraepithelial neoplasias | ||
| LGIN: Low-grade intraepithelial neoplasias | ||
| Liver | 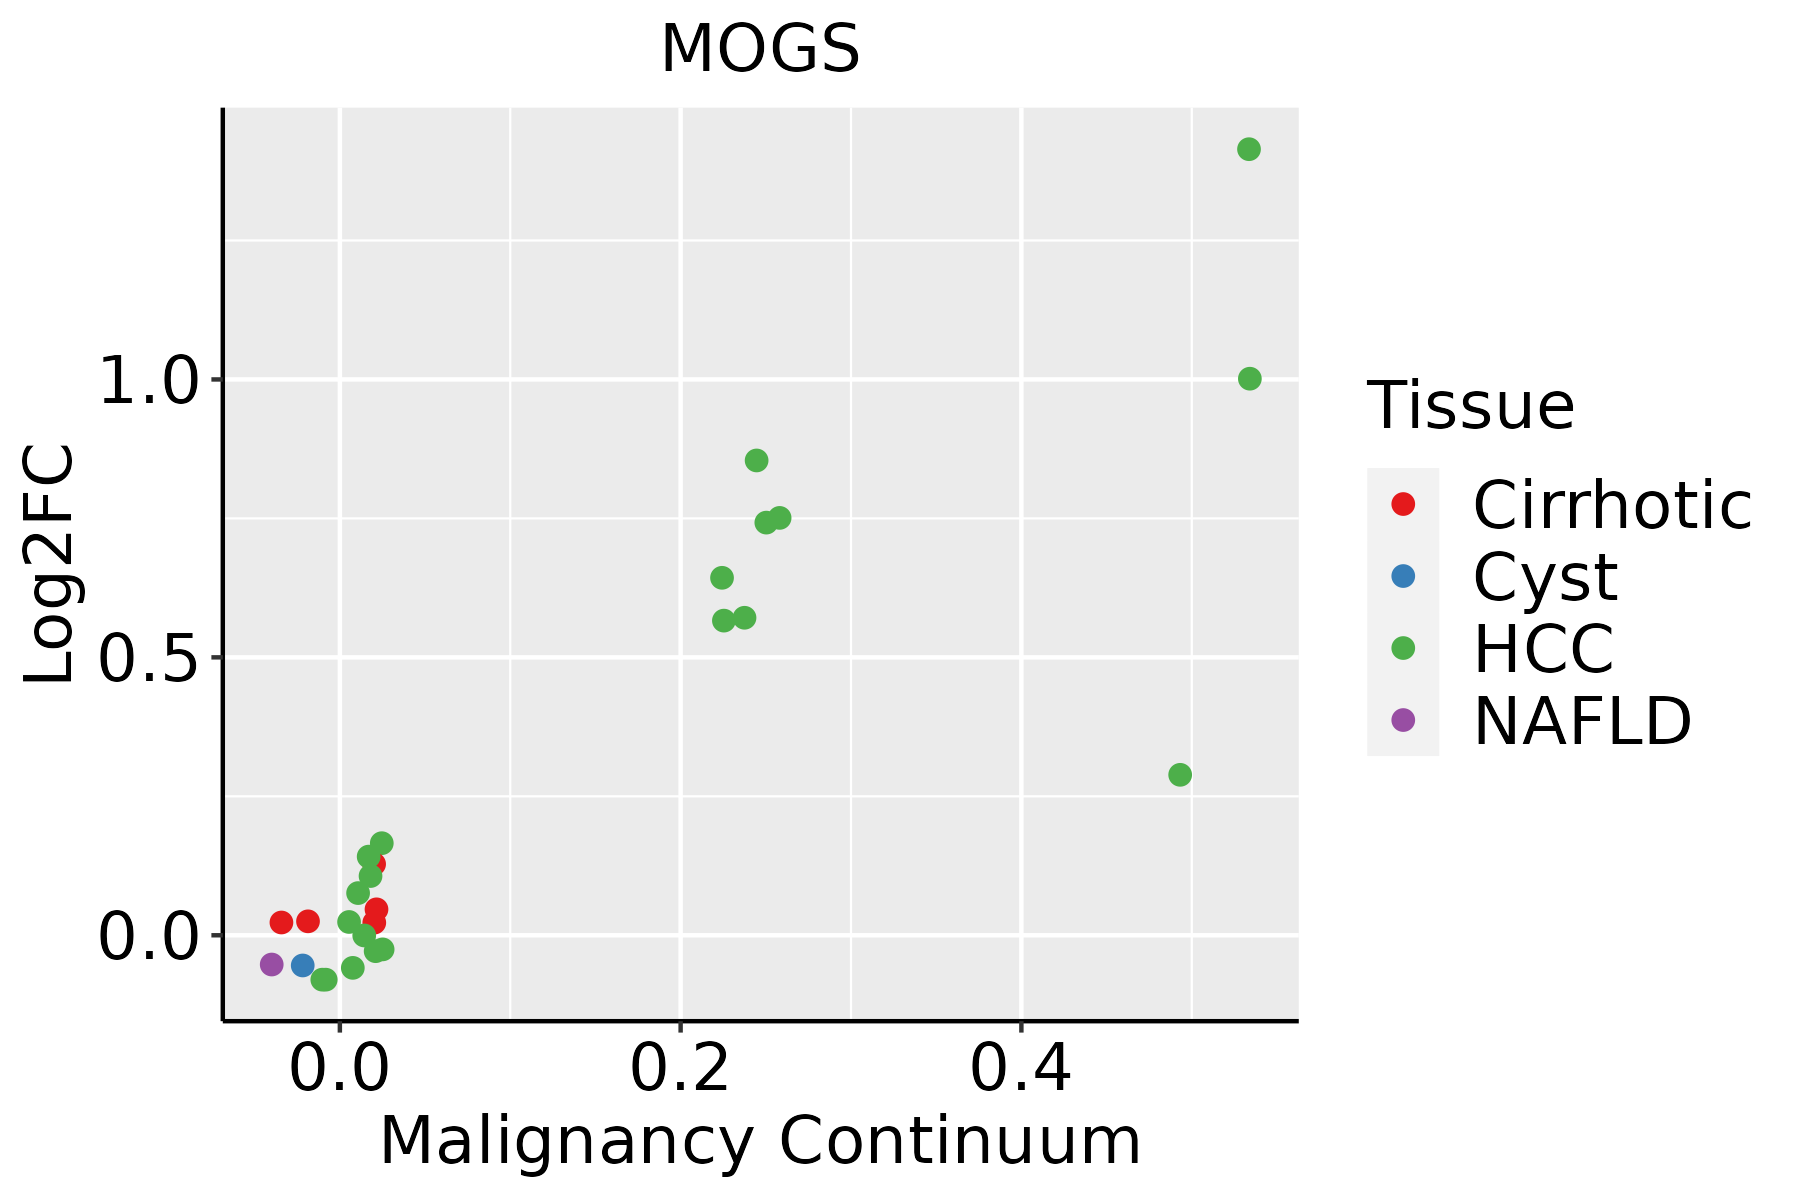 | HCC: Hepatocellular carcinoma |
| NAFLD: Non-alcoholic fatty liver disease | ||
| Oral Cavity |  | EOLP: Erosive Oral lichen planus |
| LP: leukoplakia | ||
| NEOLP: Non-erosive oral lichen planus | ||
| OSCC: Oral squamous cell carcinoma | ||
| Skin |  | AK: Actinic keratosis |
| cSCC: Cutaneous squamous cell carcinoma | ||
| SCCIS:squamous cell carcinoma in situ | ||
| Thyroid | 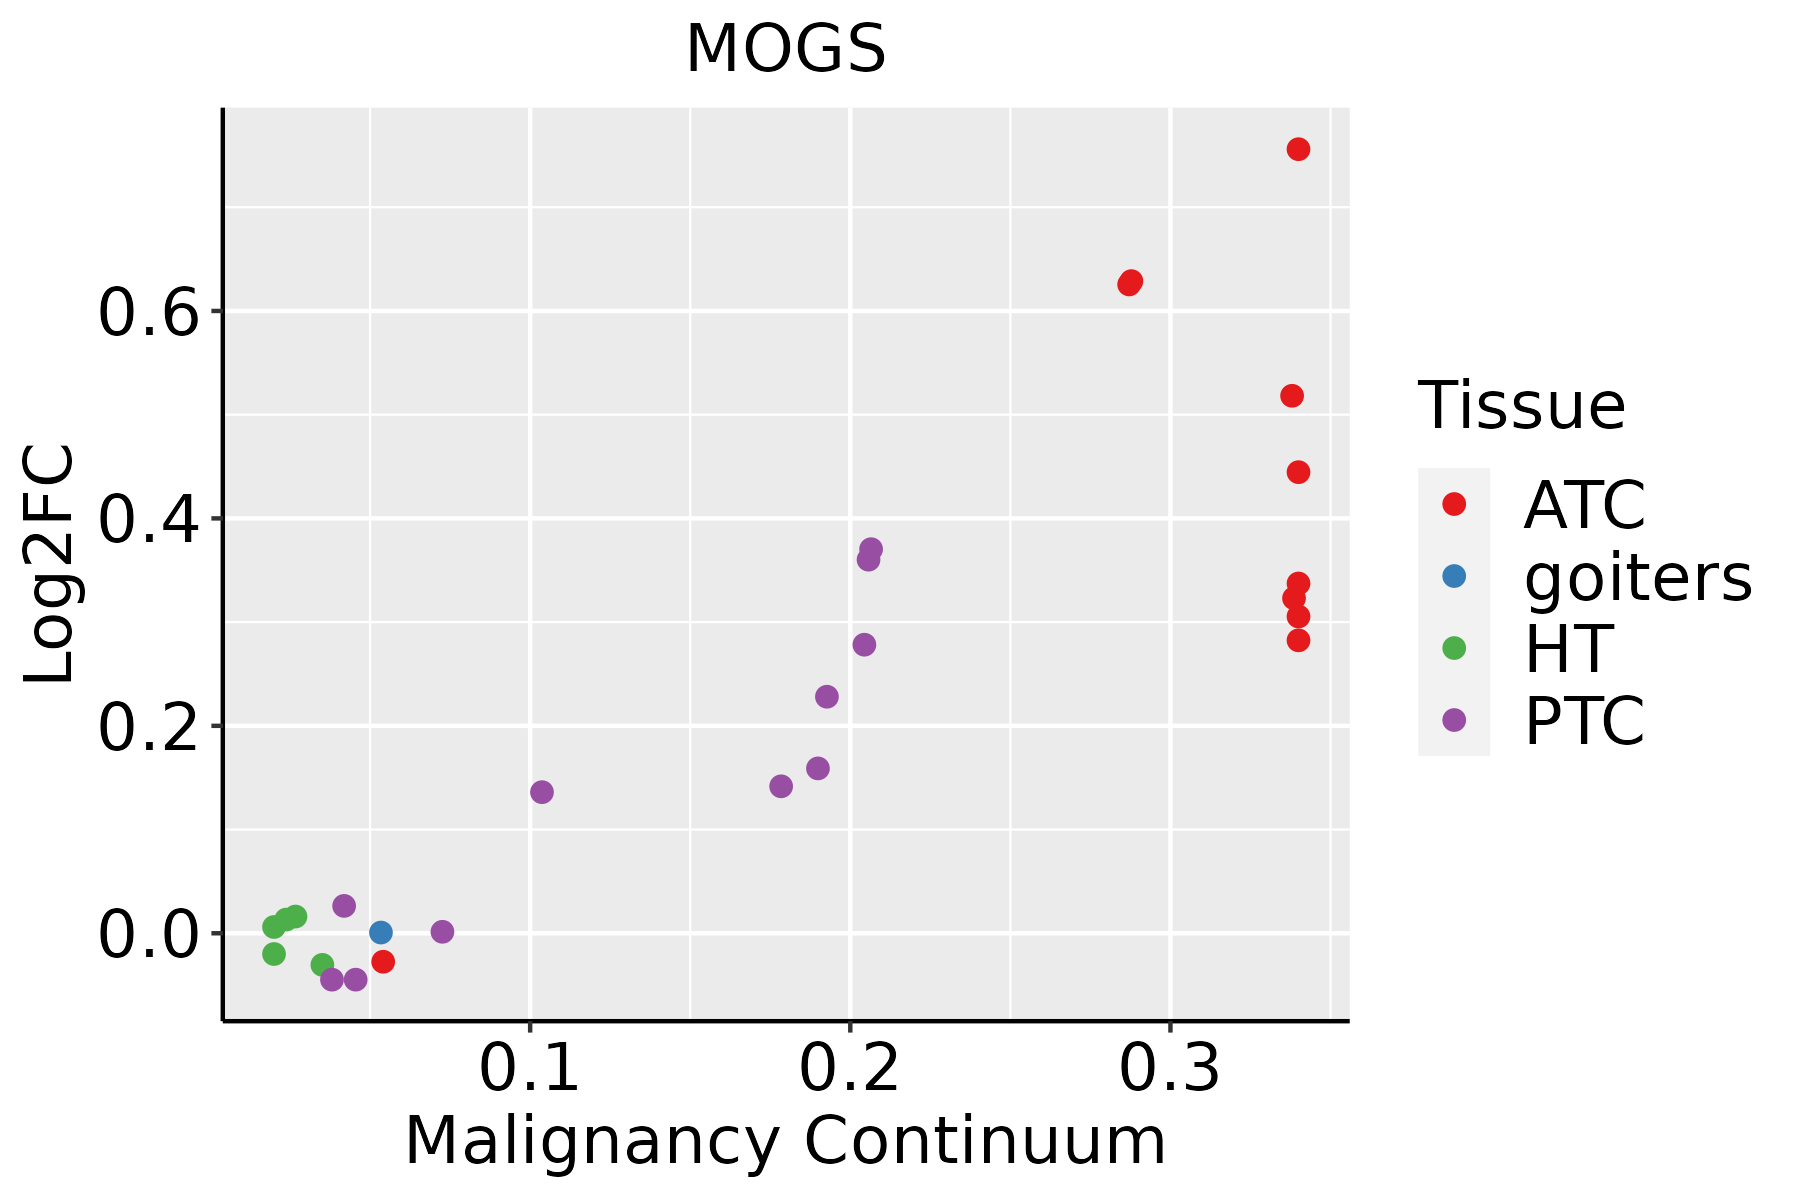 | ATC: Anaplastic thyroid cancer |
| HT: Hashimoto's thyroiditis | ||
| PTC: Papillary thyroid cancer |
| ∗log2FC in expression of this searched gene in stem-like cells from each diseased tissue sample relative to stem-like cells in normal samples in each tissue plotted against the malignancy continuum. Samples are colored based on if they are from different disease stage. |
Top |
Malignant transformation related pathway analysis |
| Find out the enriched GO biological processes and KEGG pathways involved in transition from healthy to precancer to cancer |
| Tissue | Disease Stage | Enriched GO biological Processes |
| Colorectum | AD |  |
| Colorectum | SER |  |
| Colorectum | MSS |  |
| Colorectum | MSI-H |  |
| Colorectum | FAP |  |
| ∗Top 15 enriched GO BP terms are showed in the bar plot of each disease state in each tissue. Each row represents a significant GO biological process which is colored according to the -log10(p.adjust). |
| Page: 1 2 3 4 5 6 7 8 9 |
| GO ID | Tissue | Disease Stage | Description | Gene Ratio | Bg Ratio | pvalue | p.adjust | Count |
| GO:0016032 | Colorectum | AD | viral process | 168/3918 | 415/18723 | 4.67e-20 | 3.66e-17 | 168 |
| GO:0019080 | Colorectum | AD | viral gene expression | 42/3918 | 94/18723 | 1.90e-07 | 8.02e-06 | 42 |
| GO:0006457 | Colorectum | AD | protein folding | 73/3918 | 212/18723 | 3.24e-06 | 9.10e-05 | 73 |
| GO:0019082 | Colorectum | AD | viral protein processing | 17/3918 | 29/18723 | 1.04e-05 | 2.40e-04 | 17 |
| GO:0006487 | Colorectum | AD | protein N-linked glycosylation | 25/3918 | 65/18723 | 9.12e-04 | 8.71e-03 | 25 |
| GO:0006486 | Colorectum | AD | protein glycosylation | 64/3918 | 226/18723 | 4.86e-03 | 3.27e-02 | 64 |
| GO:0043413 | Colorectum | AD | macromolecule glycosylation | 64/3918 | 226/18723 | 4.86e-03 | 3.27e-02 | 64 |
| GO:0070085 | Colorectum | AD | glycosylation | 67/3918 | 240/18723 | 5.78e-03 | 3.67e-02 | 67 |
| GO:00160321 | Colorectum | SER | viral process | 118/2897 | 415/18723 | 8.36e-12 | 1.65e-09 | 118 |
| GO:00064571 | Colorectum | SER | protein folding | 54/2897 | 212/18723 | 1.04e-04 | 2.18e-03 | 54 |
| GO:00190801 | Colorectum | SER | viral gene expression | 29/2897 | 94/18723 | 1.32e-04 | 2.66e-03 | 29 |
| GO:00160322 | Colorectum | MSS | viral process | 157/3467 | 415/18723 | 7.94e-21 | 6.19e-18 | 157 |
| GO:00190802 | Colorectum | MSS | viral gene expression | 41/3467 | 94/18723 | 1.74e-08 | 9.85e-07 | 41 |
| GO:00064572 | Colorectum | MSS | protein folding | 71/3467 | 212/18723 | 1.25e-07 | 5.91e-06 | 71 |
| GO:00190821 | Colorectum | MSS | viral protein processing | 17/3467 | 29/18723 | 1.81e-06 | 5.70e-05 | 17 |
| GO:00064871 | Colorectum | MSS | protein N-linked glycosylation | 23/3467 | 65/18723 | 9.47e-04 | 9.54e-03 | 23 |
| GO:00160324 | Colorectum | FAP | viral process | 114/2622 | 415/18723 | 3.00e-13 | 2.63e-10 | 114 |
| GO:00190804 | Colorectum | FAP | viral gene expression | 29/2622 | 94/18723 | 2.07e-05 | 5.05e-04 | 29 |
| GO:00190822 | Colorectum | FAP | viral protein processing | 11/2622 | 29/18723 | 1.20e-03 | 1.14e-02 | 11 |
| GO:00064861 | Colorectum | FAP | protein glycosylation | 48/2622 | 226/18723 | 1.85e-03 | 1.57e-02 | 48 |
| Page: 1 2 3 4 5 |
| Pathway ID | Tissue | Disease Stage | Description | Gene Ratio | Bg Ratio | pvalue | p.adjust | qvalue | Count |
| hsa04141 | Colorectum | AD | Protein processing in endoplasmic reticulum | 80/2092 | 174/8465 | 5.96e-10 | 1.25e-08 | 7.96e-09 | 80 |
| hsa00510 | Colorectum | AD | N-Glycan biosynthesis | 21/2092 | 53/8465 | 1.15e-02 | 4.24e-02 | 2.71e-02 | 21 |
| hsa041411 | Colorectum | AD | Protein processing in endoplasmic reticulum | 80/2092 | 174/8465 | 5.96e-10 | 1.25e-08 | 7.96e-09 | 80 |
| hsa005101 | Colorectum | AD | N-Glycan biosynthesis | 21/2092 | 53/8465 | 1.15e-02 | 4.24e-02 | 2.71e-02 | 21 |
| hsa041412 | Colorectum | SER | Protein processing in endoplasmic reticulum | 60/1580 | 174/8465 | 4.20e-07 | 7.33e-06 | 5.32e-06 | 60 |
| hsa041413 | Colorectum | SER | Protein processing in endoplasmic reticulum | 60/1580 | 174/8465 | 4.20e-07 | 7.33e-06 | 5.32e-06 | 60 |
| hsa041414 | Colorectum | MSS | Protein processing in endoplasmic reticulum | 75/1875 | 174/8465 | 3.78e-10 | 8.44e-09 | 5.17e-09 | 75 |
| hsa005102 | Colorectum | MSS | N-Glycan biosynthesis | 20/1875 | 53/8465 | 7.17e-03 | 2.83e-02 | 1.73e-02 | 20 |
| hsa041415 | Colorectum | MSS | Protein processing in endoplasmic reticulum | 75/1875 | 174/8465 | 3.78e-10 | 8.44e-09 | 5.17e-09 | 75 |
| hsa005103 | Colorectum | MSS | N-Glycan biosynthesis | 20/1875 | 53/8465 | 7.17e-03 | 2.83e-02 | 1.73e-02 | 20 |
| hsa041418 | Colorectum | FAP | Protein processing in endoplasmic reticulum | 50/1404 | 174/8465 | 3.64e-05 | 3.68e-04 | 2.24e-04 | 50 |
| hsa041419 | Colorectum | FAP | Protein processing in endoplasmic reticulum | 50/1404 | 174/8465 | 3.64e-05 | 3.68e-04 | 2.24e-04 | 50 |
| hsa04141211 | Esophagus | ESCC | Protein processing in endoplasmic reticulum | 147/4205 | 174/8465 | 3.29e-22 | 1.10e-19 | 5.64e-20 | 147 |
| hsa0051023 | Esophagus | ESCC | N-Glycan biosynthesis | 39/4205 | 53/8465 | 3.26e-04 | 1.15e-03 | 5.89e-04 | 39 |
| hsa04141310 | Esophagus | ESCC | Protein processing in endoplasmic reticulum | 147/4205 | 174/8465 | 3.29e-22 | 1.10e-19 | 5.64e-20 | 147 |
| hsa0051033 | Esophagus | ESCC | N-Glycan biosynthesis | 39/4205 | 53/8465 | 3.26e-04 | 1.15e-03 | 5.89e-04 | 39 |
| hsa0414114 | Liver | Cirrhotic | Protein processing in endoplasmic reticulum | 114/2530 | 174/8465 | 1.16e-22 | 9.67e-21 | 5.96e-21 | 114 |
| hsa005104 | Liver | Cirrhotic | N-Glycan biosynthesis | 32/2530 | 53/8465 | 3.82e-06 | 4.10e-05 | 2.53e-05 | 32 |
| hsa0414115 | Liver | Cirrhotic | Protein processing in endoplasmic reticulum | 114/2530 | 174/8465 | 1.16e-22 | 9.67e-21 | 5.96e-21 | 114 |
| hsa0051011 | Liver | Cirrhotic | N-Glycan biosynthesis | 32/2530 | 53/8465 | 3.82e-06 | 4.10e-05 | 2.53e-05 | 32 |
| Page: 1 2 |
Top |
Cell-cell communication analysis |
| Identification of potential cell-cell interactions between two cell types and their ligand-receptor pairs for different disease states |
| Ligand | Receptor | LRpair | Pathway | Tissue | Disease Stage |
| Page: 1 |
Top |
Single-cell gene regulatory network inference analysis |
| Find out the significant the regulons (TFs) and the target genes of each regulon across cell types for different disease states |
| TF | Cell Type | Tissue | Disease Stage | Target Gene | RSS | Regulon Activity |
| ∗The dot plots of a searched regulon are shown for all cell subpopulations in each disease state of each tissue based on the regulon specific score inferred using pySCENIC and by calculating the average expression. |
| Page: 1 |
Top |
Somatic mutation of malignant transformation related genes |
| Annotation of somatic variants for genes involved in malignant transformation |
| Hugo Symbol | Variant Class | Variant Classification | dbSNP RS | HGVSc | HGVSp | HGVSp Short | SWISSPROT | BIOTYPE | SIFT | PolyPhen | Tumor Sample Barcode | Tissue | Histology | Sex | Age | Stage | Therapy Types | Drugs | Outcome |
| MOGS | SNV | Missense_Mutation | c.1750N>A | p.Asp584Asn | p.D584N | Q13724 | protein_coding | deleterious(0) | probably_damaging(0.999) | TCGA-A2-A0T0-01 | Breast | breast invasive carcinoma | Female | <65 | I/II | Chemotherapy | taxotere | SD | |
| MOGS | SNV | Missense_Mutation | c.2008C>G | p.Gln670Glu | p.Q670E | Q13724 | protein_coding | tolerated(1) | benign(0.014) | TCGA-AR-A0TX-01 | Breast | breast invasive carcinoma | Female | <65 | I/II | Unknown | Unknown | SD | |
| MOGS | SNV | Missense_Mutation | c.1037N>G | p.Asn346Ser | p.N346S | Q13724 | protein_coding | tolerated(0.49) | benign(0.001) | TCGA-AR-A1AL-01 | Breast | breast invasive carcinoma | Female | <65 | III/IV | Hormone Therapy | anastrozole | SD | |
| MOGS | insertion | Nonsense_Mutation | novel | c.2295_2296insTCTCTTTAATGAGATCAAAGG | p.Ala765_Leu766insSerLeuTerTerAspGlnArg | p.A765_L766insSL**DQR | Q13724 | protein_coding | TCGA-A8-A08X-01 | Breast | breast invasive carcinoma | Female | <65 | III/IV | Chemotherapy | doxorubicin | PD | ||
| MOGS | insertion | Nonsense_Mutation | novel | c.2246_2247insAATAAATTGGAAAAAACATTTTGAACTCTATTGCTTTTGC | p.Tyr749Ter | p.Y749* | Q13724 | protein_coding | TCGA-A8-A091-01 | Breast | breast invasive carcinoma | Female | <65 | I/II | Chemotherapy | 5-fluorouracil | PD | ||
| MOGS | insertion | In_Frame_Ins | novel | c.476_477insGCTACTCGGGAGGCTGAGGCAGGAGAATGGCGTGAACCTGGG | p.Gln159_His160insLeuLeuGlyArgLeuArgGlnGluAsnGlyValAsnLeuGly | p.Q159_H160insLLGRLRQENGVNLG | Q13724 | protein_coding | TCGA-AR-A0TY-01 | Breast | breast invasive carcinoma | Female | <65 | I/II | Unspecific | Paclitaxel | PD | ||
| MOGS | insertion | Frame_Shift_Ins | novel | c.1390_1391insGAAAG | p.Pro464ArgfsTer17 | p.P464Rfs*17 | Q13724 | protein_coding | TCGA-BH-A0E2-01 | Breast | breast invasive carcinoma | Female | <65 | III/IV | Chemotherapy | doxorubicin | SD | ||
| MOGS | insertion | Nonsense_Mutation | novel | c.1389_1390insGCTAGAGGTTGGTGACCCTGACGACTTGGCTTTCCTC | p.Pro464AlafsTer5 | p.P464Afs*5 | Q13724 | protein_coding | TCGA-BH-A0E2-01 | Breast | breast invasive carcinoma | Female | <65 | III/IV | Chemotherapy | doxorubicin | SD | ||
| MOGS | SNV | Missense_Mutation | rs748805392 | c.2251C>T | p.Arg751Trp | p.R751W | Q13724 | protein_coding | deleterious(0) | probably_damaging(1) | TCGA-2W-A8YY-01 | Cervix | cervical & endocervical cancer | Female | <65 | I/II | Chemotherapy | cisplatin | CR |
| MOGS | SNV | Missense_Mutation | rs760636403 | c.2020C>T | p.Arg674Trp | p.R674W | Q13724 | protein_coding | deleterious(0) | probably_damaging(1) | TCGA-2W-A8YY-01 | Cervix | cervical & endocervical cancer | Female | <65 | I/II | Chemotherapy | cisplatin | CR |
| Page: 1 2 3 4 5 6 7 8 9 10 |
Top |
Related drugs of malignant transformation related genes |
| Identification of chemicals and drugs interact with genes involved in malignant transfromation |
| (DGIdb 4.0) |
| Entrez ID | Symbol | Category | Interaction Types | Drug Claim Name | Drug Name | PMIDs |
| Page: 1 |

Copyright 2023-Present -The University of Texas Health Science Center at Houston |