
|
|||||
|
 | |
| |
| |
| |
| |
| |
|
Gene: MOGAT2 |
Gene summary for MOGAT2 |
| Gene information | Species | Human | Gene symbol | MOGAT2 | Gene ID | 80168 |
| Gene name | monoacylglycerol O-acyltransferase 2 | |
| Gene Alias | DGAT2L5 | |
| Cytomap | 11q13.5 | |
| Gene Type | protein-coding | GO ID | GO:0003008 | UniProtAcc | Q3SYC2 |
Top |
Malignant transformation analysis |
| Identification of the aberrant gene expression in precancerous and cancerous lesions by comparing the gene expression of stem-like cells in diseased tissues with normal stem cells |
| Entrez ID | Symbol | Replicates | Species | Organ | Tissue | Adj P-value | Log2FC | Malignancy |
| 80168 | MOGAT2 | HTA11_2487_2000001011 | Human | Colorectum | SER | 2.52e-13 | 7.35e-01 | -0.1808 |
| 80168 | MOGAT2 | HTA11_1938_2000001011 | Human | Colorectum | AD | 3.52e-03 | 3.84e-01 | -0.0811 |
| 80168 | MOGAT2 | HTA11_347_2000001011 | Human | Colorectum | AD | 2.58e-27 | 7.77e-01 | -0.1954 |
| 80168 | MOGAT2 | HTA11_3361_2000001011 | Human | Colorectum | AD | 1.16e-04 | 4.03e-01 | -0.1207 |
| 80168 | MOGAT2 | HTA11_696_2000001011 | Human | Colorectum | AD | 3.70e-17 | 5.79e-01 | -0.1464 |
| 80168 | MOGAT2 | HTA11_866_2000001011 | Human | Colorectum | AD | 1.28e-03 | 3.25e-01 | -0.1001 |
| 80168 | MOGAT2 | HTA11_1391_2000001011 | Human | Colorectum | AD | 3.45e-07 | 3.58e-01 | -0.059 |
| 80168 | MOGAT2 | HTA11_546_2000001011 | Human | Colorectum | AD | 2.11e-02 | 3.58e-01 | -0.0842 |
| 80168 | MOGAT2 | HTA11_7862_2000001011 | Human | Colorectum | AD | 2.49e-02 | 3.81e-01 | -0.0179 |
| 80168 | MOGAT2 | HTA11_99999974143_84620 | Human | Colorectum | MSS | 2.00e-02 | -1.43e-01 | 0.3005 |
| 80168 | MOGAT2 | CRC-1-8810 | Human | Colorectum | CRC | 5.12e-03 | -1.57e-01 | 0.6257 |
| 80168 | MOGAT2 | CRC-3-11773 | Human | Colorectum | CRC | 1.80e-03 | -1.52e-01 | 0.2564 |
| 80168 | MOGAT2 | Pat01-B | Human | Stomach | GC | 4.54e-31 | 5.64e-01 | 0.5754 |
| 80168 | MOGAT2 | Pat03-B | Human | Stomach | GC | 7.07e-17 | 3.59e-01 | 0.3693 |
| Page: 1 |
| Tissue | Expression Dynamics | Abbreviation |
| Colorectum (GSE201348) |  | FAP: Familial adenomatous polyposis |
| CRC: Colorectal cancer | ||
| Colorectum (HTA11) | 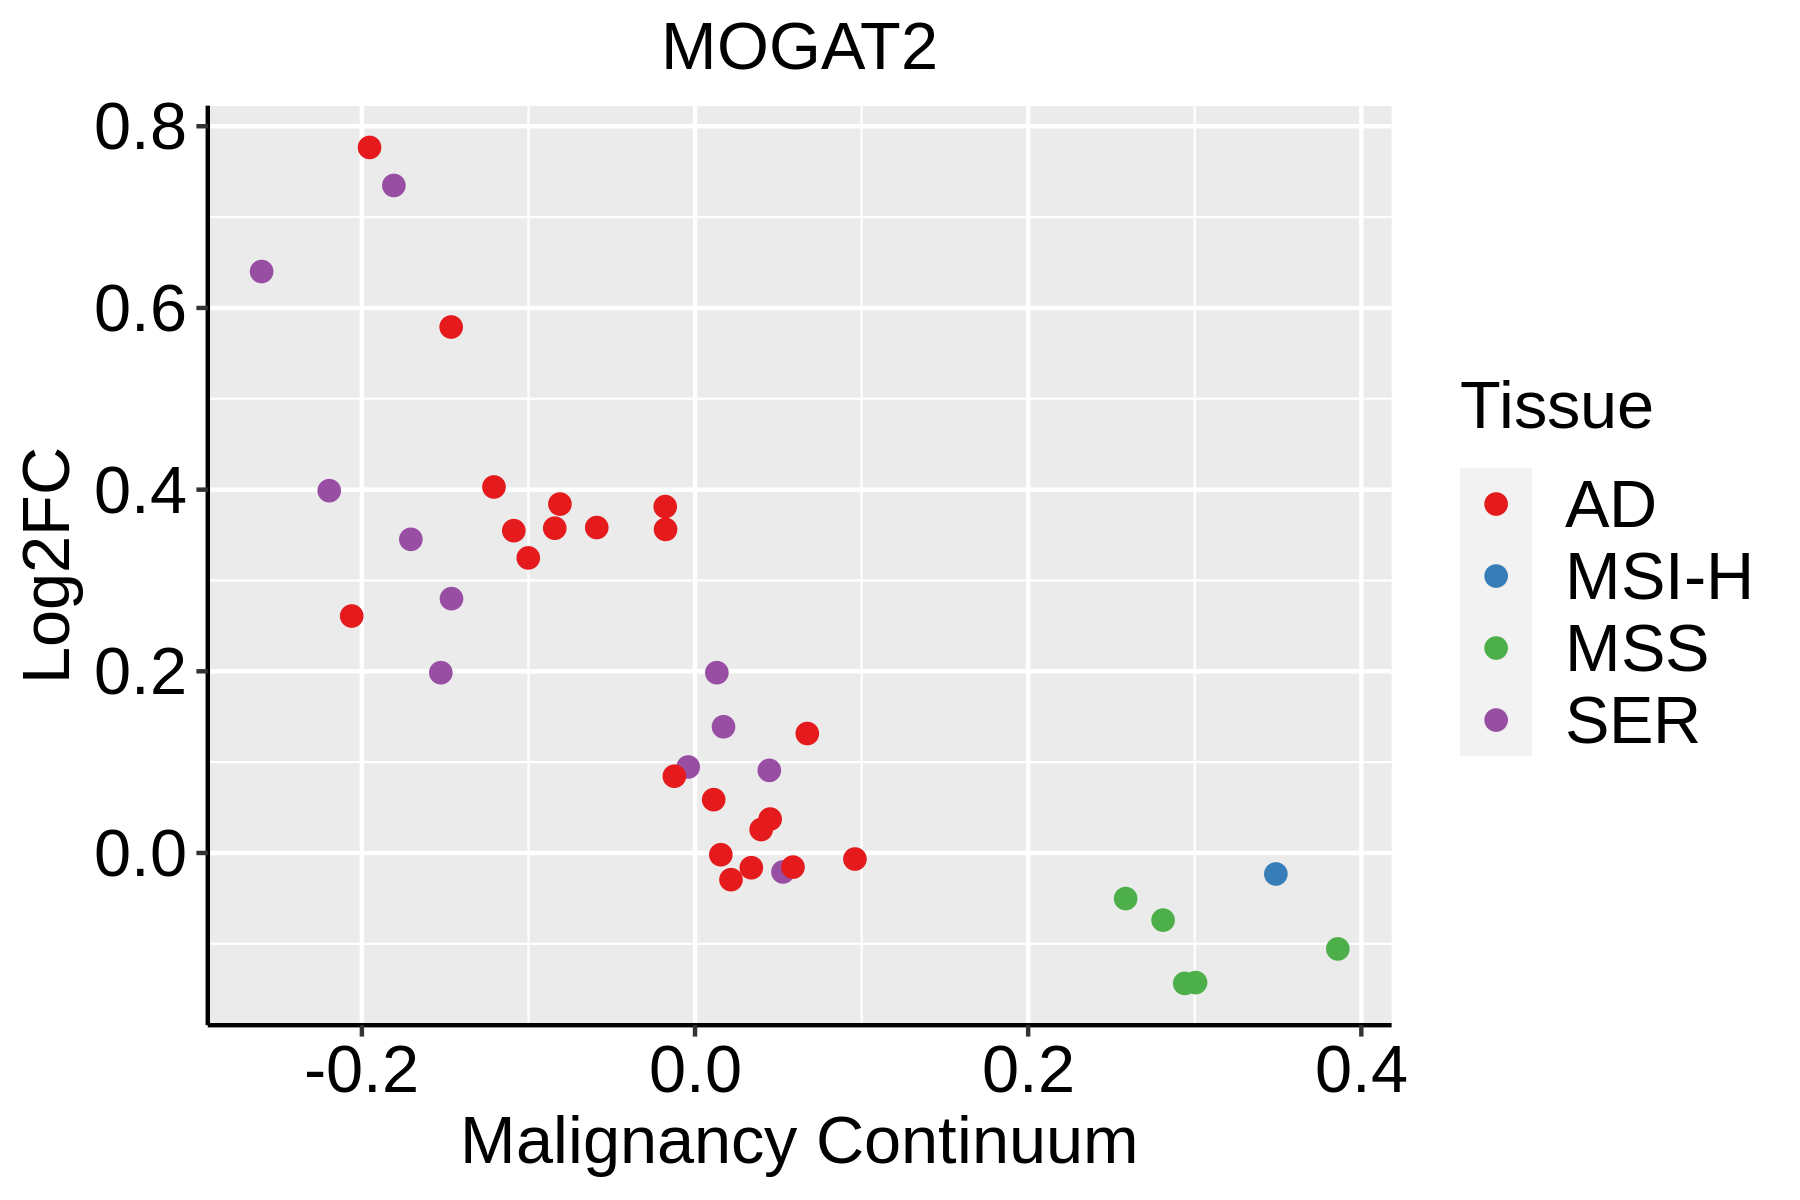 | AD: Adenomas |
| SER: Sessile serrated lesions | ||
| MSI-H: Microsatellite-high colorectal cancer | ||
| MSS: Microsatellite stable colorectal cancer | ||
| GC | 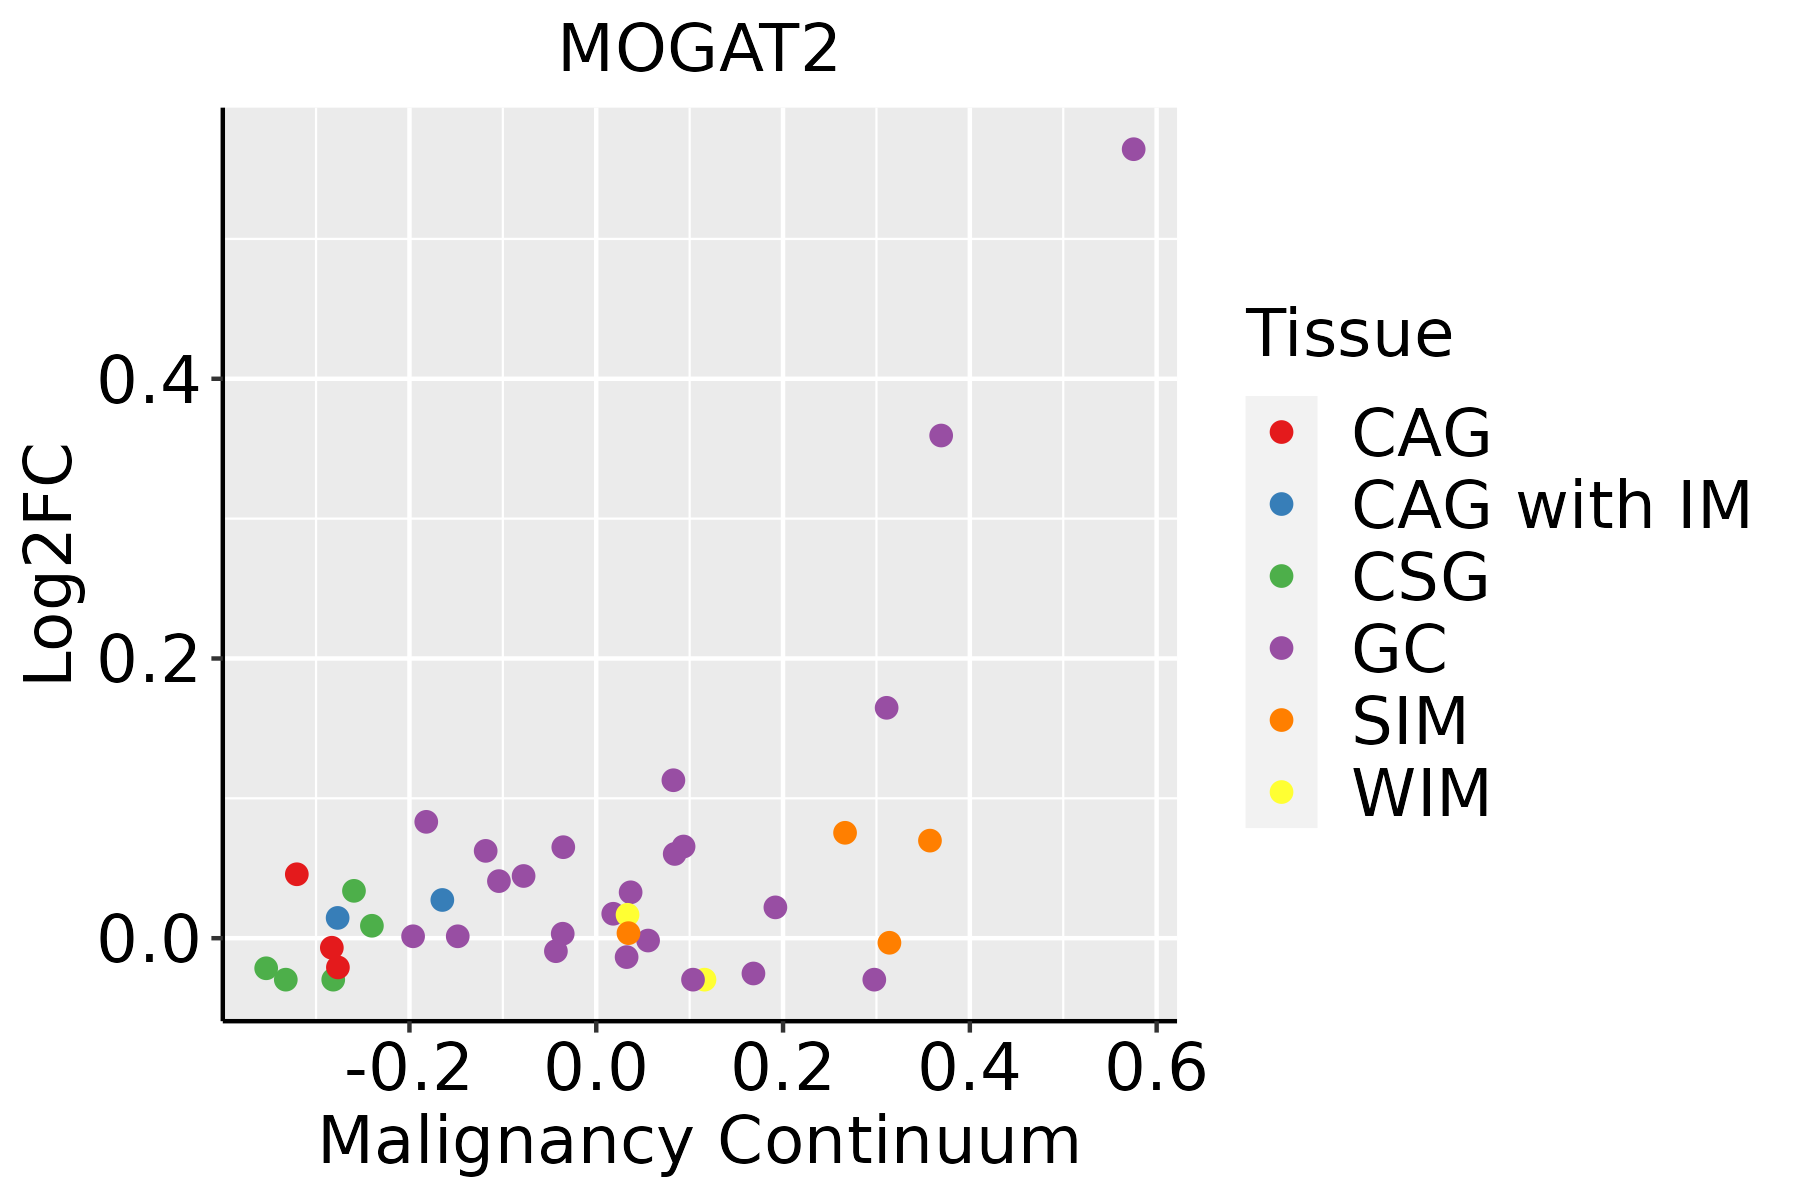 | CAG: Chronic atrophic gastritis |
| CAG with IM: Chronic atrophic gastritis with intestinal metaplasia | ||
| CSG: Chronic superficial gastritis | ||
| GC: Gastric cancer | ||
| SIM: Severe intestinal metaplasia | ||
| WIM: Wild intestinal metaplasia |
| ∗log2FC in expression of this searched gene in stem-like cells from each diseased tissue sample relative to stem-like cells in normal samples in each tissue plotted against the malignancy continuum. Samples are colored based on if they are from different disease stage. |
Top |
Malignant transformation related pathway analysis |
| Find out the enriched GO biological processes and KEGG pathways involved in transition from healthy to precancer to cancer |
| Tissue | Disease Stage | Enriched GO biological Processes |
| Colorectum | AD |  |
| Colorectum | SER |  |
| Colorectum | MSS |  |
| Colorectum | MSI-H |  |
| Colorectum | FAP |  |
| ∗Top 15 enriched GO BP terms are showed in the bar plot of each disease state in each tissue. Each row represents a significant GO biological process which is colored according to the -log10(p.adjust). |
| Page: 1 2 3 4 5 6 7 8 9 |
| GO ID | Tissue | Disease Stage | Description | Gene Ratio | Bg Ratio | pvalue | p.adjust | Count |
| GO:0006066 | Colorectum | AD | alcohol metabolic process | 106/3918 | 353/18723 | 3.02e-05 | 5.57e-04 | 106 |
| GO:0044262 | Colorectum | AD | cellular carbohydrate metabolic process | 87/3918 | 283/18723 | 6.00e-05 | 1.01e-03 | 87 |
| GO:0045017 | Colorectum | AD | glycerolipid biosynthetic process | 69/3918 | 252/18723 | 8.33e-03 | 4.88e-02 | 69 |
| GO:00060661 | Colorectum | SER | alcohol metabolic process | 79/2897 | 353/18723 | 3.50e-04 | 5.50e-03 | 79 |
| GO:0022600 | Colorectum | SER | digestive system process | 29/2897 | 104/18723 | 8.57e-04 | 1.05e-02 | 29 |
| GO:0046486 | Colorectum | SER | glycerolipid metabolic process | 82/2897 | 392/18723 | 2.26e-03 | 2.17e-02 | 82 |
| GO:0050892 | Colorectum | SER | intestinal absorption | 14/2897 | 41/18723 | 2.45e-03 | 2.32e-02 | 14 |
| GO:00450171 | Colorectum | SER | glycerolipid biosynthetic process | 55/2897 | 252/18723 | 4.47e-03 | 3.56e-02 | 55 |
| GO:00060662 | Colorectum | MSS | alcohol metabolic process | 92/3467 | 353/18723 | 2.57e-04 | 3.46e-03 | 92 |
| GO:00508921 | Colorectum | MSS | intestinal absorption | 17/3467 | 41/18723 | 5.48e-04 | 6.10e-03 | 17 |
| GO:00226001 | Colorectum | MSS | digestive system process | 31/3467 | 104/18723 | 3.46e-03 | 2.59e-02 | 31 |
| GO:00450173 | Colorectum | CRC | glycerolipid biosynthetic process | 47/2078 | 252/18723 | 2.47e-04 | 4.06e-03 | 47 |
| GO:00508923 | Colorectum | CRC | intestinal absorption | 13/2078 | 41/18723 | 3.29e-04 | 5.04e-03 | 13 |
| GO:00464861 | Colorectum | CRC | glycerolipid metabolic process | 64/2078 | 392/18723 | 1.01e-03 | 1.19e-02 | 64 |
| GO:00442622 | Colorectum | CRC | cellular carbohydrate metabolic process | 49/2078 | 283/18723 | 1.06e-03 | 1.24e-02 | 49 |
| GO:00060664 | Colorectum | CRC | alcohol metabolic process | 57/2078 | 353/18723 | 2.37e-03 | 2.27e-02 | 57 |
| GO:00226003 | Colorectum | CRC | digestive system process | 21/2078 | 104/18723 | 4.67e-03 | 3.62e-02 | 21 |
| GO:0019751 | Colorectum | CRC | polyol metabolic process | 22/2078 | 114/18723 | 6.73e-03 | 4.77e-02 | 22 |
| GO:0007586 | Stomach | GC | digestion | 38/1159 | 137/18723 | 1.80e-15 | 1.22e-12 | 38 |
| GO:00226006 | Stomach | GC | digestive system process | 30/1159 | 104/18723 | 5.40e-13 | 2.10e-10 | 30 |
| Page: 1 2 |
| Pathway ID | Tissue | Disease Stage | Description | Gene Ratio | Bg Ratio | pvalue | p.adjust | qvalue | Count |
| hsa00561 | Colorectum | AD | Glycerolipid metabolism | 24/2092 | 63/8465 | 1.25e-02 | 4.54e-02 | 2.90e-02 | 24 |
| hsa005611 | Colorectum | AD | Glycerolipid metabolism | 24/2092 | 63/8465 | 1.25e-02 | 4.54e-02 | 2.90e-02 | 24 |
| hsa005612 | Colorectum | MSS | Glycerolipid metabolism | 23/1875 | 63/8465 | 6.55e-03 | 2.64e-02 | 1.62e-02 | 23 |
| hsa005613 | Colorectum | MSS | Glycerolipid metabolism | 23/1875 | 63/8465 | 6.55e-03 | 2.64e-02 | 1.62e-02 | 23 |
| hsa04975 | Stomach | GC | Fat digestion and absorption | 14/708 | 43/8465 | 5.71e-06 | 8.30e-05 | 5.84e-05 | 14 |
| hsa005614 | Stomach | GC | Glycerolipid metabolism | 12/708 | 63/8465 | 5.36e-03 | 3.01e-02 | 2.12e-02 | 12 |
| hsa049751 | Stomach | GC | Fat digestion and absorption | 14/708 | 43/8465 | 5.71e-06 | 8.30e-05 | 5.84e-05 | 14 |
| hsa0056111 | Stomach | GC | Glycerolipid metabolism | 12/708 | 63/8465 | 5.36e-03 | 3.01e-02 | 2.12e-02 | 12 |
| Page: 1 |
Top |
Cell-cell communication analysis |
| Identification of potential cell-cell interactions between two cell types and their ligand-receptor pairs for different disease states |
| Ligand | Receptor | LRpair | Pathway | Tissue | Disease Stage |
| Page: 1 |
Top |
Single-cell gene regulatory network inference analysis |
| Find out the significant the regulons (TFs) and the target genes of each regulon across cell types for different disease states |
| TF | Cell Type | Tissue | Disease Stage | Target Gene | RSS | Regulon Activity |
| ∗The dot plots of a searched regulon are shown for all cell subpopulations in each disease state of each tissue based on the regulon specific score inferred using pySCENIC and by calculating the average expression. |
| Page: 1 |
Top |
Somatic mutation of malignant transformation related genes |
| Annotation of somatic variants for genes involved in malignant transformation |
| Hugo Symbol | Variant Class | Variant Classification | dbSNP RS | HGVSc | HGVSp | HGVSp Short | SWISSPROT | BIOTYPE | SIFT | PolyPhen | Tumor Sample Barcode | Tissue | Histology | Sex | Age | Stage | Therapy Types | Drugs | Outcome |
| MOGAT2 | SNV | Missense_Mutation | novel | c.768N>G | p.Ile256Met | p.I256M | Q3SYC2 | protein_coding | deleterious(0.01) | possibly_damaging(0.774) | TCGA-JW-A5VL-01 | Cervix | cervical & endocervical cancer | Female | <65 | I/II | Unknown | Unknown | SD |
| MOGAT2 | SNV | Missense_Mutation | rs754525542 | c.790N>T | p.Arg264Cys | p.R264C | Q3SYC2 | protein_coding | deleterious(0.05) | probably_damaging(0.997) | TCGA-CA-6715-01 | Colorectum | colon adenocarcinoma | Male | <65 | III/IV | Chemotherapy | oxaliplatin | CR |
| MOGAT2 | SNV | Missense_Mutation | rs781112029 | c.161N>T | p.Ala54Val | p.A54V | Q3SYC2 | protein_coding | tolerated(0.52) | benign(0.053) | TCGA-CM-4752-01 | Colorectum | colon adenocarcinoma | Male | <65 | I/II | Unknown | Unknown | SD |
| MOGAT2 | SNV | Missense_Mutation | rs554620597 | c.637G>A | p.Ala213Thr | p.A213T | Q3SYC2 | protein_coding | deleterious(0) | probably_damaging(0.998) | TCGA-D5-6530-01 | Colorectum | colon adenocarcinoma | Male | <65 | I/II | Unknown | Unknown | SD |
| MOGAT2 | deletion | Frame_Shift_Del | c.408delN | p.His138IlefsTer2 | p.H138Ifs*2 | Q3SYC2 | protein_coding | TCGA-AZ-4313-01 | Colorectum | colon adenocarcinoma | Female | <65 | I/II | Unknown | Unknown | SD | |||
| MOGAT2 | SNV | Missense_Mutation | novel | c.596N>C | p.Phe199Ser | p.F199S | Q3SYC2 | protein_coding | tolerated(0.26) | benign(0.038) | TCGA-A5-A0GP-01 | Endometrium | uterine corpus endometrioid carcinoma | Female | <65 | I/II | Unknown | Unknown | SD |
| MOGAT2 | SNV | Missense_Mutation | rs771070357 | c.649N>A | p.Gly217Arg | p.G217R | Q3SYC2 | protein_coding | deleterious(0.02) | probably_damaging(0.999) | TCGA-A5-A2K3-01 | Endometrium | uterine corpus endometrioid carcinoma | Female | >=65 | I/II | Chemotherapy | carboplatin | SD |
| MOGAT2 | SNV | Missense_Mutation | novel | c.965N>C | p.Lys322Thr | p.K322T | Q3SYC2 | protein_coding | deleterious(0.02) | possibly_damaging(0.596) | TCGA-AJ-A3BK-01 | Endometrium | uterine corpus endometrioid carcinoma | Female | >=65 | I/II | Unknown | Unknown | SD |
| MOGAT2 | SNV | Missense_Mutation | novel | c.584G>T | p.Arg195Met | p.R195M | Q3SYC2 | protein_coding | tolerated(0.11) | probably_damaging(0.95) | TCGA-AJ-A3OK-01 | Endometrium | uterine corpus endometrioid carcinoma | Female | >=65 | I/II | Chemotherapy | carboplatin | CR |
| MOGAT2 | SNV | Missense_Mutation | rs370837360 | c.830G>A | p.Arg277His | p.R277H | Q3SYC2 | protein_coding | deleterious(0.02) | probably_damaging(0.997) | TCGA-AP-A0LM-01 | Endometrium | uterine corpus endometrioid carcinoma | Female | <65 | III/IV | Chemotherapy | cisplatin | SD |
| Page: 1 2 3 4 |
Top |
Related drugs of malignant transformation related genes |
| Identification of chemicals and drugs interact with genes involved in malignant transfromation |
| (DGIdb 4.0) |
| Entrez ID | Symbol | Category | Interaction Types | Drug Claim Name | Drug Name | PMIDs |
| Page: 1 |

Copyright 2023-Present -The University of Texas Health Science Center at Houston |