
|
|||||
|
 | |
| |
| |
| |
| |
| |
|
Gene: MOCS2 |
Gene summary for MOCS2 |
| Gene information | Species | Human | Gene symbol | MOCS2 | Gene ID | 4338 |
| Gene name | molybdenum cofactor synthesis 2 | |
| Gene Alias | MCBPE | |
| Cytomap | 5q11.2 | |
| Gene Type | protein-coding | GO ID | GO:0006777 | UniProtAcc | A0A024QZS1 |
Top |
Malignant transformation analysis |
| Identification of the aberrant gene expression in precancerous and cancerous lesions by comparing the gene expression of stem-like cells in diseased tissues with normal stem cells |
| Entrez ID | Symbol | Replicates | Species | Organ | Tissue | Adj P-value | Log2FC | Malignancy |
| 4338 | MOCS2 | LZE4T | Human | Esophagus | ESCC | 6.22e-13 | 2.55e-01 | 0.0811 |
| 4338 | MOCS2 | LZE8T | Human | Esophagus | ESCC | 6.81e-10 | 1.44e-01 | 0.067 |
| 4338 | MOCS2 | LZE20T | Human | Esophagus | ESCC | 8.49e-04 | 1.29e-01 | 0.0662 |
| 4338 | MOCS2 | LZE24T | Human | Esophagus | ESCC | 8.82e-09 | 3.25e-01 | 0.0596 |
| 4338 | MOCS2 | LZE21T | Human | Esophagus | ESCC | 2.14e-04 | 1.17e-01 | 0.0655 |
| 4338 | MOCS2 | LZE6T | Human | Esophagus | ESCC | 1.18e-06 | 4.14e-01 | 0.0845 |
| 4338 | MOCS2 | P2T-E | Human | Esophagus | ESCC | 3.05e-19 | 3.46e-01 | 0.1177 |
| 4338 | MOCS2 | P4T-E | Human | Esophagus | ESCC | 4.06e-21 | 5.40e-01 | 0.1323 |
| 4338 | MOCS2 | P5T-E | Human | Esophagus | ESCC | 7.21e-14 | 3.85e-01 | 0.1327 |
| 4338 | MOCS2 | P8T-E | Human | Esophagus | ESCC | 2.23e-19 | 3.02e-01 | 0.0889 |
| 4338 | MOCS2 | P9T-E | Human | Esophagus | ESCC | 1.33e-11 | 3.12e-01 | 0.1131 |
| 4338 | MOCS2 | P10T-E | Human | Esophagus | ESCC | 8.20e-26 | 3.81e-01 | 0.116 |
| 4338 | MOCS2 | P11T-E | Human | Esophagus | ESCC | 4.32e-15 | 6.88e-01 | 0.1426 |
| 4338 | MOCS2 | P12T-E | Human | Esophagus | ESCC | 2.05e-34 | 6.15e-01 | 0.1122 |
| 4338 | MOCS2 | P15T-E | Human | Esophagus | ESCC | 6.74e-26 | 4.89e-01 | 0.1149 |
| 4338 | MOCS2 | P16T-E | Human | Esophagus | ESCC | 3.02e-16 | 2.37e-01 | 0.1153 |
| 4338 | MOCS2 | P17T-E | Human | Esophagus | ESCC | 5.58e-09 | 5.44e-01 | 0.1278 |
| 4338 | MOCS2 | P19T-E | Human | Esophagus | ESCC | 3.08e-03 | 4.82e-01 | 0.1662 |
| 4338 | MOCS2 | P20T-E | Human | Esophagus | ESCC | 1.99e-24 | 2.79e-01 | 0.1124 |
| 4338 | MOCS2 | P21T-E | Human | Esophagus | ESCC | 5.71e-32 | 6.99e-01 | 0.1617 |
| Page: 1 2 3 4 5 6 |
| Tissue | Expression Dynamics | Abbreviation |
| Esophagus | 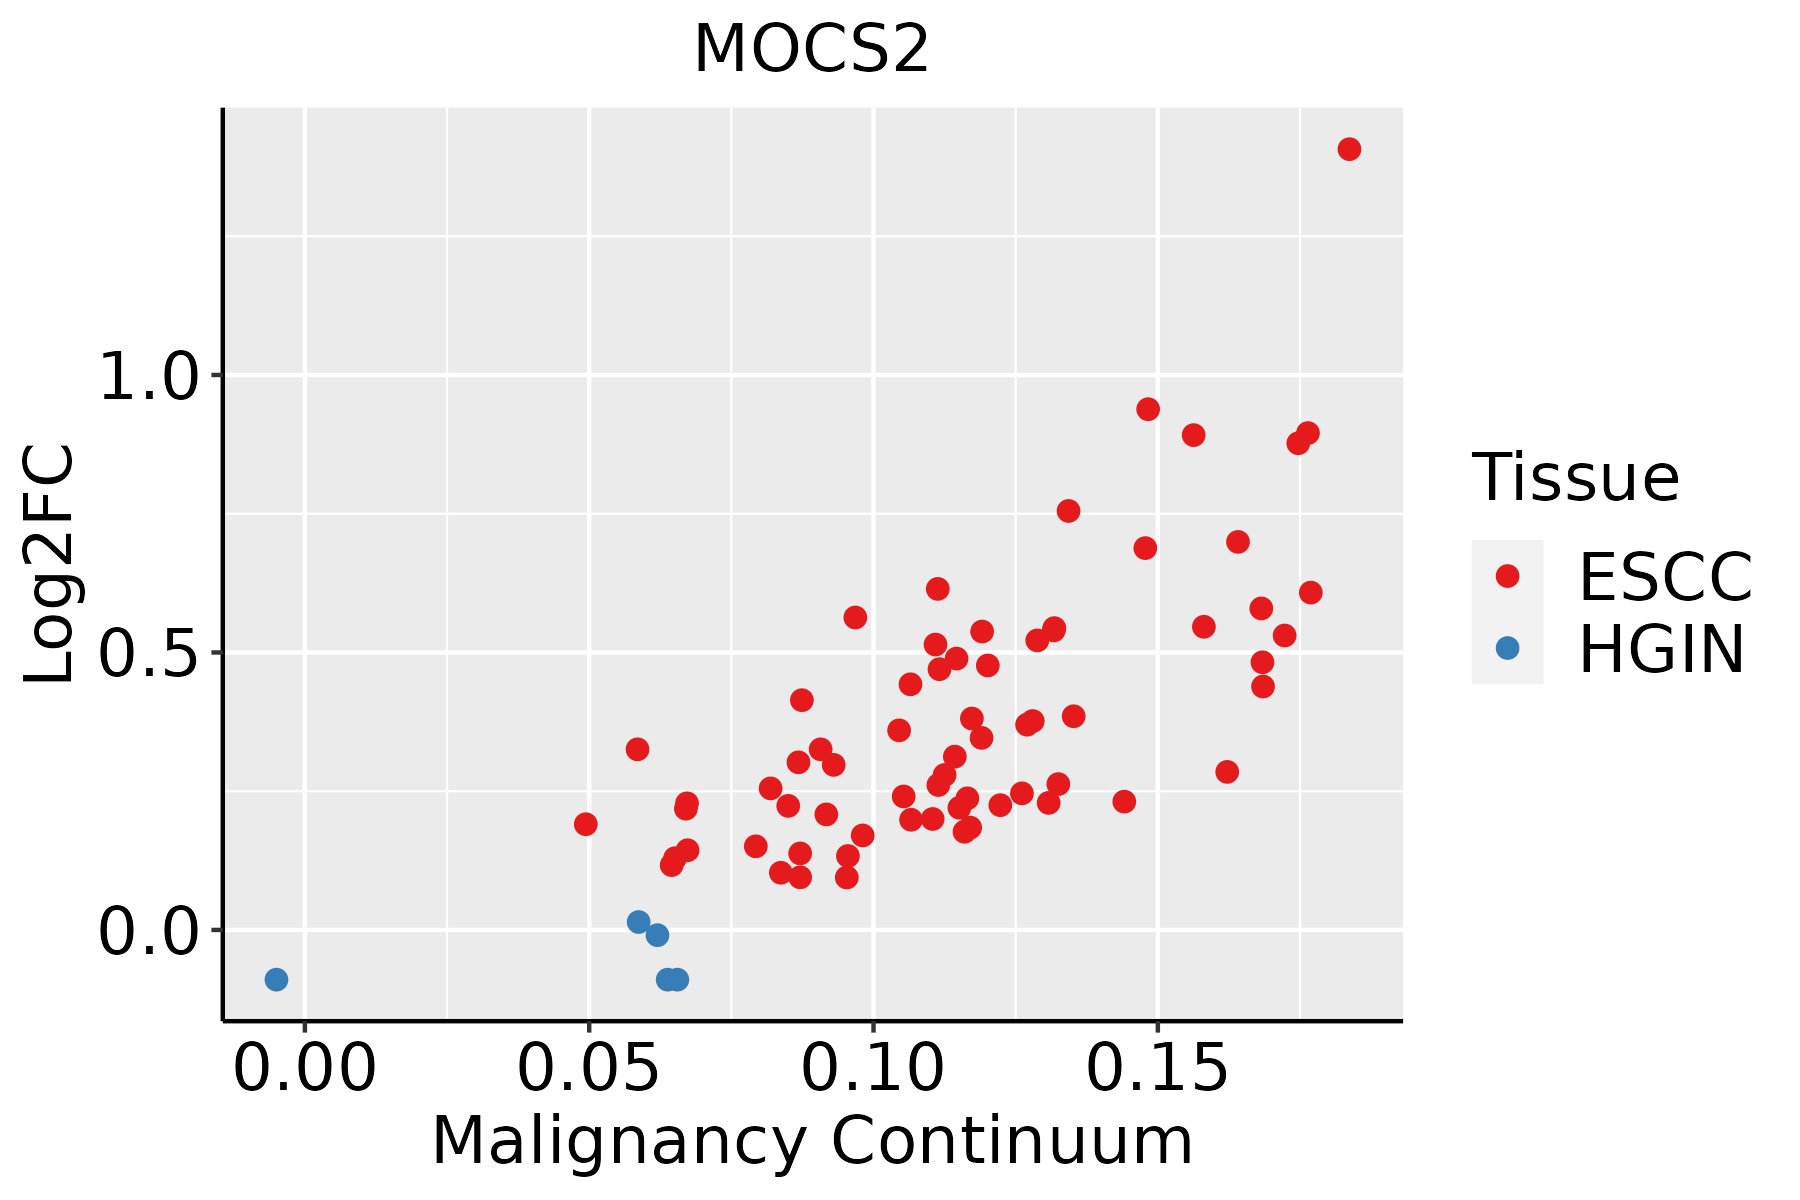 | ESCC: Esophageal squamous cell carcinoma |
| HGIN: High-grade intraepithelial neoplasias | ||
| LGIN: Low-grade intraepithelial neoplasias | ||
| Liver | 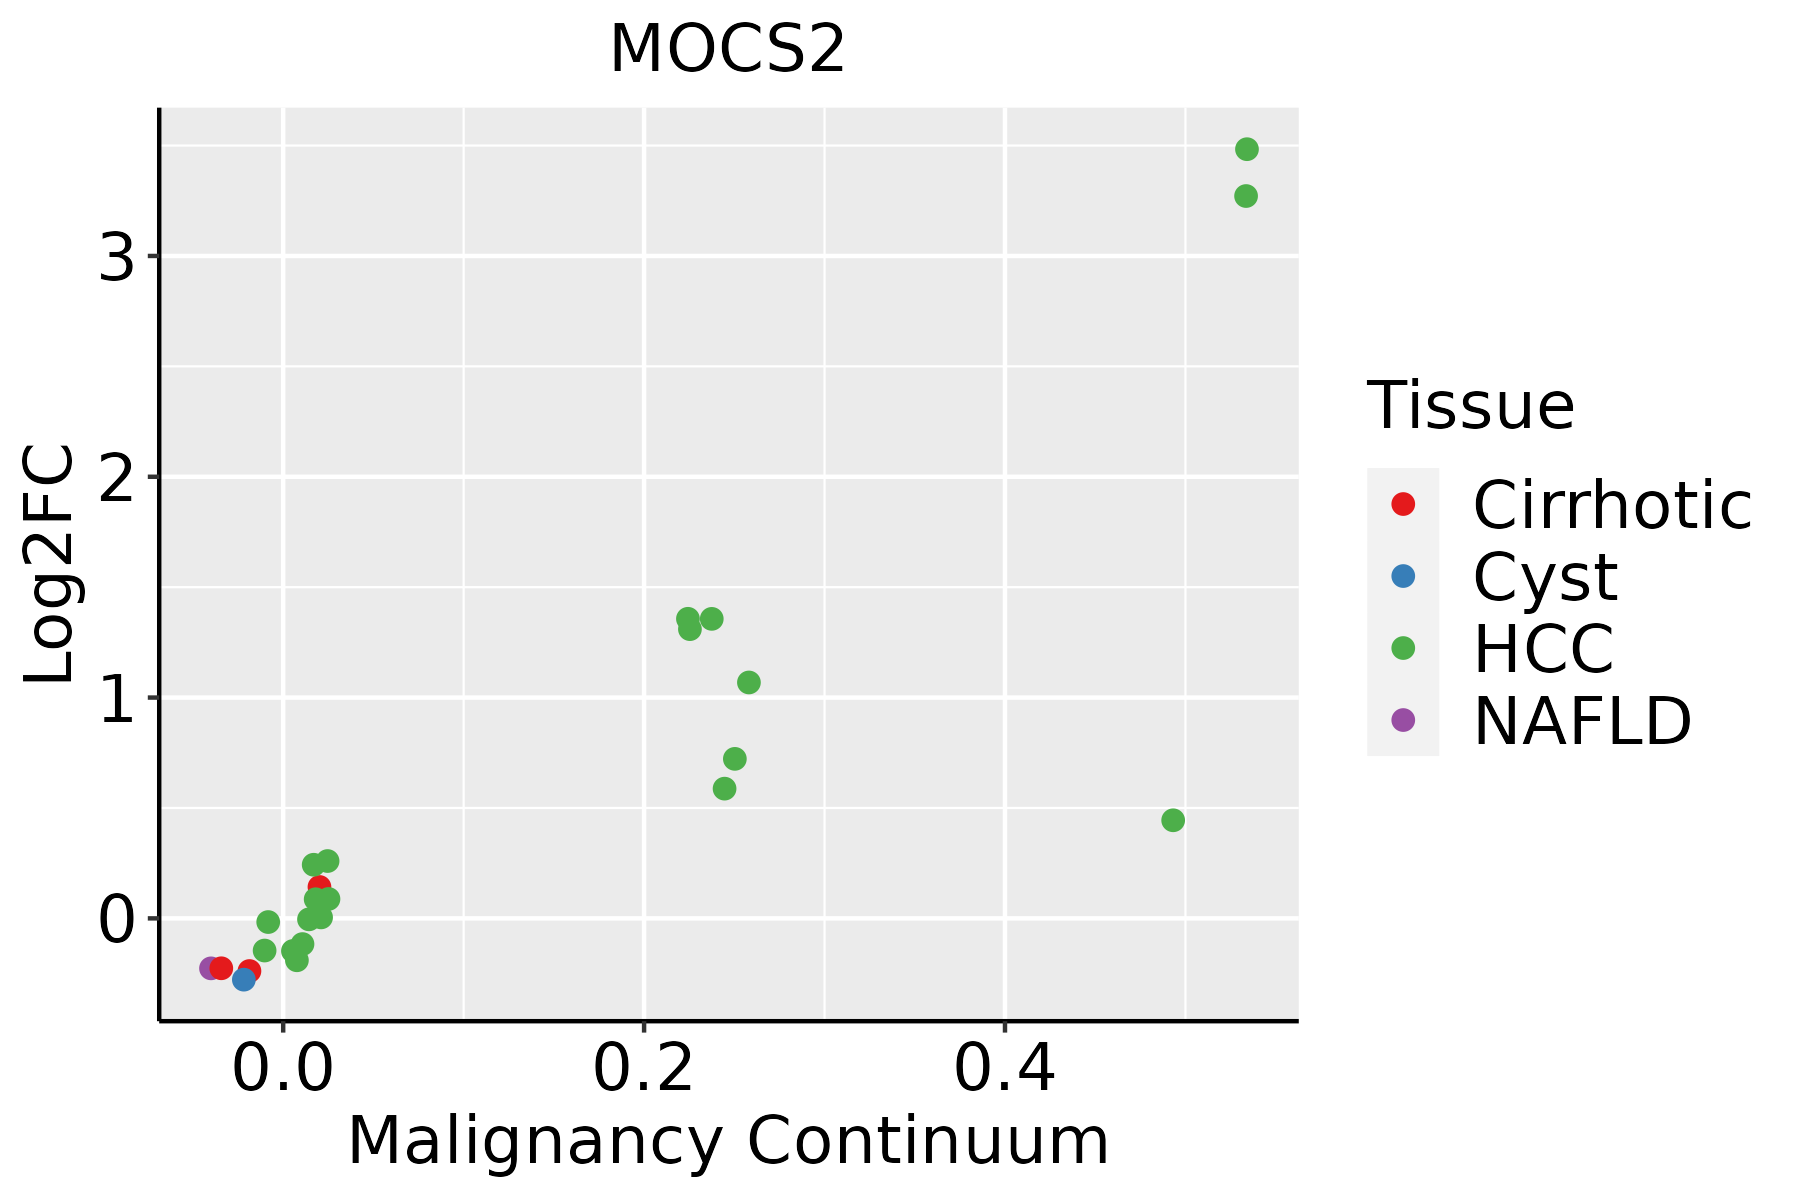 | HCC: Hepatocellular carcinoma |
| NAFLD: Non-alcoholic fatty liver disease | ||
| Oral Cavity | 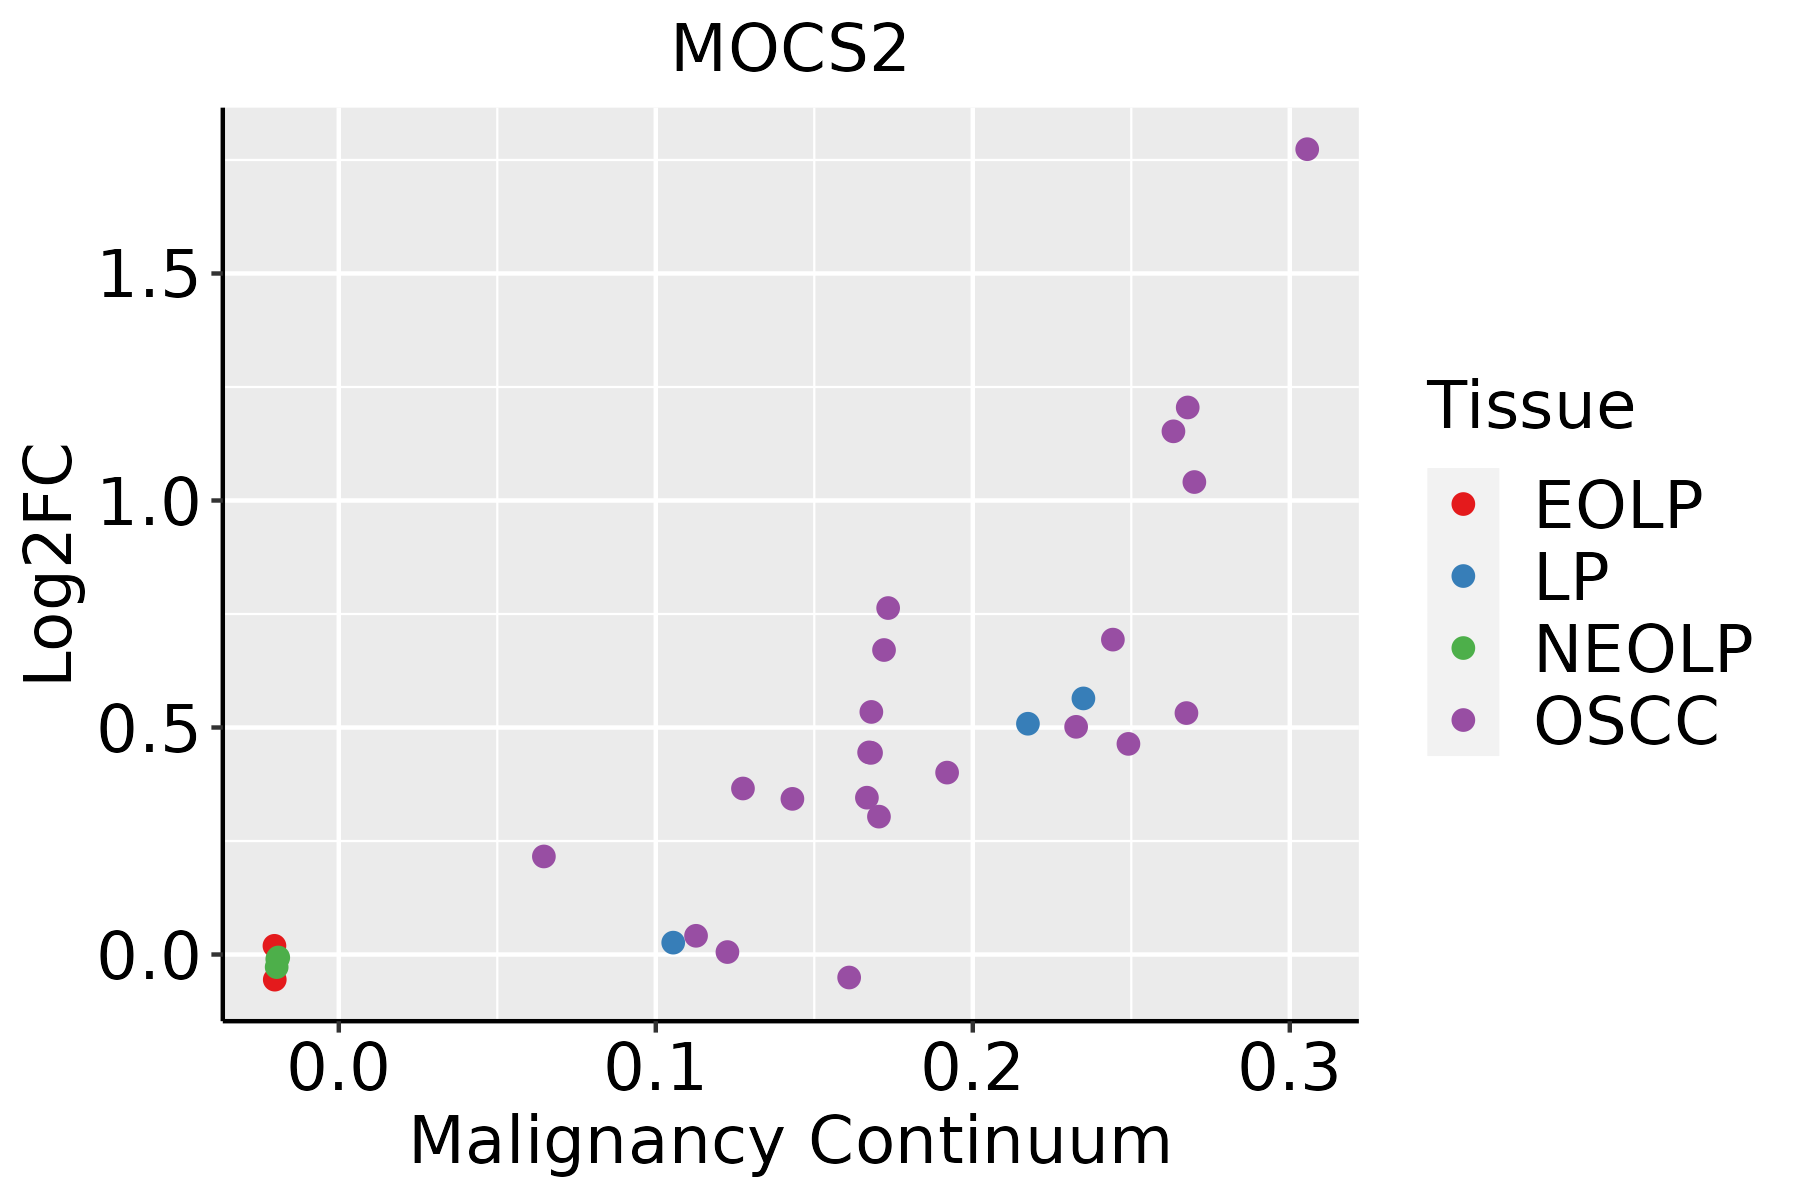 | EOLP: Erosive Oral lichen planus |
| LP: leukoplakia | ||
| NEOLP: Non-erosive oral lichen planus | ||
| OSCC: Oral squamous cell carcinoma | ||
| Skin | 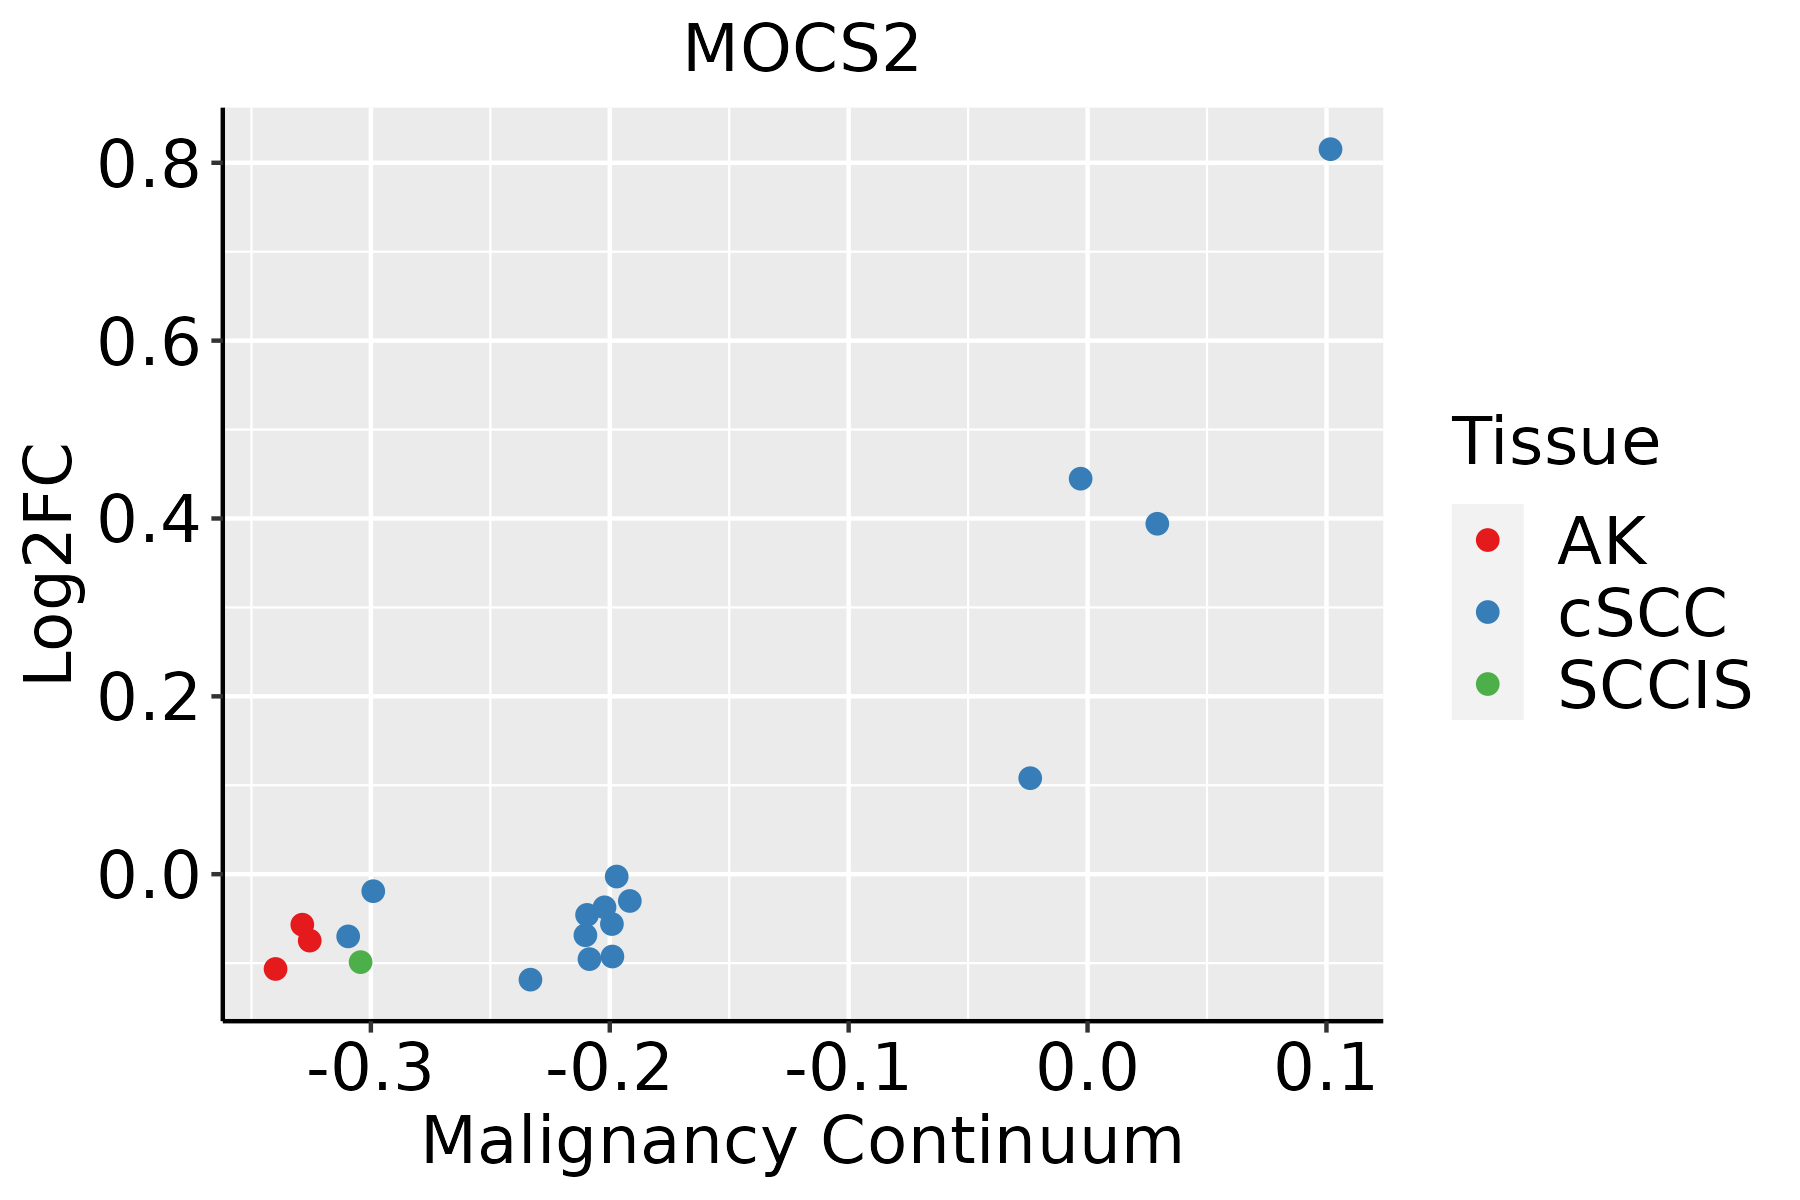 | AK: Actinic keratosis |
| cSCC: Cutaneous squamous cell carcinoma | ||
| SCCIS:squamous cell carcinoma in situ | ||
| Thyroid | 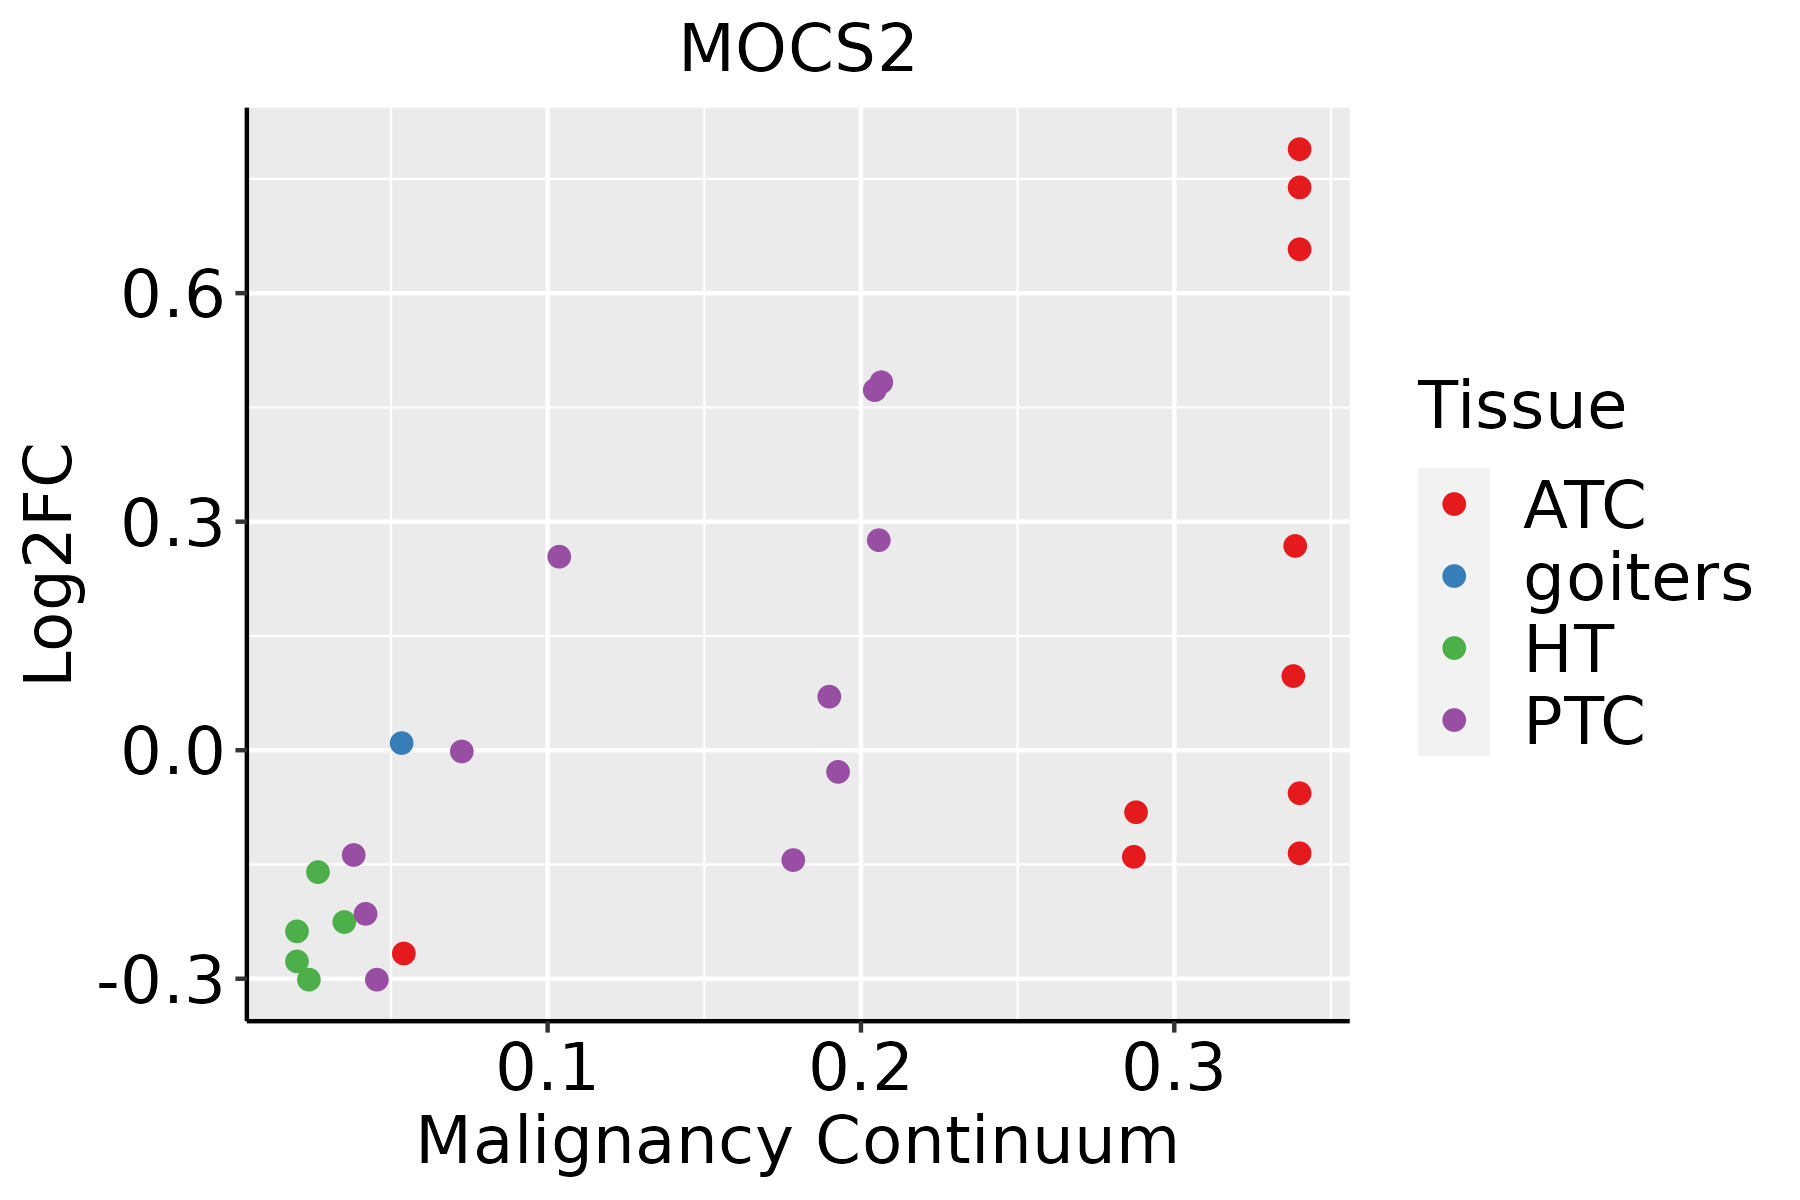 | ATC: Anaplastic thyroid cancer |
| HT: Hashimoto's thyroiditis | ||
| PTC: Papillary thyroid cancer |
| ∗log2FC in expression of this searched gene in stem-like cells from each diseased tissue sample relative to stem-like cells in normal samples in each tissue plotted against the malignancy continuum. Samples are colored based on if they are from different disease stage. |
Top |
Malignant transformation related pathway analysis |
| Find out the enriched GO biological processes and KEGG pathways involved in transition from healthy to precancer to cancer |
| Tissue | Disease Stage | Enriched GO biological Processes |
| Colorectum | AD |  |
| Colorectum | SER |  |
| Colorectum | MSS |  |
| Colorectum | MSI-H |  |
| Colorectum | FAP |  |
| ∗Top 15 enriched GO BP terms are showed in the bar plot of each disease state in each tissue. Each row represents a significant GO biological process which is colored according to the -log10(p.adjust). |
| Page: 1 2 3 4 5 6 7 8 9 |
| GO ID | Tissue | Disease Stage | Description | Gene Ratio | Bg Ratio | pvalue | p.adjust | Count |
| Page: 1 |
| Pathway ID | Tissue | Disease Stage | Description | Gene Ratio | Bg Ratio | pvalue | p.adjust | qvalue | Count |
| hsa012405 | Esophagus | ESCC | Biosynthesis of cofactors | 97/4205 | 153/8465 | 3.88e-04 | 1.35e-03 | 6.94e-04 | 97 |
| hsa0124012 | Esophagus | ESCC | Biosynthesis of cofactors | 97/4205 | 153/8465 | 3.88e-04 | 1.35e-03 | 6.94e-04 | 97 |
| hsa01240 | Liver | Cirrhotic | Biosynthesis of cofactors | 66/2530 | 153/8465 | 3.11e-04 | 1.99e-03 | 1.23e-03 | 66 |
| hsa012401 | Liver | Cirrhotic | Biosynthesis of cofactors | 66/2530 | 153/8465 | 3.11e-04 | 1.99e-03 | 1.23e-03 | 66 |
| hsa012402 | Liver | HCC | Biosynthesis of cofactors | 103/4020 | 153/8465 | 4.67e-07 | 5.05e-06 | 2.81e-06 | 103 |
| hsa012403 | Liver | HCC | Biosynthesis of cofactors | 103/4020 | 153/8465 | 4.67e-07 | 5.05e-06 | 2.81e-06 | 103 |
| hsa012404 | Oral cavity | OSCC | Biosynthesis of cofactors | 88/3704 | 153/8465 | 3.84e-04 | 1.20e-03 | 6.12e-04 | 88 |
| hsa0124011 | Oral cavity | OSCC | Biosynthesis of cofactors | 88/3704 | 153/8465 | 3.84e-04 | 1.20e-03 | 6.12e-04 | 88 |
| hsa0124021 | Oral cavity | LP | Biosynthesis of cofactors | 57/2418 | 153/8465 | 1.17e-02 | 3.91e-02 | 2.52e-02 | 57 |
| hsa0124031 | Oral cavity | LP | Biosynthesis of cofactors | 57/2418 | 153/8465 | 1.17e-02 | 3.91e-02 | 2.52e-02 | 57 |
| Page: 1 |
Top |
Cell-cell communication analysis |
| Identification of potential cell-cell interactions between two cell types and their ligand-receptor pairs for different disease states |
| Ligand | Receptor | LRpair | Pathway | Tissue | Disease Stage |
| Page: 1 |
Top |
Single-cell gene regulatory network inference analysis |
| Find out the significant the regulons (TFs) and the target genes of each regulon across cell types for different disease states |
| TF | Cell Type | Tissue | Disease Stage | Target Gene | RSS | Regulon Activity |
| ∗The dot plots of a searched regulon are shown for all cell subpopulations in each disease state of each tissue based on the regulon specific score inferred using pySCENIC and by calculating the average expression. |
| Page: 1 |
Top |
Somatic mutation of malignant transformation related genes |
| Annotation of somatic variants for genes involved in malignant transformation |
| Hugo Symbol | Variant Class | Variant Classification | dbSNP RS | HGVSc | HGVSp | HGVSp Short | SWISSPROT | BIOTYPE | SIFT | PolyPhen | Tumor Sample Barcode | Tissue | Histology | Sex | Age | Stage | Therapy Types | Drugs | Outcome |
| MOCS2 | insertion | Frame_Shift_Ins | novel | c.309_310insTA | p.Arg104Ter | p.R104* | O96007 | protein_coding | TCGA-AM-5820-01 | Colorectum | colon adenocarcinoma | Female | <65 | I/II | Unknown | Unknown | SD | ||
| MOCS2 | insertion | Nonsense_Mutation | novel | c.308_309insAATATAGAATTA | p.Val103_Arg104insIleTerAsnTyr | p.V103_R104insI*NY | O96007 | protein_coding | TCGA-AM-5820-01 | Colorectum | colon adenocarcinoma | Female | <65 | I/II | Unknown | Unknown | SD | ||
| MOCS2 | SNV | Missense_Mutation | rs148685617 | c.209N>T | p.Ala70Val | p.A70V | O96007 | protein_coding | deleterious(0) | probably_damaging(0.999) | TCGA-A5-A0G1-01 | Endometrium | uterine corpus endometrioid carcinoma | Female | >=65 | I/II | Unknown | Unknown | SD |
| MOCS2 | SNV | Missense_Mutation | c.407N>C | p.Ile136Thr | p.I136T | O96007 | protein_coding | deleterious(0) | possibly_damaging(0.783) | TCGA-A5-A0G2-01 | Endometrium | uterine corpus endometrioid carcinoma | Female | <65 | III/IV | Unknown | Unknown | SD | |
| MOCS2 | SNV | Missense_Mutation | c.152C>T | p.Ala51Val | p.A51V | O96007 | protein_coding | tolerated(0.41) | benign(0.158) | TCGA-AP-A056-01 | Endometrium | uterine corpus endometrioid carcinoma | Female | <65 | I/II | Unknown | Unknown | SD | |
| MOCS2 | SNV | Missense_Mutation | novel | c.419N>T | p.Ser140Phe | p.S140F | O96007 | protein_coding | deleterious(0) | probably_damaging(0.999) | TCGA-AX-A1CE-01 | Endometrium | uterine corpus endometrioid carcinoma | Female | <65 | I/II | Unspecific | Paclitaxel | SD |
| MOCS2 | SNV | Missense_Mutation | rs757573455 | c.290N>T | p.Pro97Leu | p.P97L | O96007 | protein_coding | deleterious(0.04) | benign(0.395) | TCGA-AX-A1CE-01 | Endometrium | uterine corpus endometrioid carcinoma | Female | <65 | I/II | Unspecific | Paclitaxel | SD |
| MOCS2 | SNV | Missense_Mutation | c.407N>C | p.Ile136Thr | p.I136T | O96007 | protein_coding | deleterious(0) | possibly_damaging(0.783) | TCGA-B5-A11G-01 | Endometrium | uterine corpus endometrioid carcinoma | Female | >=65 | I/II | Unknown | Unknown | SD | |
| MOCS2 | SNV | Missense_Mutation | rs534504858 | c.487C>T | p.Pro163Ser | p.P163S | O96007 | protein_coding | deleterious(0) | probably_damaging(0.993) | TCGA-BK-A0C9-01 | Endometrium | uterine corpus endometrioid carcinoma | Female | <65 | I/II | Unknown | Unknown | SD |
| MOCS2 | SNV | Missense_Mutation | rs766166640 | c.511G>A | p.Glu171Lys | p.E171K | O96007 | protein_coding | deleterious(0.03) | benign(0.134) | TCGA-BS-A0TC-01 | Endometrium | uterine corpus endometrioid carcinoma | Female | >=65 | I/II | Unknown | Unknown | SD |
| Page: 1 2 |
Top |
Related drugs of malignant transformation related genes |
| Identification of chemicals and drugs interact with genes involved in malignant transfromation |
| (DGIdb 4.0) |
| Entrez ID | Symbol | Category | Interaction Types | Drug Claim Name | Drug Name | PMIDs |
| Page: 1 |

Copyright 2023-Present -The University of Texas Health Science Center at Houston |