
|
|||||
|
 | |
| |
| |
| |
| |
| |
|
Gene: MOCOS |
Gene summary for MOCOS |
| Gene information | Species | Human | Gene symbol | MOCOS | Gene ID | 55034 |
| Gene name | molybdenum cofactor sulfurase | |
| Gene Alias | HMCS | |
| Cytomap | 18q12.2 | |
| Gene Type | protein-coding | GO ID | GO:0006777 | UniProtAcc | Q96EN8 |
Top |
Malignant transformation analysis |
| Identification of the aberrant gene expression in precancerous and cancerous lesions by comparing the gene expression of stem-like cells in diseased tissues with normal stem cells |
| Entrez ID | Symbol | Replicates | Species | Organ | Tissue | Adj P-value | Log2FC | Malignancy |
| 55034 | MOCOS | P1T-E | Human | Esophagus | ESCC | 1.42e-03 | 2.69e-01 | 0.0875 |
| 55034 | MOCOS | P2T-E | Human | Esophagus | ESCC | 1.96e-05 | 1.08e-01 | 0.1177 |
| 55034 | MOCOS | P5T-E | Human | Esophagus | ESCC | 1.51e-04 | 1.41e-01 | 0.1327 |
| 55034 | MOCOS | P9T-E | Human | Esophagus | ESCC | 1.20e-09 | 2.82e-01 | 0.1131 |
| 55034 | MOCOS | P11T-E | Human | Esophagus | ESCC | 5.11e-04 | 2.57e-01 | 0.1426 |
| 55034 | MOCOS | P17T-E | Human | Esophagus | ESCC | 1.52e-03 | 2.76e-01 | 0.1278 |
| 55034 | MOCOS | P19T-E | Human | Esophagus | ESCC | 3.92e-06 | 6.40e-01 | 0.1662 |
| 55034 | MOCOS | P20T-E | Human | Esophagus | ESCC | 2.22e-03 | 9.29e-02 | 0.1124 |
| 55034 | MOCOS | P21T-E | Human | Esophagus | ESCC | 3.97e-04 | 1.13e-01 | 0.1617 |
| 55034 | MOCOS | P23T-E | Human | Esophagus | ESCC | 4.39e-06 | 2.89e-01 | 0.108 |
| 55034 | MOCOS | P24T-E | Human | Esophagus | ESCC | 3.95e-30 | 6.46e-01 | 0.1287 |
| 55034 | MOCOS | P26T-E | Human | Esophagus | ESCC | 1.02e-02 | 1.67e-01 | 0.1276 |
| 55034 | MOCOS | P36T-E | Human | Esophagus | ESCC | 1.01e-09 | 3.81e-01 | 0.1187 |
| 55034 | MOCOS | P37T-E | Human | Esophagus | ESCC | 6.43e-03 | 1.10e-01 | 0.1371 |
| 55034 | MOCOS | P40T-E | Human | Esophagus | ESCC | 1.15e-04 | 1.74e-01 | 0.109 |
| 55034 | MOCOS | P42T-E | Human | Esophagus | ESCC | 2.51e-04 | 1.26e-01 | 0.1175 |
| 55034 | MOCOS | P47T-E | Human | Esophagus | ESCC | 3.75e-03 | 9.50e-02 | 0.1067 |
| 55034 | MOCOS | P52T-E | Human | Esophagus | ESCC | 7.98e-13 | 2.87e-01 | 0.1555 |
| 55034 | MOCOS | P54T-E | Human | Esophagus | ESCC | 4.42e-03 | 1.62e-01 | 0.0975 |
| 55034 | MOCOS | P62T-E | Human | Esophagus | ESCC | 1.53e-10 | 2.34e-01 | 0.1302 |
| Page: 1 2 |
| Tissue | Expression Dynamics | Abbreviation |
| Esophagus | 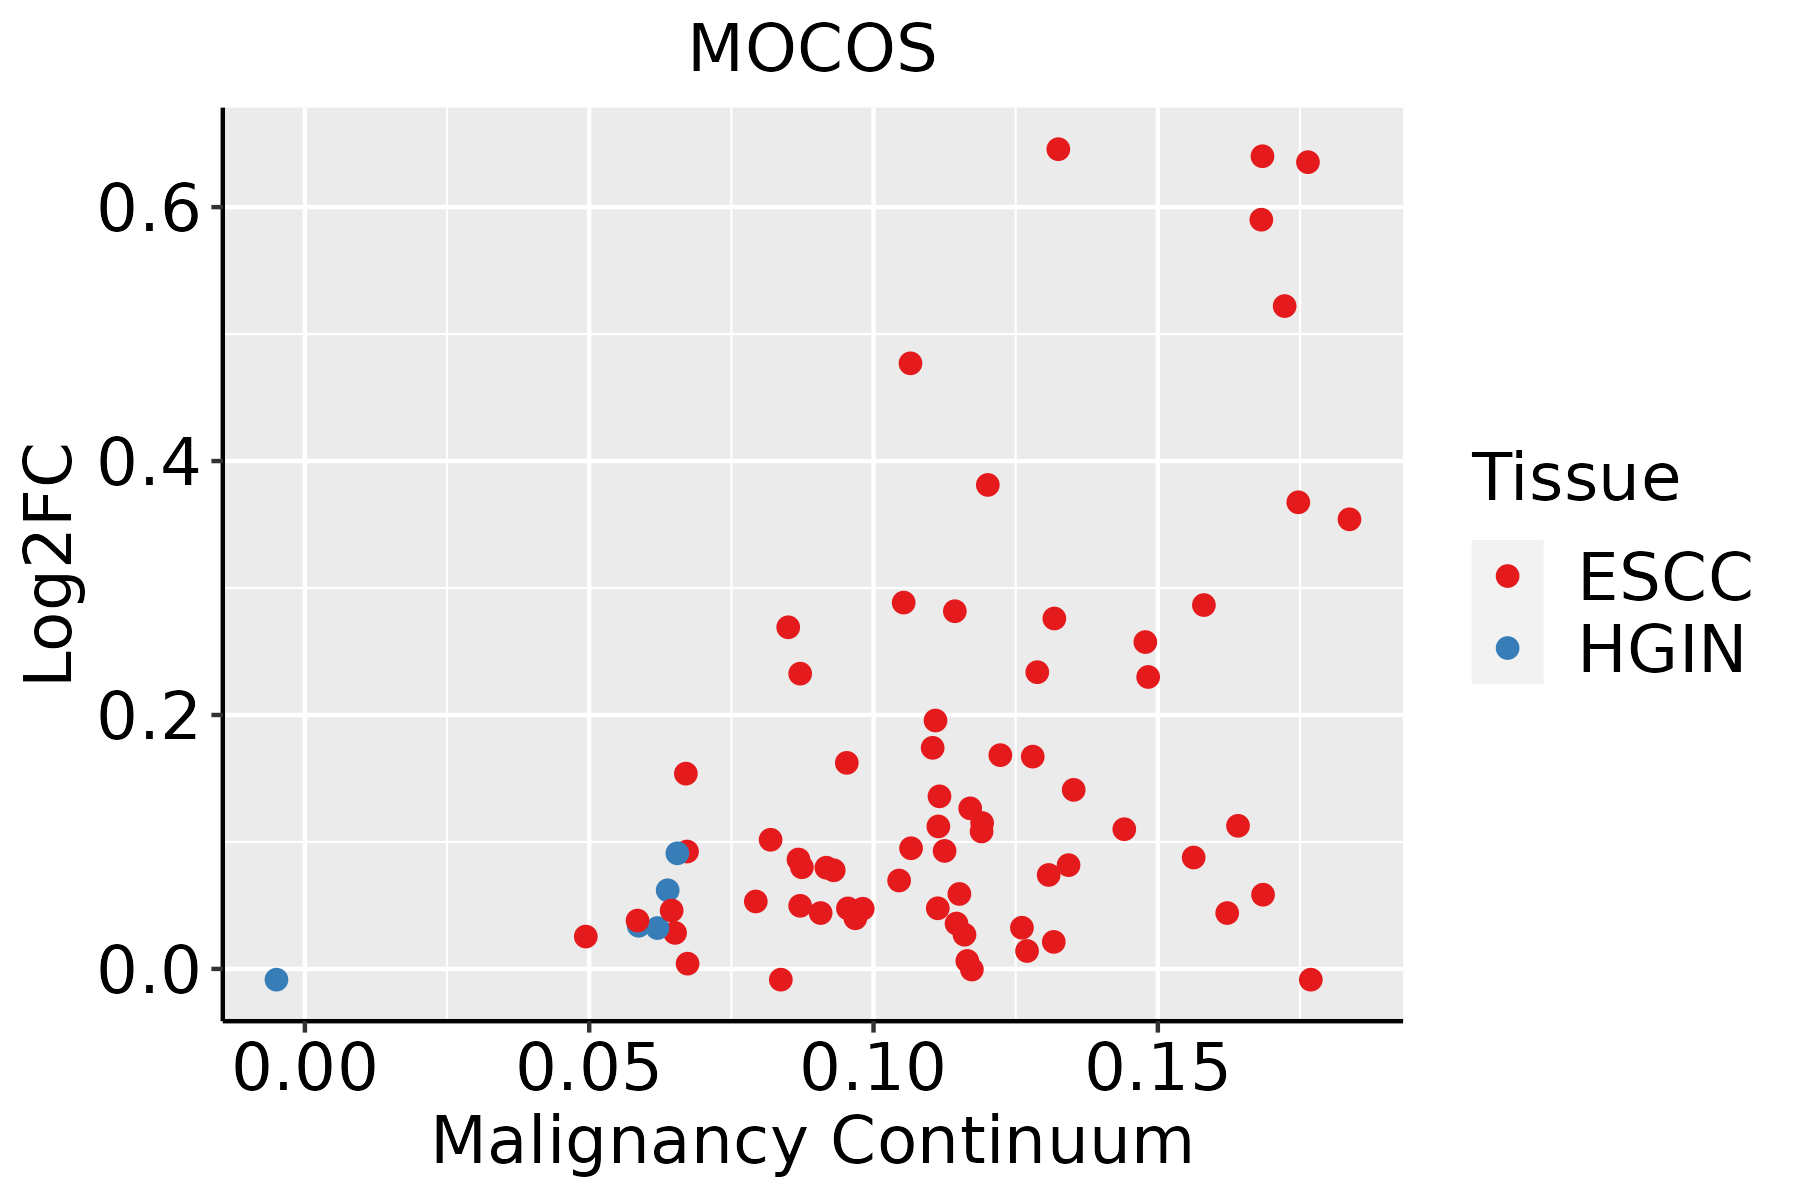 | ESCC: Esophageal squamous cell carcinoma |
| HGIN: High-grade intraepithelial neoplasias | ||
| LGIN: Low-grade intraepithelial neoplasias | ||
| Liver | 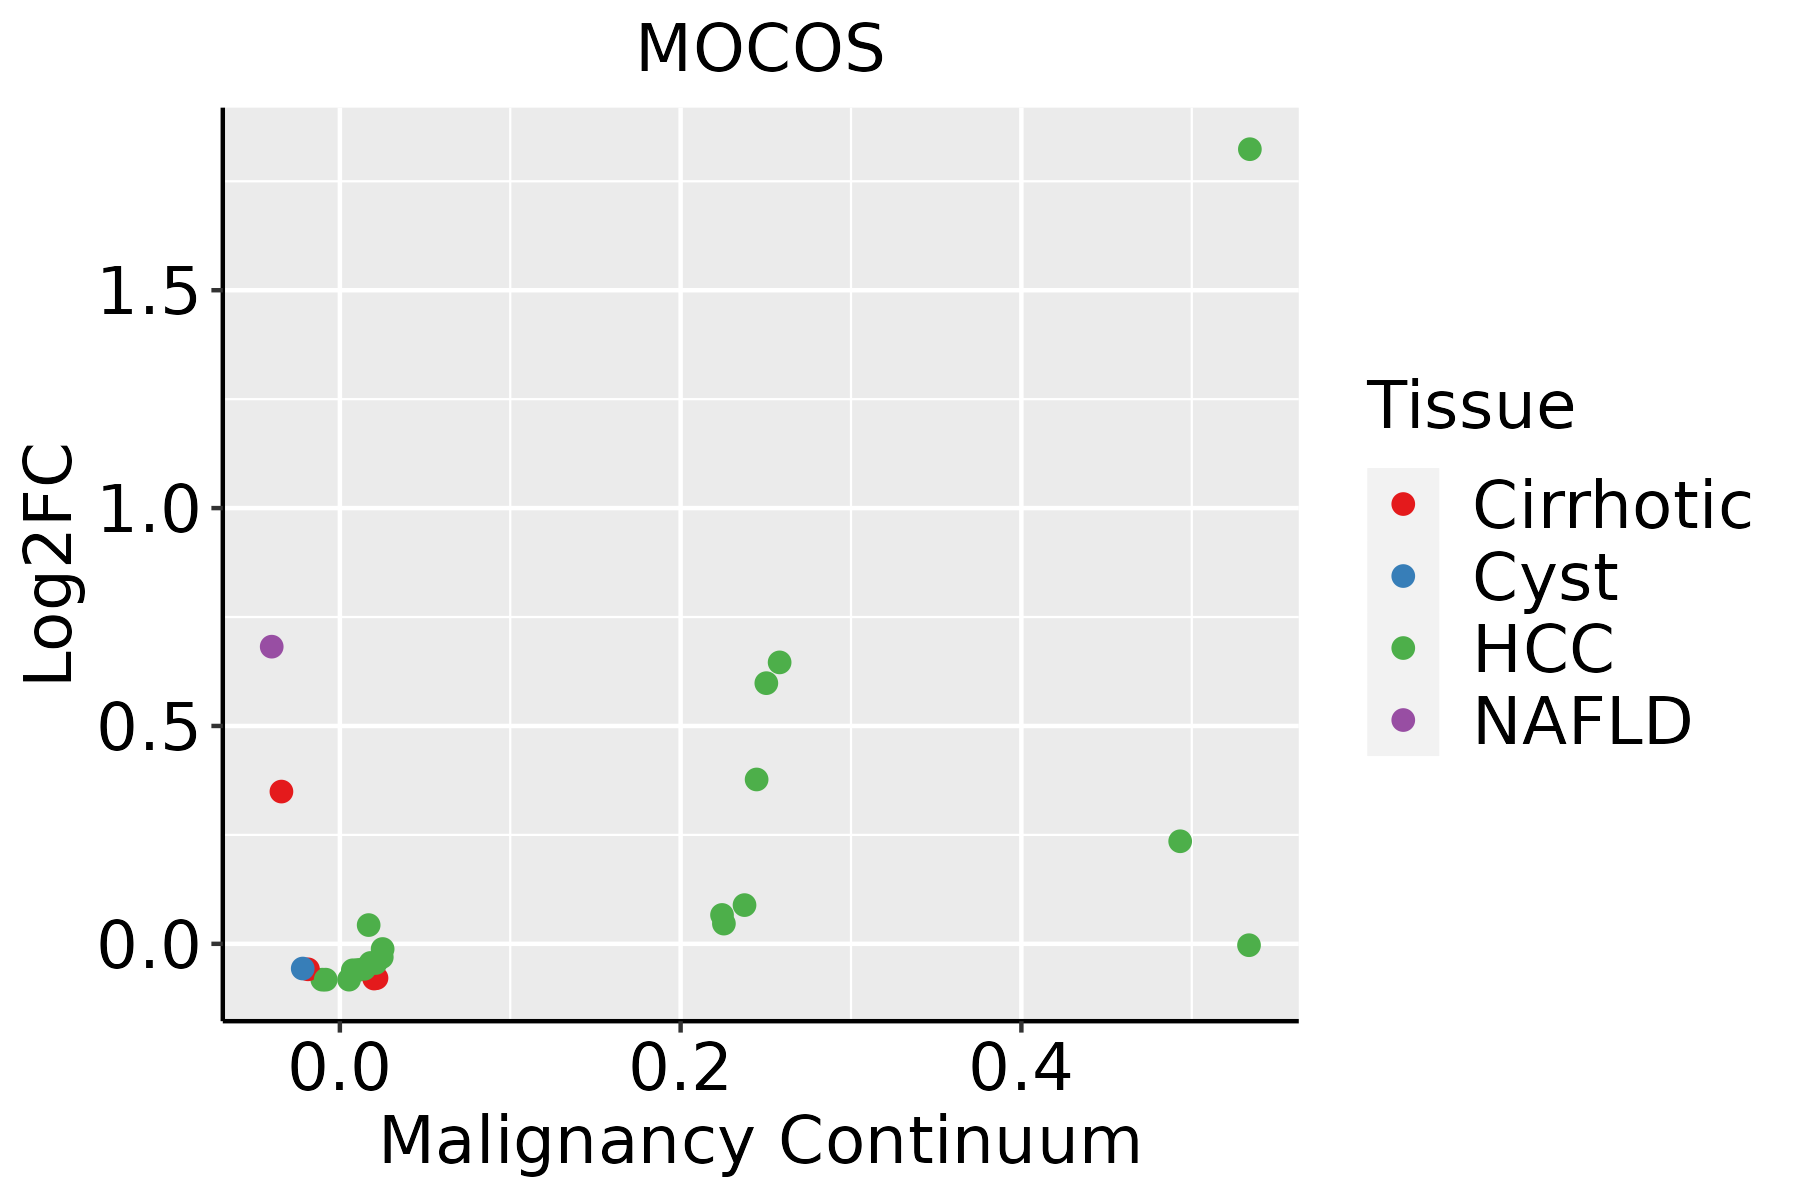 | HCC: Hepatocellular carcinoma |
| NAFLD: Non-alcoholic fatty liver disease | ||
| Thyroid | 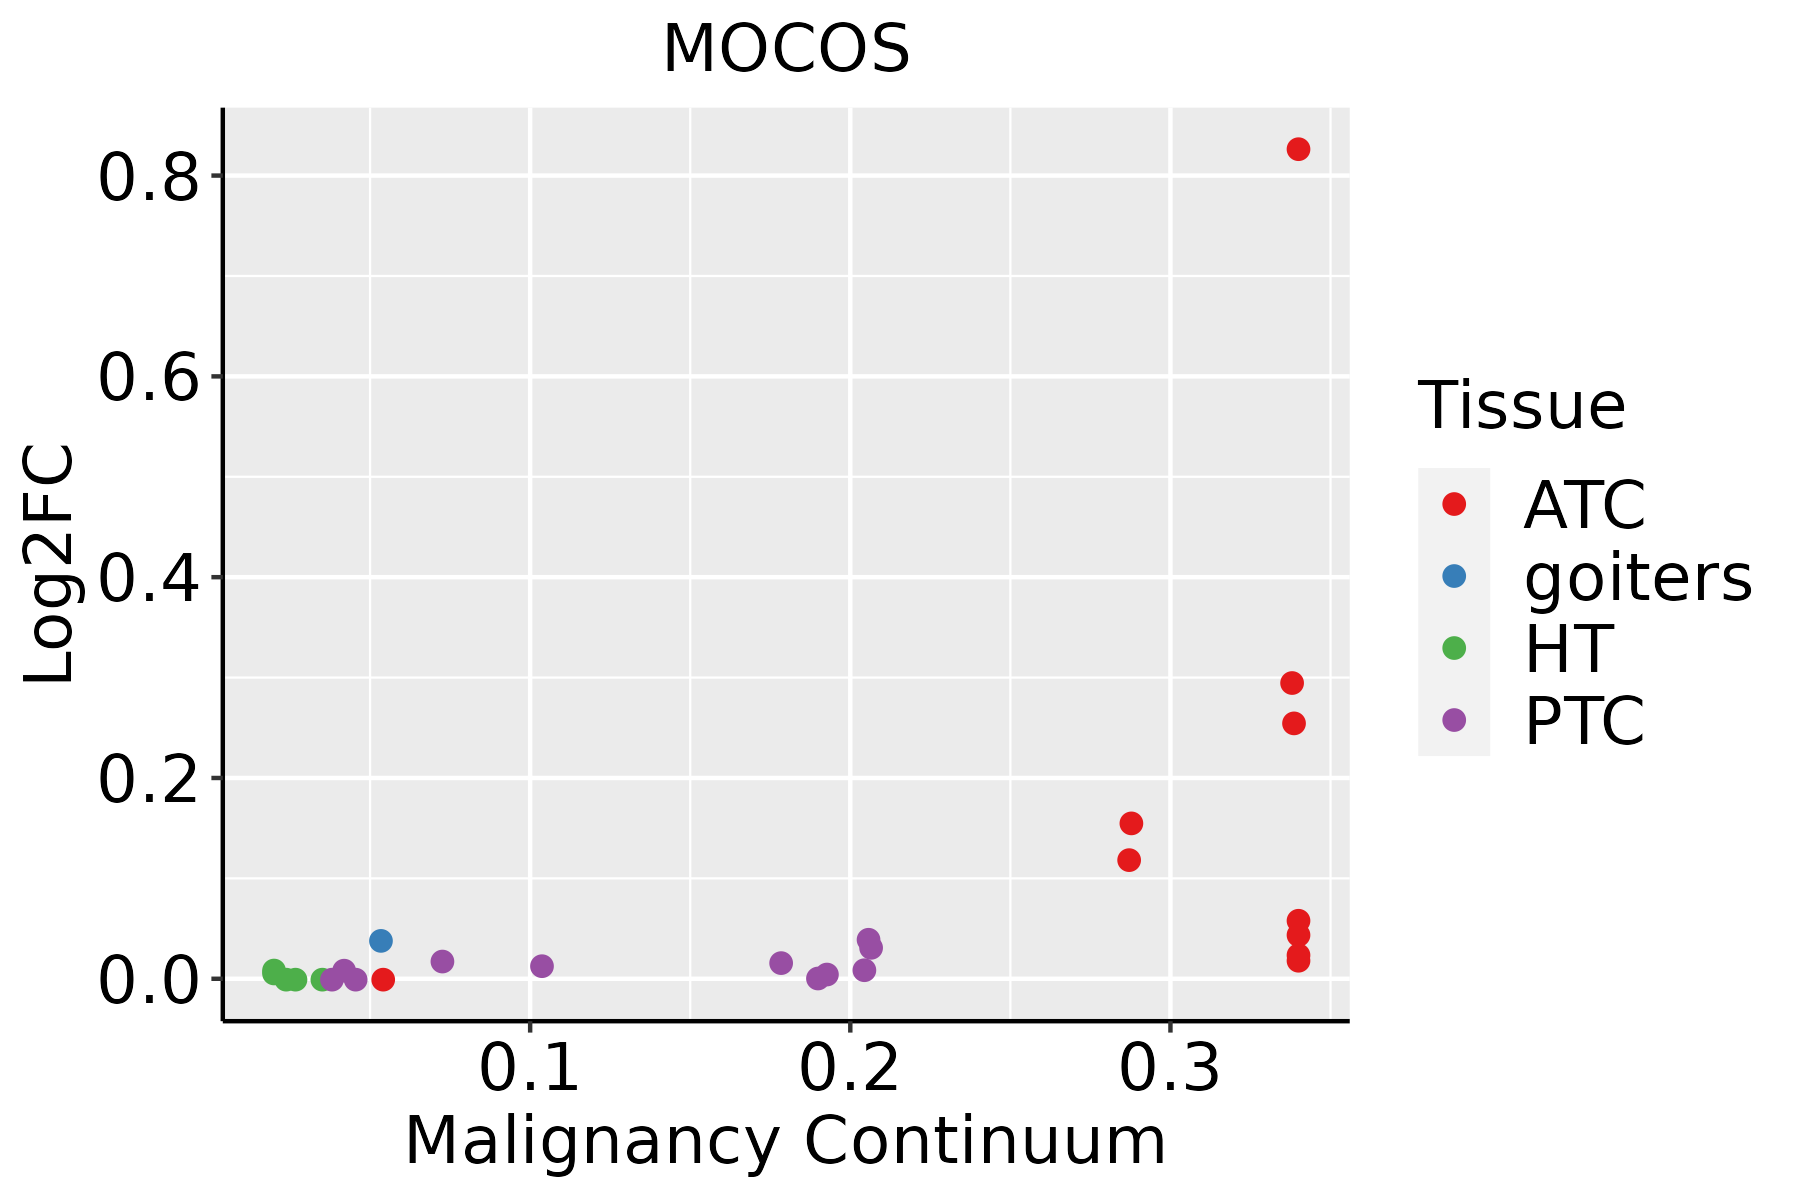 | ATC: Anaplastic thyroid cancer |
| HT: Hashimoto's thyroiditis | ||
| PTC: Papillary thyroid cancer |
| ∗log2FC in expression of this searched gene in stem-like cells from each diseased tissue sample relative to stem-like cells in normal samples in each tissue plotted against the malignancy continuum. Samples are colored based on if they are from different disease stage. |
Top |
Malignant transformation related pathway analysis |
| Find out the enriched GO biological processes and KEGG pathways involved in transition from healthy to precancer to cancer |
| Tissue | Disease Stage | Enriched GO biological Processes |
| Colorectum | AD |  |
| Colorectum | SER |  |
| Colorectum | MSS |  |
| Colorectum | MSI-H |  |
| Colorectum | FAP |  |
| ∗Top 15 enriched GO BP terms are showed in the bar plot of each disease state in each tissue. Each row represents a significant GO biological process which is colored according to the -log10(p.adjust). |
| Page: 1 2 3 4 5 6 7 8 9 |
| GO ID | Tissue | Disease Stage | Description | Gene Ratio | Bg Ratio | pvalue | p.adjust | Count |
| Page: 1 |
| Pathway ID | Tissue | Disease Stage | Description | Gene Ratio | Bg Ratio | pvalue | p.adjust | qvalue | Count |
| Page: 1 |
Top |
Cell-cell communication analysis |
| Identification of potential cell-cell interactions between two cell types and their ligand-receptor pairs for different disease states |
| Ligand | Receptor | LRpair | Pathway | Tissue | Disease Stage |
| Page: 1 |
Top |
Single-cell gene regulatory network inference analysis |
| Find out the significant the regulons (TFs) and the target genes of each regulon across cell types for different disease states |
| TF | Cell Type | Tissue | Disease Stage | Target Gene | RSS | Regulon Activity |
| ∗The dot plots of a searched regulon are shown for all cell subpopulations in each disease state of each tissue based on the regulon specific score inferred using pySCENIC and by calculating the average expression. |
| Page: 1 |
Top |
Somatic mutation of malignant transformation related genes |
| Annotation of somatic variants for genes involved in malignant transformation |
| Hugo Symbol | Variant Class | Variant Classification | dbSNP RS | HGVSc | HGVSp | HGVSp Short | SWISSPROT | BIOTYPE | SIFT | PolyPhen | Tumor Sample Barcode | Tissue | Histology | Sex | Age | Stage | Therapy Types | Drugs | Outcome |
| MOCOS | SNV | Missense_Mutation | c.1283N>T | p.Ala428Val | p.A428V | Q96EN8 | protein_coding | deleterious(0) | probably_damaging(0.941) | TCGA-A2-A0SU-01 | Breast | breast invasive carcinoma | Female | >=65 | I/II | Hormone Therapy | arimidex | SD | |
| MOCOS | SNV | Missense_Mutation | c.1085N>A | p.Ser362Tyr | p.S362Y | Q96EN8 | protein_coding | deleterious(0) | possibly_damaging(0.696) | TCGA-A7-A26I-01 | Breast | breast invasive carcinoma | Female | >=65 | I/II | Chemotherapy | cytoxan | SD | |
| MOCOS | SNV | Missense_Mutation | novel | c.762N>T | p.Gln254His | p.Q254H | Q96EN8 | protein_coding | tolerated(0.07) | benign(0.439) | TCGA-A7-A4SB-01 | Breast | breast invasive carcinoma | Female | <65 | III/IV | Chemotherapy | docetaxel | CR |
| MOCOS | SNV | Missense_Mutation | rs375515480 | c.1307N>A | p.Ser436Asn | p.S436N | Q96EN8 | protein_coding | deleterious(0) | possibly_damaging(0.649) | TCGA-A8-A09Z-01 | Breast | breast invasive carcinoma | Female | >=65 | I/II | Unknown | Unknown | SD |
| MOCOS | SNV | Missense_Mutation | c.1201A>G | p.Ile401Val | p.I401V | Q96EN8 | protein_coding | tolerated(0.71) | benign(0.005) | TCGA-C8-A12Y-01 | Breast | breast invasive carcinoma | Female | <65 | I/II | Unknown | Unknown | SD | |
| MOCOS | SNV | Missense_Mutation | c.1478C>T | p.Ser493Leu | p.S493L | Q96EN8 | protein_coding | tolerated(0.24) | benign(0.003) | TCGA-D8-A1J8-01 | Breast | breast invasive carcinoma | Female | >=65 | I/II | Hormone Therapy | nolvadex | SD | |
| MOCOS | insertion | Nonsense_Mutation | novel | c.2474_2475insTTGACTCAATAATTTCACTTGTAGAAATCTATCCCATAGAAAC | p.Gln825HisfsTer2 | p.Q825Hfs*2 | Q96EN8 | protein_coding | TCGA-A2-A0EX-01 | Breast | breast invasive carcinoma | Female | <65 | I/II | Hormone Therapy | tamoxiphen | SD | ||
| MOCOS | insertion | Frame_Shift_Ins | novel | c.538_539insGA | p.Ala180GlyfsTer38 | p.A180Gfs*38 | Q96EN8 | protein_coding | TCGA-AO-A03O-01 | Breast | breast invasive carcinoma | Female | >=65 | I/II | Chemotherapy | doxorubicin | SD | ||
| MOCOS | insertion | Frame_Shift_Ins | novel | c.539_540insACCGGGAAGGGAGCAAAACT | p.Glu181ProfsTer7 | p.E181Pfs*7 | Q96EN8 | protein_coding | TCGA-AO-A03O-01 | Breast | breast invasive carcinoma | Female | >=65 | I/II | Chemotherapy | doxorubicin | SD | ||
| MOCOS | insertion | Frame_Shift_Ins | novel | c.1925_1926insGACATCTTGTGAGGATGCTGCAGCCTTTCCTCAATGTGGGCCT | p.Asp642GlufsTer36 | p.D642Efs*36 | Q96EN8 | protein_coding | TCGA-AR-A0TY-01 | Breast | breast invasive carcinoma | Female | <65 | I/II | Unspecific | Paclitaxel | PD |
| Page: 1 2 3 4 5 6 7 8 9 10 11 12 |
Top |
Related drugs of malignant transformation related genes |
| Identification of chemicals and drugs interact with genes involved in malignant transfromation |
| (DGIdb 4.0) |
| Entrez ID | Symbol | Category | Interaction Types | Drug Claim Name | Drug Name | PMIDs |
| Page: 1 |

Copyright 2023-Present -The University of Texas Health Science Center at Houston |