
|
|||||
|
 | |
| |
| |
| |
| |
| |
|
Gene: MOB3B |
Gene summary for MOB3B |
| Gene information | Species | Human | Gene symbol | MOB3B | Gene ID | 79817 |
| Gene name | MOB kinase activator 3B | |
| Gene Alias | C9orf35 | |
| Cytomap | 9p21.2 | |
| Gene Type | protein-coding | GO ID | GO:0001932 | UniProtAcc | Q86TA1 |
Top |
Malignant transformation analysis |
| Identification of the aberrant gene expression in precancerous and cancerous lesions by comparing the gene expression of stem-like cells in diseased tissues with normal stem cells |
| Entrez ID | Symbol | Replicates | Species | Organ | Tissue | Adj P-value | Log2FC | Malignancy |
| 79817 | MOB3B | CCI_2 | Human | Cervix | CC | 1.68e-05 | 1.31e+00 | 0.5249 |
| 79817 | MOB3B | CCI_3 | Human | Cervix | CC | 2.42e-02 | 5.74e-01 | 0.516 |
| 79817 | MOB3B | HTA11_3410_2000001011 | Human | Colorectum | AD | 1.43e-16 | -6.15e-01 | 0.0155 |
| 79817 | MOB3B | HTA11_347_2000001011 | Human | Colorectum | AD | 7.60e-10 | 6.13e-01 | -0.1954 |
| 79817 | MOB3B | HTA11_866_3004761011 | Human | Colorectum | AD | 3.43e-10 | -6.47e-01 | 0.096 |
| 79817 | MOB3B | HTA11_10711_2000001011 | Human | Colorectum | AD | 3.50e-03 | -5.23e-01 | 0.0338 |
| 79817 | MOB3B | HTA11_7696_3000711011 | Human | Colorectum | AD | 1.59e-20 | -6.66e-01 | 0.0674 |
| 79817 | MOB3B | HTA11_99999970781_79442 | Human | Colorectum | MSS | 6.16e-38 | -8.25e-01 | 0.294 |
| 79817 | MOB3B | HTA11_99999971662_82457 | Human | Colorectum | MSS | 1.71e-30 | -7.86e-01 | 0.3859 |
| 79817 | MOB3B | HTA11_99999973899_84307 | Human | Colorectum | MSS | 1.52e-09 | -8.26e-01 | 0.2585 |
| 79817 | MOB3B | HTA11_99999974143_84620 | Human | Colorectum | MSS | 6.92e-47 | -9.55e-01 | 0.3005 |
| 79817 | MOB3B | F007 | Human | Colorectum | FAP | 2.96e-07 | -5.03e-01 | 0.1176 |
| 79817 | MOB3B | A002-C-010 | Human | Colorectum | FAP | 2.53e-02 | -2.85e-01 | 0.242 |
| 79817 | MOB3B | A001-C-207 | Human | Colorectum | FAP | 3.88e-08 | -5.12e-01 | 0.1278 |
| 79817 | MOB3B | A015-C-203 | Human | Colorectum | FAP | 1.82e-37 | -7.56e-01 | -0.1294 |
| 79817 | MOB3B | A015-C-204 | Human | Colorectum | FAP | 7.22e-07 | -4.31e-01 | -0.0228 |
| 79817 | MOB3B | A014-C-040 | Human | Colorectum | FAP | 6.35e-10 | -7.90e-01 | -0.1184 |
| 79817 | MOB3B | A002-C-201 | Human | Colorectum | FAP | 3.41e-24 | -6.46e-01 | 0.0324 |
| 79817 | MOB3B | A002-C-203 | Human | Colorectum | FAP | 3.78e-04 | -3.27e-01 | 0.2786 |
| 79817 | MOB3B | A001-C-119 | Human | Colorectum | FAP | 2.08e-25 | -9.37e-01 | -0.1557 |
| Page: 1 2 3 4 5 |
| Tissue | Expression Dynamics | Abbreviation |
| Cervix | 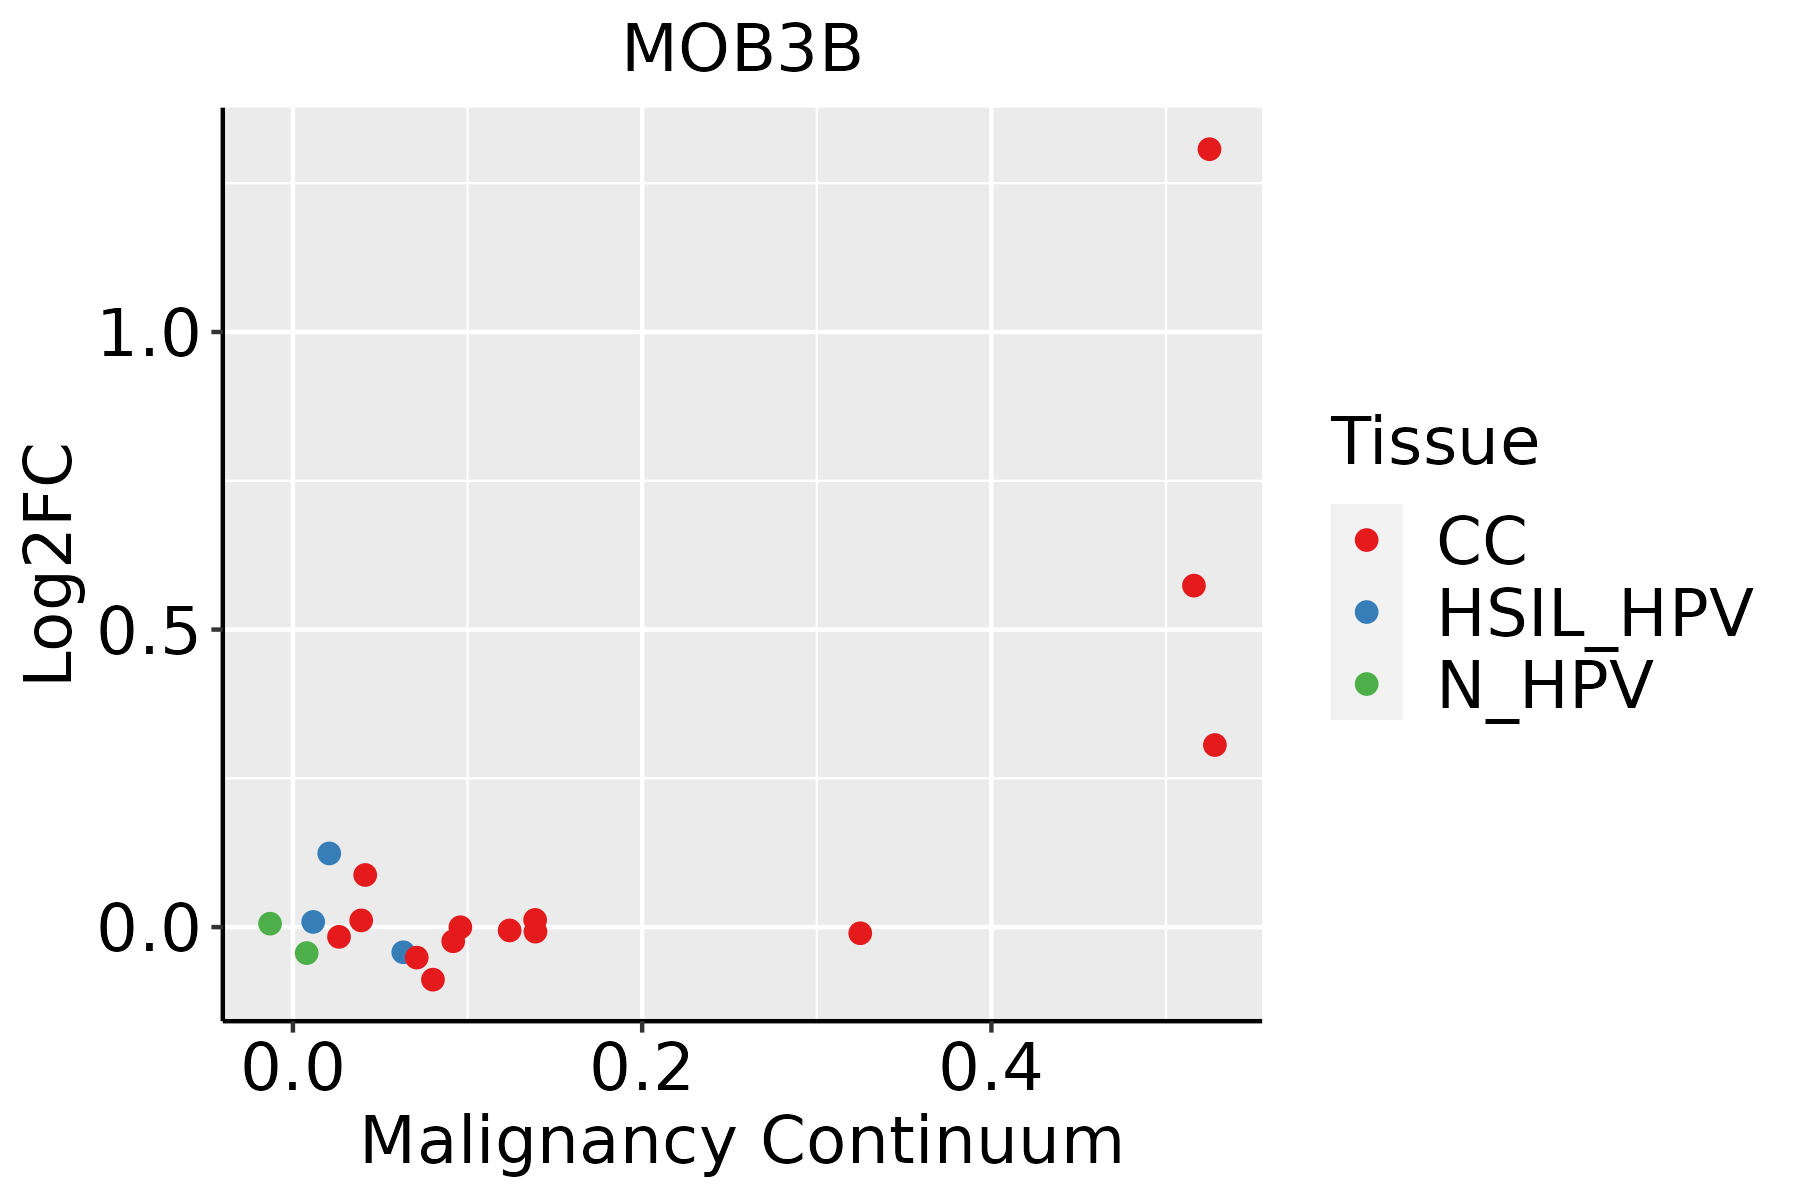 | CC: Cervix cancer |
| HSIL_HPV: HPV-infected high-grade squamous intraepithelial lesions | ||
| N_HPV: HPV-infected normal cervix | ||
| Colorectum (GSE201348) |  | FAP: Familial adenomatous polyposis |
| CRC: Colorectal cancer | ||
| Colorectum (HTA11) |  | AD: Adenomas |
| SER: Sessile serrated lesions | ||
| MSI-H: Microsatellite-high colorectal cancer | ||
| MSS: Microsatellite stable colorectal cancer | ||
| Esophagus | 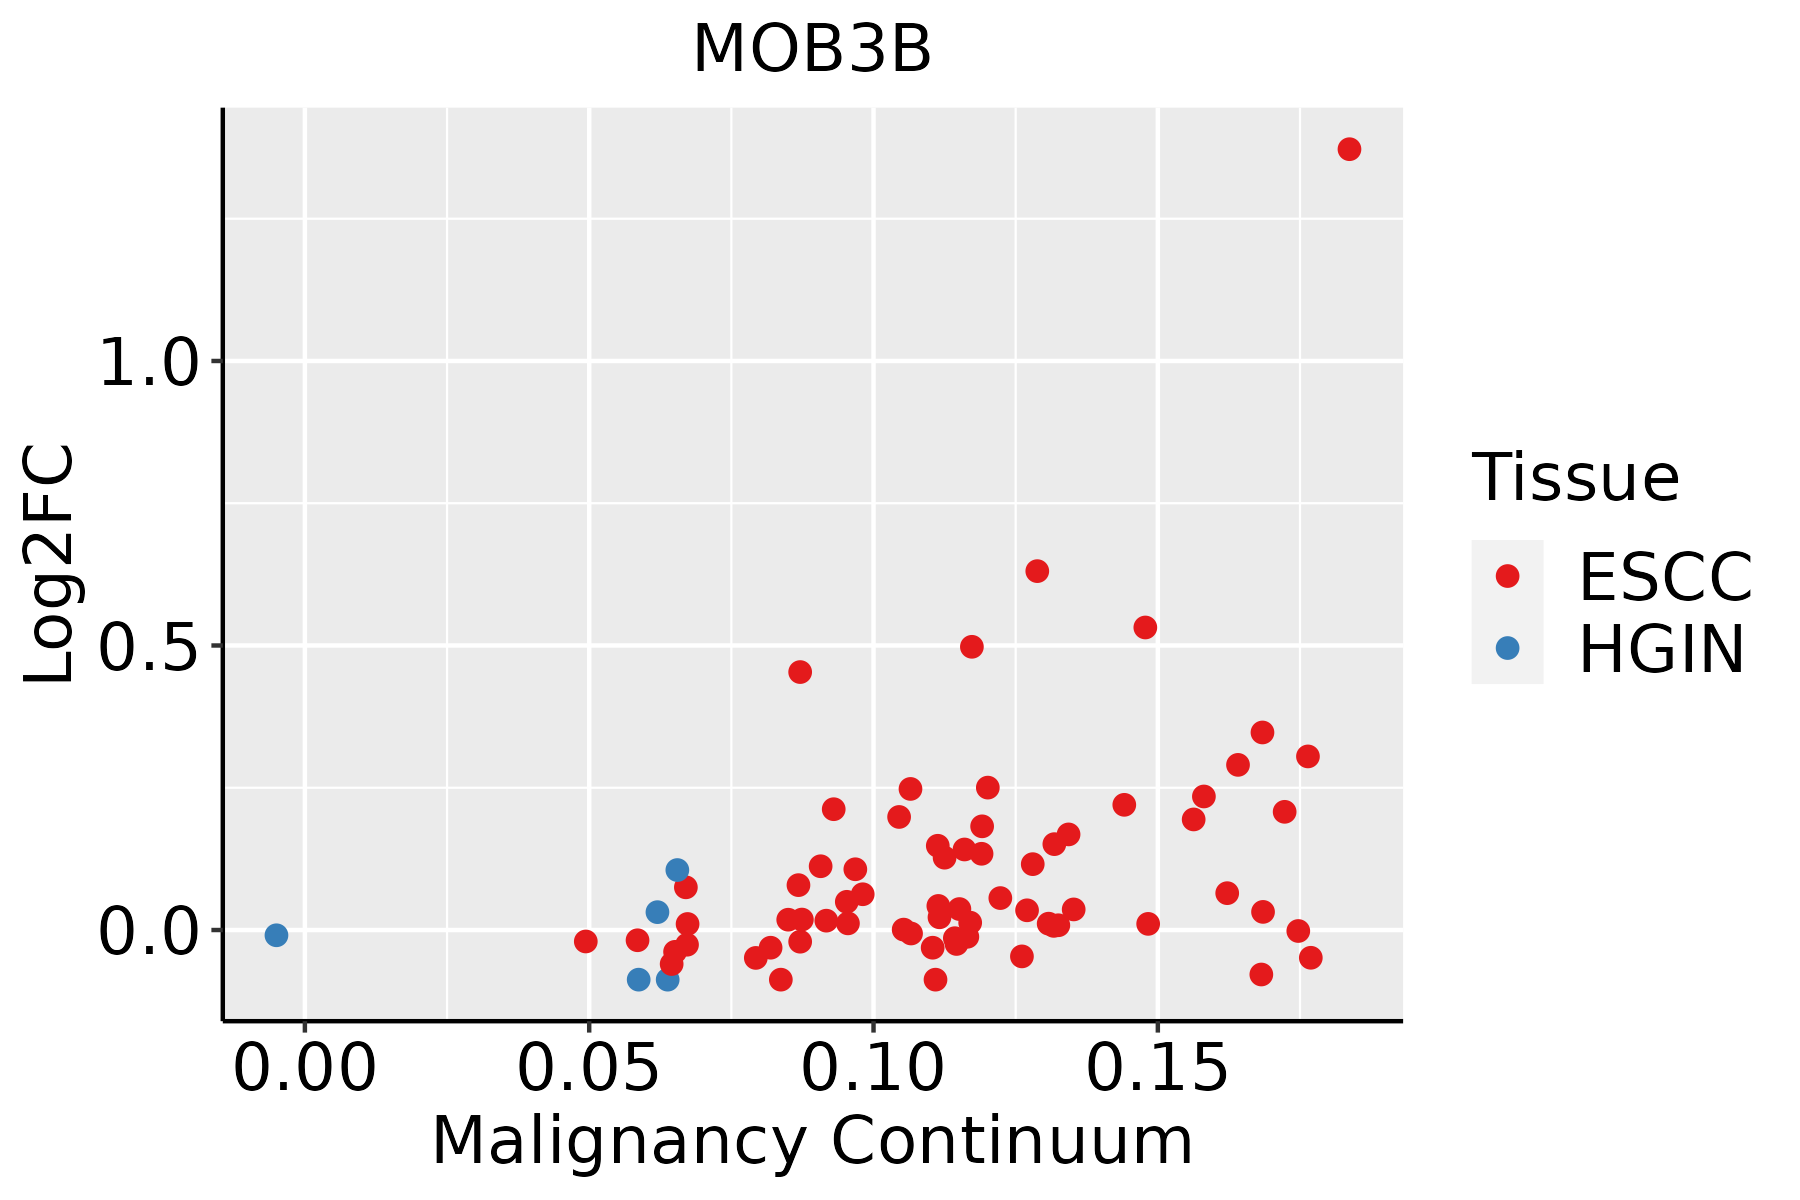 | ESCC: Esophageal squamous cell carcinoma |
| HGIN: High-grade intraepithelial neoplasias | ||
| LGIN: Low-grade intraepithelial neoplasias | ||
| Oral Cavity |  | EOLP: Erosive Oral lichen planus |
| LP: leukoplakia | ||
| NEOLP: Non-erosive oral lichen planus | ||
| OSCC: Oral squamous cell carcinoma | ||
| Skin | 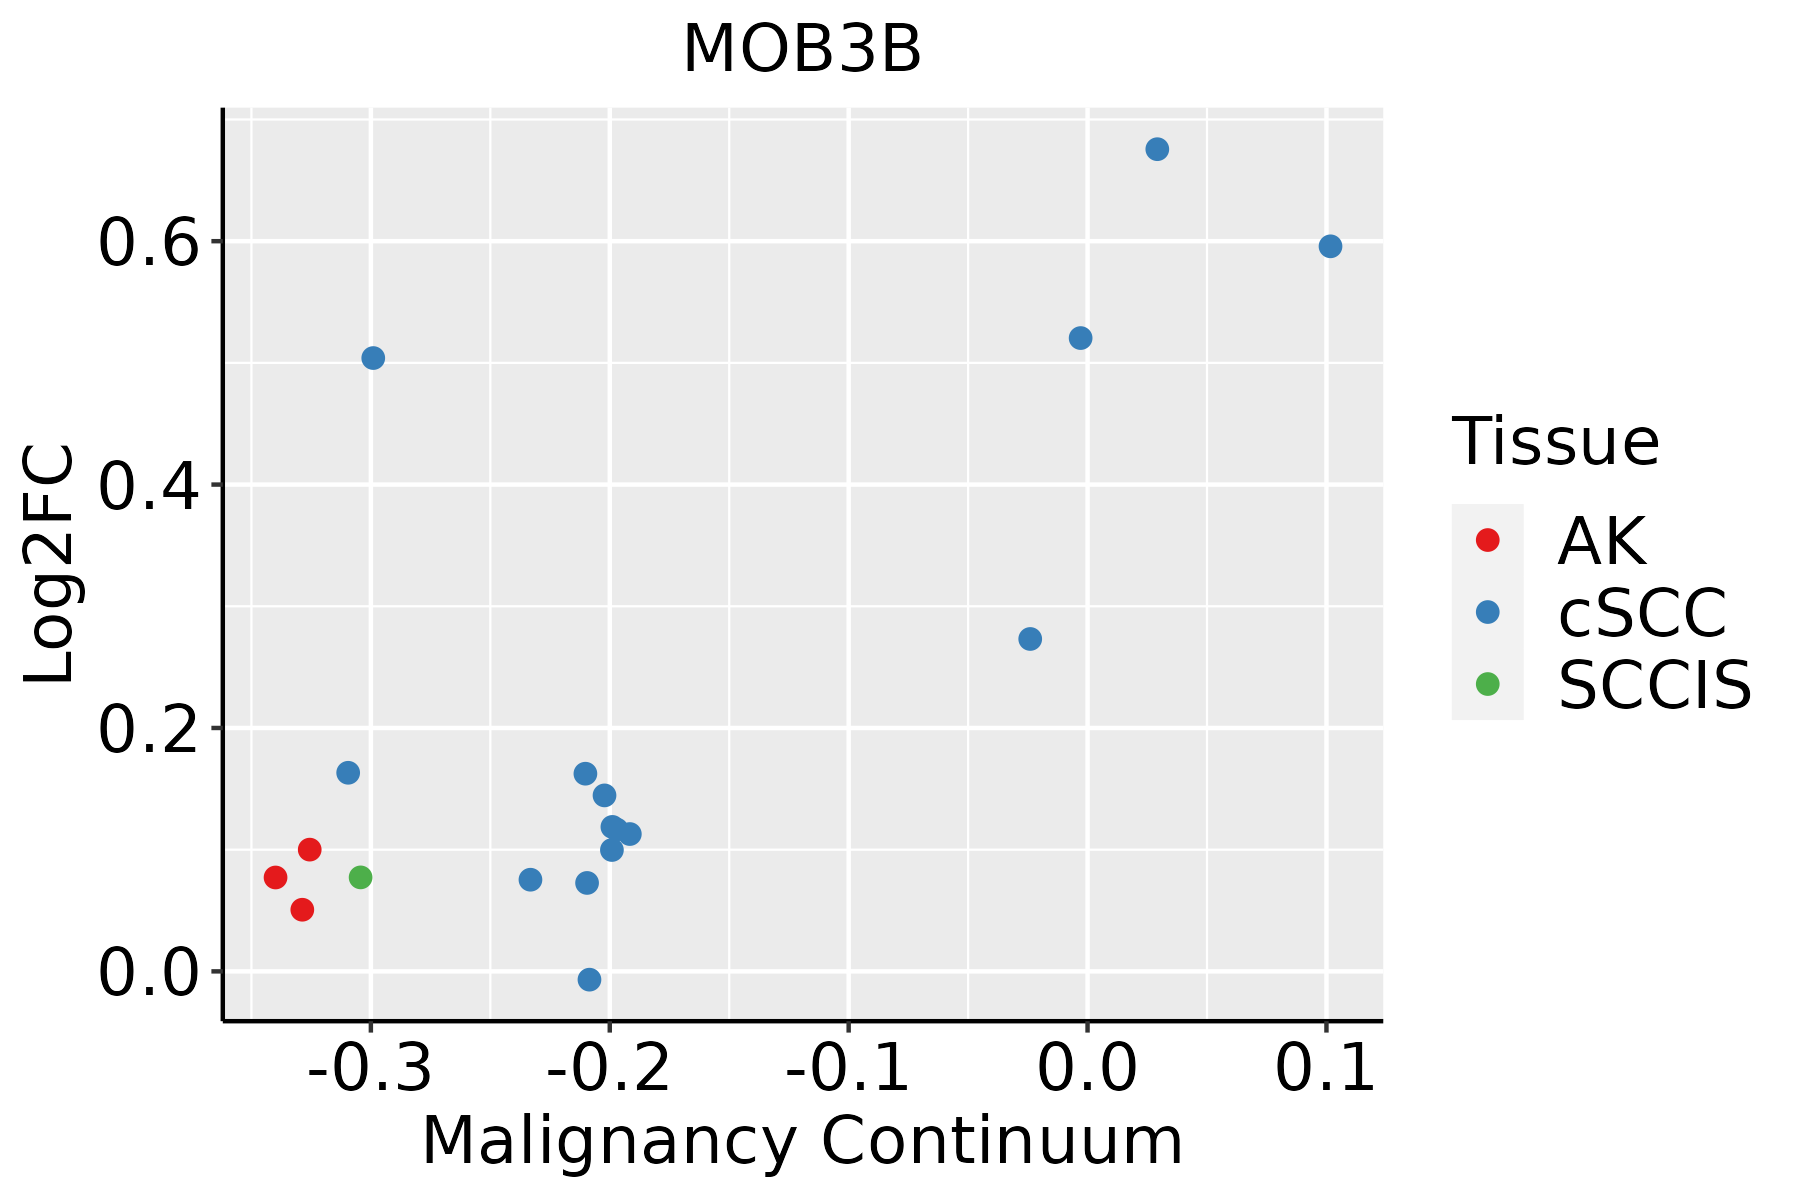 | AK: Actinic keratosis |
| cSCC: Cutaneous squamous cell carcinoma | ||
| SCCIS:squamous cell carcinoma in situ |
| ∗log2FC in expression of this searched gene in stem-like cells from each diseased tissue sample relative to stem-like cells in normal samples in each tissue plotted against the malignancy continuum. Samples are colored based on if they are from different disease stage. |
Top |
Malignant transformation related pathway analysis |
| Find out the enriched GO biological processes and KEGG pathways involved in transition from healthy to precancer to cancer |
| Tissue | Disease Stage | Enriched GO biological Processes |
| Colorectum | AD |  |
| Colorectum | SER |  |
| Colorectum | MSS |  |
| Colorectum | MSI-H |  |
| Colorectum | FAP |  |
| ∗Top 15 enriched GO BP terms are showed in the bar plot of each disease state in each tissue. Each row represents a significant GO biological process which is colored according to the -log10(p.adjust). |
| Page: 1 2 3 4 5 6 7 8 9 |
| GO ID | Tissue | Disease Stage | Description | Gene Ratio | Bg Ratio | pvalue | p.adjust | Count |
| GO:00353294 | Cervix | CC | hippo signaling | 12/2311 | 40/18723 | 2.44e-03 | 1.71e-02 | 12 |
| GO:00353301 | Cervix | CC | regulation of hippo signaling | 7/2311 | 21/18723 | 1.04e-02 | 4.97e-02 | 7 |
| GO:00353297 | Esophagus | ESCC | hippo signaling | 26/8552 | 40/18723 | 1.08e-02 | 3.66e-02 | 26 |
| GO:00353296 | Oral cavity | NEOLP | hippo signaling | 10/2005 | 40/18723 | 8.10e-03 | 3.99e-02 | 10 |
| Page: 1 |
| Pathway ID | Tissue | Disease Stage | Description | Gene Ratio | Bg Ratio | pvalue | p.adjust | qvalue | Count |
| Page: 1 |
Top |
Cell-cell communication analysis |
| Identification of potential cell-cell interactions between two cell types and their ligand-receptor pairs for different disease states |
| Ligand | Receptor | LRpair | Pathway | Tissue | Disease Stage |
| Page: 1 |
Top |
Single-cell gene regulatory network inference analysis |
| Find out the significant the regulons (TFs) and the target genes of each regulon across cell types for different disease states |
| TF | Cell Type | Tissue | Disease Stage | Target Gene | RSS | Regulon Activity |
| ∗The dot plots of a searched regulon are shown for all cell subpopulations in each disease state of each tissue based on the regulon specific score inferred using pySCENIC and by calculating the average expression. |
| Page: 1 |
Top |
Somatic mutation of malignant transformation related genes |
| Annotation of somatic variants for genes involved in malignant transformation |
| Hugo Symbol | Variant Class | Variant Classification | dbSNP RS | HGVSc | HGVSp | HGVSp Short | SWISSPROT | BIOTYPE | SIFT | PolyPhen | Tumor Sample Barcode | Tissue | Histology | Sex | Age | Stage | Therapy Types | Drugs | Outcome |
| MOB3B | SNV | Missense_Mutation | rs755115358 | c.332N>T | p.Ala111Val | p.A111V | Q86TA1 | protein_coding | deleterious(0.05) | benign(0.059) | TCGA-E9-A1RI-01 | Breast | breast invasive carcinoma | Female | <65 | III/IV | Hormone Therapy | tamoxiphen | SD |
| MOB3B | SNV | Missense_Mutation | novel | c.506N>G | p.His169Arg | p.H169R | Q86TA1 | protein_coding | deleterious(0) | probably_damaging(0.997) | TCGA-2W-A8YY-01 | Cervix | cervical & endocervical cancer | Female | <65 | I/II | Chemotherapy | cisplatin | CR |
| MOB3B | SNV | Missense_Mutation | rs747633301 | c.394G>A | p.Glu132Lys | p.E132K | Q86TA1 | protein_coding | deleterious(0.02) | possibly_damaging(0.628) | TCGA-IR-A3LF-01 | Cervix | cervical & endocervical cancer | Female | <65 | I/II | Unknown | Unknown | SD |
| MOB3B | SNV | Missense_Mutation | rs781031539 | c.295C>T | p.Arg99Trp | p.R99W | Q86TA1 | protein_coding | tolerated(0.15) | possibly_damaging(0.9) | TCGA-AA-3713-01 | Colorectum | colon adenocarcinoma | Male | >=65 | III/IV | Chemotherapy | 5-fluorouracil | PR |
| MOB3B | SNV | Missense_Mutation | c.488N>C | p.Val163Ala | p.V163A | Q86TA1 | protein_coding | tolerated(1) | benign(0.371) | TCGA-AA-A02K-01 | Colorectum | colon adenocarcinoma | Male | <65 | III/IV | Chemotherapy | folinic | PD | |
| MOB3B | SNV | Missense_Mutation | c.418G>C | p.Gly140Arg | p.G140R | Q86TA1 | protein_coding | deleterious(0.02) | probably_damaging(0.937) | TCGA-F4-6807-01 | Colorectum | colon adenocarcinoma | Female | <65 | III/IV | Chemotherapy | xeloda | CR | |
| MOB3B | SNV | Missense_Mutation | rs781031539 | c.295N>T | p.Arg99Trp | p.R99W | Q86TA1 | protein_coding | tolerated(0.15) | possibly_damaging(0.9) | TCGA-A5-A0G2-01 | Endometrium | uterine corpus endometrioid carcinoma | Female | <65 | III/IV | Unknown | Unknown | SD |
| MOB3B | SNV | Missense_Mutation | c.230N>T | p.Thr77Ile | p.T77I | Q86TA1 | protein_coding | deleterious(0.02) | possibly_damaging(0.602) | TCGA-AP-A059-01 | Endometrium | uterine corpus endometrioid carcinoma | Female | >=65 | I/II | Unknown | Unknown | SD | |
| MOB3B | SNV | Missense_Mutation | novel | c.218N>A | p.Leu73His | p.L73H | Q86TA1 | protein_coding | deleterious(0) | probably_damaging(0.999) | TCGA-AP-A1DK-01 | Endometrium | uterine corpus endometrioid carcinoma | Female | <65 | I/II | Unknown | Unknown | SD |
| MOB3B | SNV | Missense_Mutation | novel | c.243N>A | p.Phe81Leu | p.F81L | Q86TA1 | protein_coding | deleterious(0.03) | benign(0.027) | TCGA-AX-A2HC-01 | Endometrium | uterine corpus endometrioid carcinoma | Female | <65 | III/IV | Chemotherapy | paclitaxel | PD |
| Page: 1 2 3 |
Top |
Related drugs of malignant transformation related genes |
| Identification of chemicals and drugs interact with genes involved in malignant transfromation |
| (DGIdb 4.0) |
| Entrez ID | Symbol | Category | Interaction Types | Drug Claim Name | Drug Name | PMIDs |
| 79817 | MOB3B | KINASE | Tumor necrosis factor alpha (TNF-alpha) inhibitors |
| Page: 1 |

Copyright 2023-Present -The University of Texas Health Science Center at Houston |