
|
|||||
|
 | |
| |
| |
| |
| |
| |
|
Gene: MOB3A |
Gene summary for MOB3A |
| Gene information | Species | Human | Gene symbol | MOB3A | Gene ID | 126308 |
| Gene name | MOB kinase activator 3A | |
| Gene Alias | MOB-LAK | |
| Cytomap | 19p13.3 | |
| Gene Type | protein-coding | GO ID | GO:0001932 | UniProtAcc | Q96BX8 |
Top |
Malignant transformation analysis |
| Identification of the aberrant gene expression in precancerous and cancerous lesions by comparing the gene expression of stem-like cells in diseased tissues with normal stem cells |
| Entrez ID | Symbol | Replicates | Species | Organ | Tissue | Adj P-value | Log2FC | Malignancy |
| 126308 | MOB3A | LZE4T | Human | Esophagus | ESCC | 1.87e-07 | 2.13e-01 | 0.0811 |
| 126308 | MOB3A | LZE7T | Human | Esophagus | ESCC | 3.68e-02 | 9.16e-02 | 0.0667 |
| 126308 | MOB3A | LZE8T | Human | Esophagus | ESCC | 4.04e-07 | 1.53e-01 | 0.067 |
| 126308 | MOB3A | LZE20T | Human | Esophagus | ESCC | 1.22e-02 | 6.00e-02 | 0.0662 |
| 126308 | MOB3A | LZE24T | Human | Esophagus | ESCC | 9.92e-14 | 1.58e-01 | 0.0596 |
| 126308 | MOB3A | LZE6T | Human | Esophagus | ESCC | 5.39e-11 | 4.69e-01 | 0.0845 |
| 126308 | MOB3A | P1T-E | Human | Esophagus | ESCC | 4.78e-03 | 1.75e-01 | 0.0875 |
| 126308 | MOB3A | P2T-E | Human | Esophagus | ESCC | 5.27e-12 | 2.03e-01 | 0.1177 |
| 126308 | MOB3A | P4T-E | Human | Esophagus | ESCC | 3.10e-23 | 3.45e-01 | 0.1323 |
| 126308 | MOB3A | P5T-E | Human | Esophagus | ESCC | 5.26e-06 | 4.91e-02 | 0.1327 |
| 126308 | MOB3A | P8T-E | Human | Esophagus | ESCC | 1.84e-03 | 5.14e-02 | 0.0889 |
| 126308 | MOB3A | P9T-E | Human | Esophagus | ESCC | 1.90e-10 | 2.12e-01 | 0.1131 |
| 126308 | MOB3A | P10T-E | Human | Esophagus | ESCC | 1.87e-12 | 1.83e-01 | 0.116 |
| 126308 | MOB3A | P11T-E | Human | Esophagus | ESCC | 2.96e-17 | 3.28e-01 | 0.1426 |
| 126308 | MOB3A | P12T-E | Human | Esophagus | ESCC | 5.54e-12 | 2.61e-01 | 0.1122 |
| 126308 | MOB3A | P15T-E | Human | Esophagus | ESCC | 4.95e-16 | 3.28e-01 | 0.1149 |
| 126308 | MOB3A | P16T-E | Human | Esophagus | ESCC | 2.15e-07 | 9.19e-02 | 0.1153 |
| 126308 | MOB3A | P17T-E | Human | Esophagus | ESCC | 4.03e-15 | 4.35e-01 | 0.1278 |
| 126308 | MOB3A | P19T-E | Human | Esophagus | ESCC | 7.11e-07 | 4.43e-01 | 0.1662 |
| 126308 | MOB3A | P20T-E | Human | Esophagus | ESCC | 2.75e-16 | 2.54e-01 | 0.1124 |
| Page: 1 2 3 4 |
| Tissue | Expression Dynamics | Abbreviation |
| Esophagus | 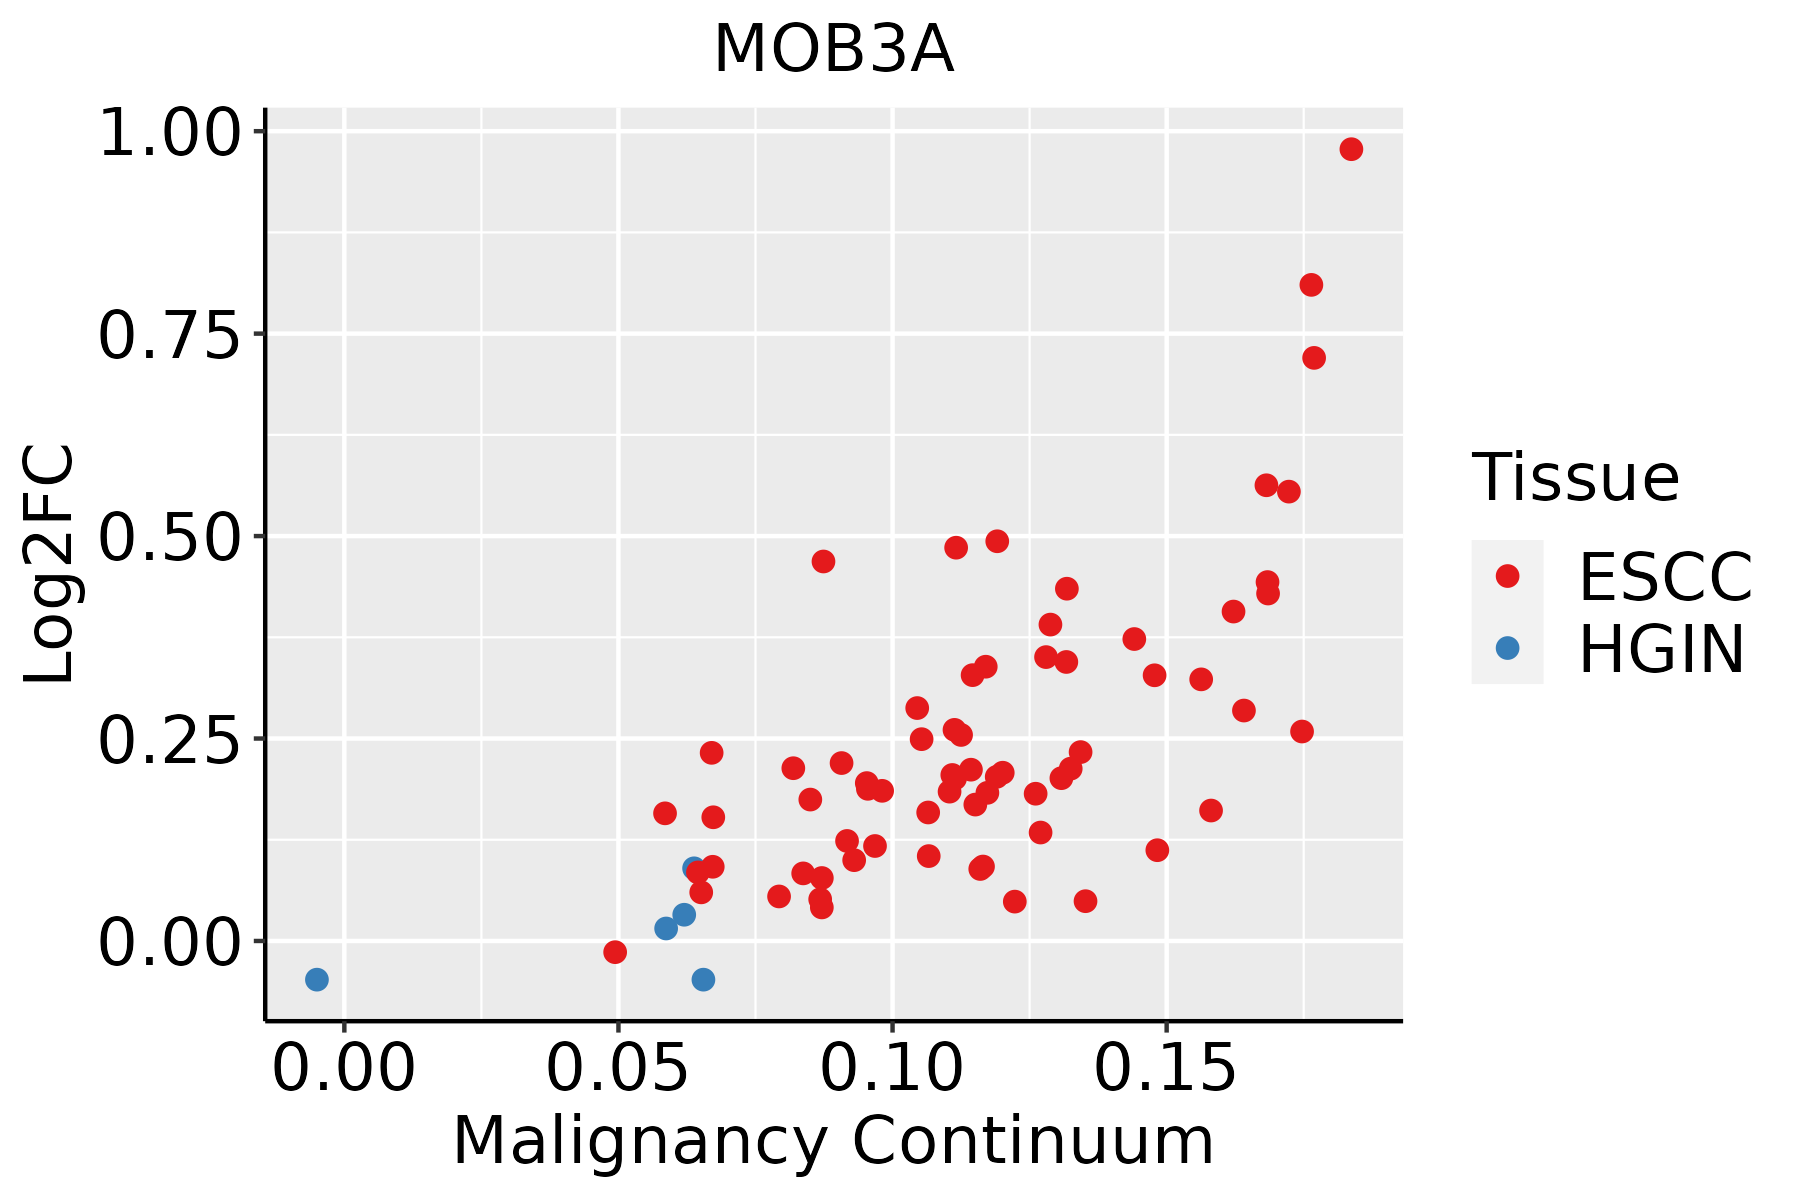 | ESCC: Esophageal squamous cell carcinoma |
| HGIN: High-grade intraepithelial neoplasias | ||
| LGIN: Low-grade intraepithelial neoplasias | ||
| Oral Cavity | 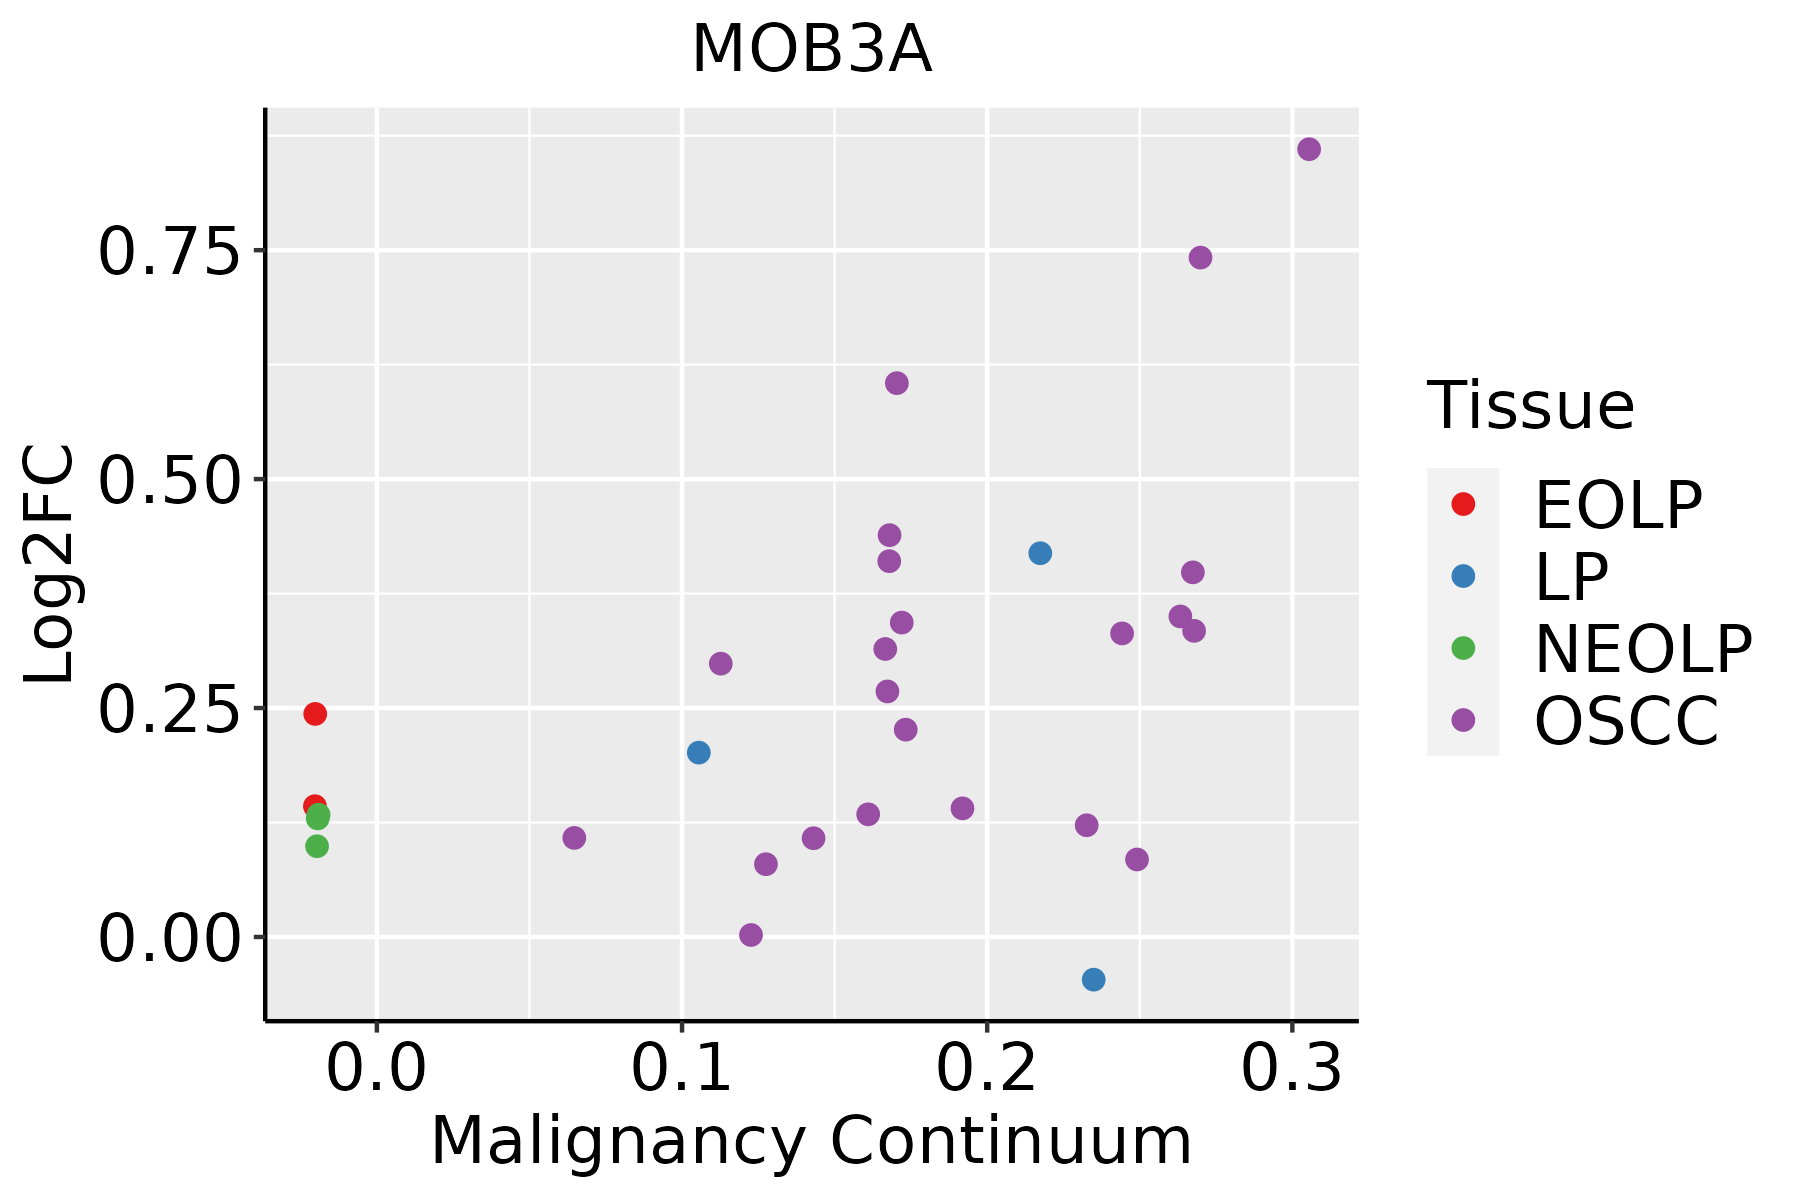 | EOLP: Erosive Oral lichen planus |
| LP: leukoplakia | ||
| NEOLP: Non-erosive oral lichen planus | ||
| OSCC: Oral squamous cell carcinoma |
| ∗log2FC in expression of this searched gene in stem-like cells from each diseased tissue sample relative to stem-like cells in normal samples in each tissue plotted against the malignancy continuum. Samples are colored based on if they are from different disease stage. |
Top |
Malignant transformation related pathway analysis |
| Find out the enriched GO biological processes and KEGG pathways involved in transition from healthy to precancer to cancer |
| Tissue | Disease Stage | Enriched GO biological Processes |
| Colorectum | AD |  |
| Colorectum | SER |  |
| Colorectum | MSS |  |
| Colorectum | MSI-H |  |
| Colorectum | FAP |  |
| ∗Top 15 enriched GO BP terms are showed in the bar plot of each disease state in each tissue. Each row represents a significant GO biological process which is colored according to the -log10(p.adjust). |
| Page: 1 2 3 4 5 6 7 8 9 |
| GO ID | Tissue | Disease Stage | Description | Gene Ratio | Bg Ratio | pvalue | p.adjust | Count |
| Page: 1 |
| Pathway ID | Tissue | Disease Stage | Description | Gene Ratio | Bg Ratio | pvalue | p.adjust | qvalue | Count |
| Page: 1 |
Top |
Cell-cell communication analysis |
| Identification of potential cell-cell interactions between two cell types and their ligand-receptor pairs for different disease states |
| Ligand | Receptor | LRpair | Pathway | Tissue | Disease Stage |
| Page: 1 |
Top |
Single-cell gene regulatory network inference analysis |
| Find out the significant the regulons (TFs) and the target genes of each regulon across cell types for different disease states |
| TF | Cell Type | Tissue | Disease Stage | Target Gene | RSS | Regulon Activity |
| ∗The dot plots of a searched regulon are shown for all cell subpopulations in each disease state of each tissue based on the regulon specific score inferred using pySCENIC and by calculating the average expression. |
| Page: 1 |
Top |
Somatic mutation of malignant transformation related genes |
| Annotation of somatic variants for genes involved in malignant transformation |
| Hugo Symbol | Variant Class | Variant Classification | dbSNP RS | HGVSc | HGVSp | HGVSp Short | SWISSPROT | BIOTYPE | SIFT | PolyPhen | Tumor Sample Barcode | Tissue | Histology | Sex | Age | Stage | Therapy Types | Drugs | Outcome |
| MOB3A | SNV | Missense_Mutation | novel | c.526C>A | p.Gln176Lys | p.Q176K | Q96BX8 | protein_coding | tolerated(0.63) | benign(0.027) | TCGA-D8-A145-01 | Breast | breast invasive carcinoma | Female | >=65 | I/II | Hormone Therapy | tamoxiphen | SD |
| MOB3A | insertion | Frame_Shift_Ins | novel | c.213_214insCTGGA | p.Val72LeufsTer53 | p.V72Lfs*53 | Q96BX8 | protein_coding | TCGA-BH-A0B1-01 | Breast | breast invasive carcinoma | Female | >=65 | I/II | Chemotherapy | adriamycin | SD | ||
| MOB3A | insertion | In_Frame_Ins | novel | c.211_212insCAAAGCAGAGAATGACAGGATCAGCATCAG | p.Arg71delinsProLysGlnArgMetThrGlySerAlaSerGly | p.R71delinsPKQRMTGSASG | Q96BX8 | protein_coding | TCGA-BH-A0B1-01 | Breast | breast invasive carcinoma | Female | >=65 | I/II | Chemotherapy | adriamycin | SD | ||
| MOB3A | deletion | Frame_Shift_Del | novel | c.230delN | p.Gly77AlafsTer46 | p.G77Afs*46 | Q96BX8 | protein_coding | TCGA-EW-A2FV-01 | Breast | breast invasive carcinoma | Female | <65 | III/IV | Chemotherapy | docetaxel | SD | ||
| MOB3A | SNV | Missense_Mutation | rs769636520 | c.299N>A | p.Arg100His | p.R100H | Q96BX8 | protein_coding | tolerated(0.74) | benign(0.081) | TCGA-2W-A8YY-01 | Cervix | cervical & endocervical cancer | Female | <65 | I/II | Chemotherapy | cisplatin | CR |
| MOB3A | SNV | Missense_Mutation | rs199931377 | c.383N>T | p.Ala128Val | p.A128V | Q96BX8 | protein_coding | tolerated(0.46) | benign(0) | TCGA-AA-3815-01 | Colorectum | colon adenocarcinoma | Female | >=65 | I/II | Unknown | Unknown | SD |
| MOB3A | SNV | Missense_Mutation | rs762563833 | c.524N>T | p.Ala175Val | p.A175V | Q96BX8 | protein_coding | tolerated(1) | benign(0.003) | TCGA-AZ-6601-01 | Colorectum | colon adenocarcinoma | Male | >=65 | I/II | Unknown | Unknown | PD |
| MOB3A | SNV | Missense_Mutation | rs777437440 | c.211N>T | p.Arg71Cys | p.R71C | Q96BX8 | protein_coding | deleterious(0) | probably_damaging(1) | TCGA-AZ-6601-01 | Colorectum | colon adenocarcinoma | Male | >=65 | I/II | Unknown | Unknown | PD |
| MOB3A | SNV | Missense_Mutation | c.104C>T | p.Ala35Val | p.A35V | Q96BX8 | protein_coding | deleterious(0.04) | probably_damaging(1) | TCGA-D5-6930-01 | Colorectum | colon adenocarcinoma | Male | >=65 | I/II | Unknown | Unknown | SD | |
| MOB3A | SNV | Missense_Mutation | rs772099363 | c.244N>A | p.Gly82Ser | p.G82S | Q96BX8 | protein_coding | deleterious(0.04) | benign(0.003) | TCGA-G4-6315-01 | Colorectum | colon adenocarcinoma | Male | >=65 | III/IV | Chemotherapy | fluorouracil | SD |
| Page: 1 2 3 |
Top |
Related drugs of malignant transformation related genes |
| Identification of chemicals and drugs interact with genes involved in malignant transfromation |
| (DGIdb 4.0) |
| Entrez ID | Symbol | Category | Interaction Types | Drug Claim Name | Drug Name | PMIDs |
| Page: 1 |

Copyright 2023-Present -The University of Texas Health Science Center at Houston |