
|
|||||
|
 | |
| |
| |
| |
| |
| |
|
Gene: MOB1B |
Gene summary for MOB1B |
| Gene information | Species | Human | Gene symbol | MOB1B | Gene ID | 92597 |
| Gene name | MOB kinase activator 1B | |
| Gene Alias | MATS2 | |
| Cytomap | 4q13.3 | |
| Gene Type | protein-coding | GO ID | GO:0001932 | UniProtAcc | Q7L9L4 |
Top |
Malignant transformation analysis |
| Identification of the aberrant gene expression in precancerous and cancerous lesions by comparing the gene expression of stem-like cells in diseased tissues with normal stem cells |
| Entrez ID | Symbol | Replicates | Species | Organ | Tissue | Adj P-value | Log2FC | Malignancy |
| 92597 | MOB1B | male-WTA | Human | Thyroid | PTC | 4.48e-10 | 7.33e-02 | 0.1037 |
| 92597 | MOB1B | PTC04 | Human | Thyroid | PTC | 4.89e-09 | 1.94e-01 | 0.1927 |
| 92597 | MOB1B | PTC05 | Human | Thyroid | PTC | 2.78e-08 | 3.73e-01 | 0.2065 |
| 92597 | MOB1B | PTC06 | Human | Thyroid | PTC | 1.22e-09 | 2.13e-01 | 0.2057 |
| 92597 | MOB1B | PTC07 | Human | Thyroid | PTC | 3.60e-27 | 1.59e-01 | 0.2044 |
| 92597 | MOB1B | ATC12 | Human | Thyroid | ATC | 1.36e-07 | 2.22e-02 | 0.34 |
| 92597 | MOB1B | ATC13 | Human | Thyroid | ATC | 1.29e-19 | 3.32e-01 | 0.34 |
| 92597 | MOB1B | ATC2 | Human | Thyroid | ATC | 2.28e-04 | 5.66e-01 | 0.34 |
| 92597 | MOB1B | ATC3 | Human | Thyroid | ATC | 1.14e-02 | 1.18e-01 | 0.338 |
| 92597 | MOB1B | ATC4 | Human | Thyroid | ATC | 2.30e-09 | 5.55e-02 | 0.34 |
| 92597 | MOB1B | ATC5 | Human | Thyroid | ATC | 1.01e-33 | 3.70e-01 | 0.34 |
| Page: 1 |
| Tissue | Expression Dynamics | Abbreviation |
| Thyroid | 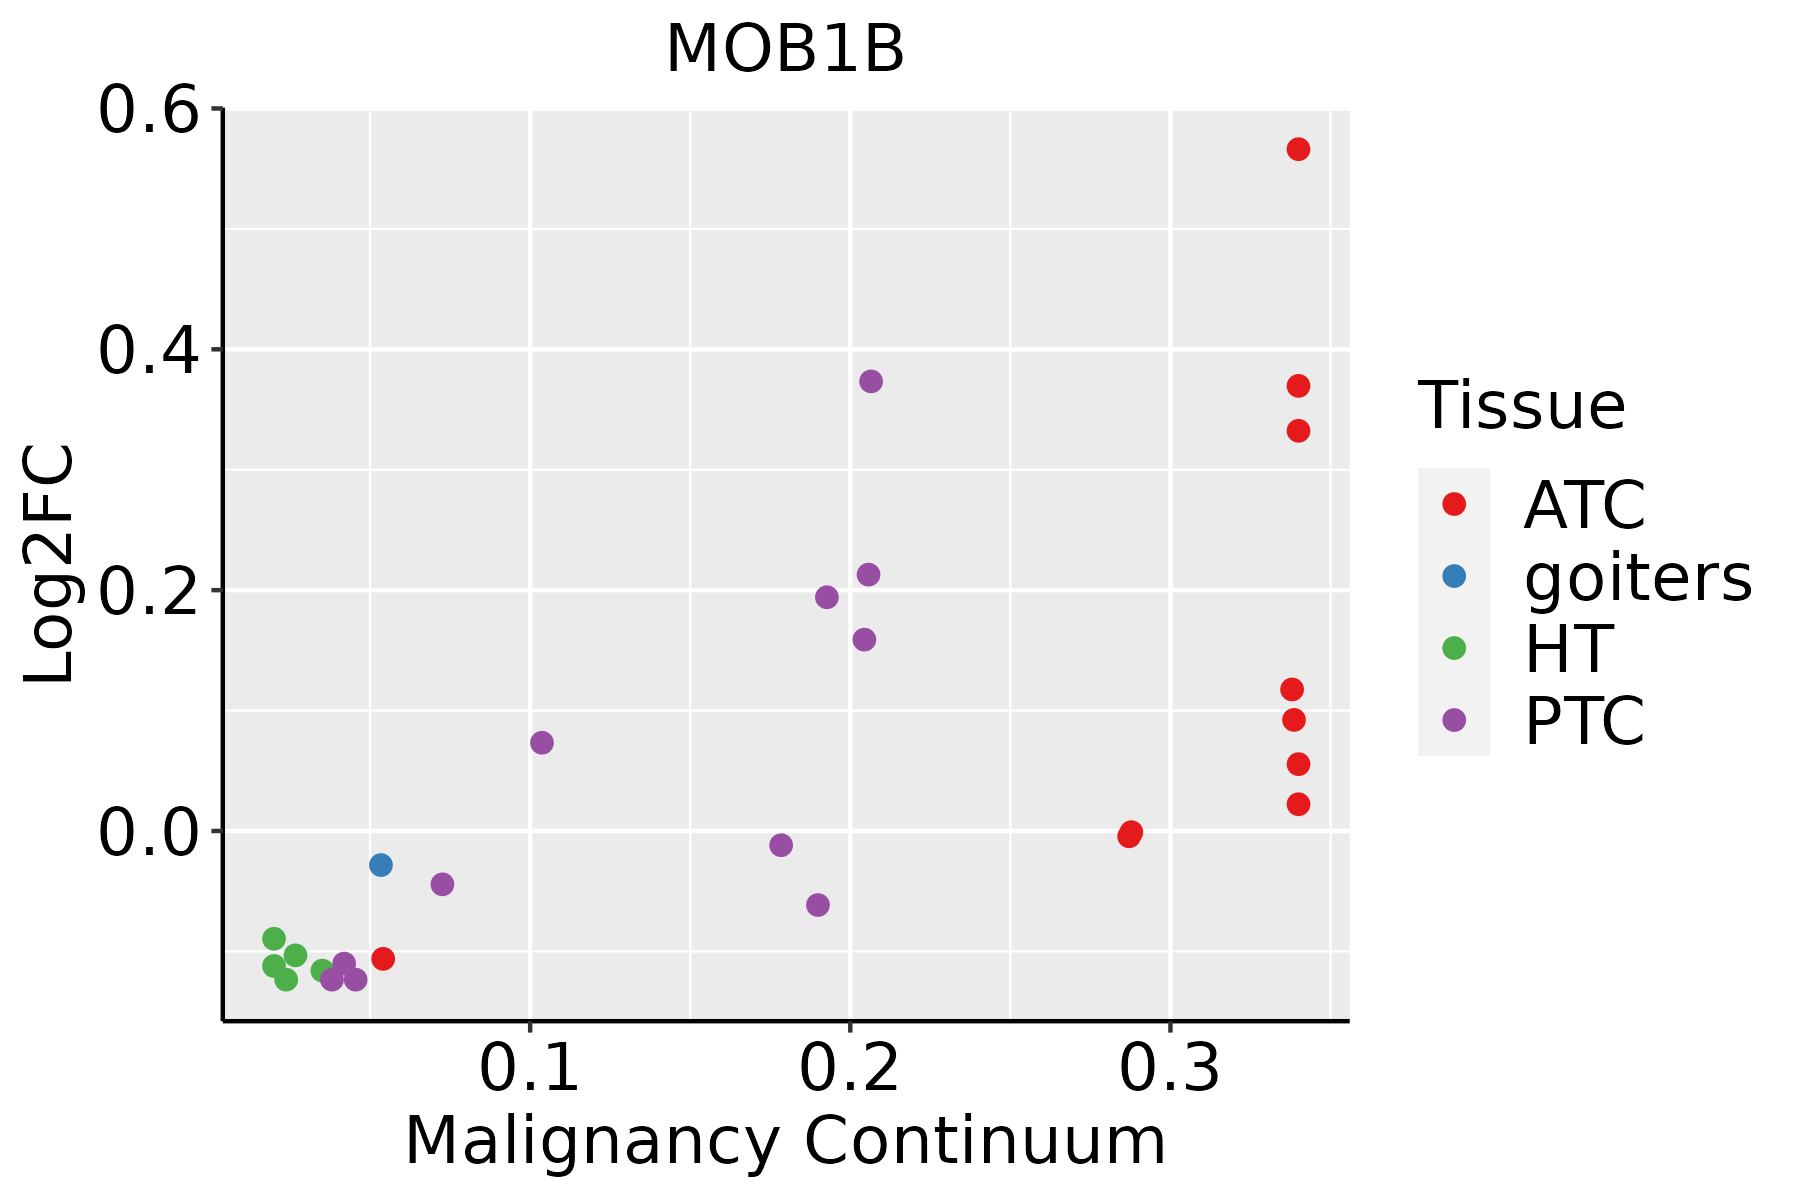 | ATC: Anaplastic thyroid cancer |
| HT: Hashimoto's thyroiditis | ||
| PTC: Papillary thyroid cancer |
| ∗log2FC in expression of this searched gene in stem-like cells from each diseased tissue sample relative to stem-like cells in normal samples in each tissue plotted against the malignancy continuum. Samples are colored based on if they are from different disease stage. |
Top |
Malignant transformation related pathway analysis |
| Find out the enriched GO biological processes and KEGG pathways involved in transition from healthy to precancer to cancer |
| Tissue | Disease Stage | Enriched GO biological Processes |
| Colorectum | AD |  |
| Colorectum | SER |  |
| Colorectum | MSS |  |
| Colorectum | MSI-H |  |
| Colorectum | FAP |  |
| ∗Top 15 enriched GO BP terms are showed in the bar plot of each disease state in each tissue. Each row represents a significant GO biological process which is colored according to the -log10(p.adjust). |
| Page: 1 2 3 4 5 6 7 8 9 |
| GO ID | Tissue | Disease Stage | Description | Gene Ratio | Bg Ratio | pvalue | p.adjust | Count |
| GO:004677716 | Thyroid | PTC | protein autophosphorylation | 110/5968 | 227/18723 | 1.25e-07 | 2.44e-06 | 110 |
| GO:0033674111 | Thyroid | PTC | positive regulation of kinase activity | 201/5968 | 467/18723 | 1.95e-07 | 3.54e-06 | 201 |
| GO:00319522 | Thyroid | PTC | regulation of protein autophosphorylation | 26/5968 | 43/18723 | 1.04e-04 | 8.42e-04 | 26 |
| GO:003532912 | Thyroid | PTC | hippo signaling | 24/5968 | 40/18723 | 2.27e-04 | 1.65e-03 | 24 |
| GO:003367427 | Thyroid | ATC | positive regulation of kinase activity | 212/6293 | 467/18723 | 5.89e-08 | 1.05e-06 | 212 |
| GO:004677717 | Thyroid | ATC | protein autophosphorylation | 114/6293 | 227/18723 | 1.54e-07 | 2.49e-06 | 114 |
| GO:003195211 | Thyroid | ATC | regulation of protein autophosphorylation | 26/6293 | 43/18723 | 2.76e-04 | 1.77e-03 | 26 |
| GO:003532921 | Thyroid | ATC | hippo signaling | 24/6293 | 40/18723 | 5.54e-04 | 3.20e-03 | 24 |
| Page: 1 |
| Pathway ID | Tissue | Disease Stage | Description | Gene Ratio | Bg Ratio | pvalue | p.adjust | qvalue | Count |
| Page: 1 |
Top |
Cell-cell communication analysis |
| Identification of potential cell-cell interactions between two cell types and their ligand-receptor pairs for different disease states |
| Ligand | Receptor | LRpair | Pathway | Tissue | Disease Stage |
| Page: 1 |
Top |
Single-cell gene regulatory network inference analysis |
| Find out the significant the regulons (TFs) and the target genes of each regulon across cell types for different disease states |
| TF | Cell Type | Tissue | Disease Stage | Target Gene | RSS | Regulon Activity |
| ∗The dot plots of a searched regulon are shown for all cell subpopulations in each disease state of each tissue based on the regulon specific score inferred using pySCENIC and by calculating the average expression. |
| Page: 1 |
Top |
Somatic mutation of malignant transformation related genes |
| Annotation of somatic variants for genes involved in malignant transformation |
| Hugo Symbol | Variant Class | Variant Classification | dbSNP RS | HGVSc | HGVSp | HGVSp Short | SWISSPROT | BIOTYPE | SIFT | PolyPhen | Tumor Sample Barcode | Tissue | Histology | Sex | Age | Stage | Therapy Types | Drugs | Outcome |
| MOB1B | SNV | Missense_Mutation | c.568C>T | p.His190Tyr | p.H190Y | Q7L9L4 | protein_coding | deleterious(0.02) | probably_damaging(0.999) | TCGA-A7-A0CJ-01 | Breast | breast invasive carcinoma | Female | <65 | I/II | Chemotherapy | cytoxan | SD | |
| MOB1B | SNV | Missense_Mutation | c.356N>G | p.Tyr119Cys | p.Y119C | Q7L9L4 | protein_coding | deleterious(0) | probably_damaging(1) | TCGA-AO-A03V-01 | Breast | breast invasive carcinoma | Female | <65 | I/II | Chemotherapy | fluorouracil | SD | |
| MOB1B | SNV | Missense_Mutation | c.109N>A | p.Ala37Thr | p.A37T | Q7L9L4 | protein_coding | deleterious(0.05) | benign(0.327) | TCGA-CK-5916-01 | Colorectum | colon adenocarcinoma | Female | >=65 | I/II | Unknown | Unknown | PD | |
| MOB1B | SNV | Missense_Mutation | c.423T>G | p.Ile141Met | p.I141M | Q7L9L4 | protein_coding | tolerated(0.05) | possibly_damaging(0.574) | TCGA-A5-A0GP-01 | Endometrium | uterine corpus endometrioid carcinoma | Female | <65 | I/II | Unknown | Unknown | SD | |
| MOB1B | SNV | Missense_Mutation | novel | c.169N>T | p.Asp57Tyr | p.D57Y | Q7L9L4 | protein_coding | deleterious(0) | probably_damaging(0.995) | TCGA-A5-A2K5-01 | Endometrium | uterine corpus endometrioid carcinoma | Female | >=65 | I/II | Unknown | Unknown | SD |
| MOB1B | SNV | Missense_Mutation | novel | c.551N>C | p.Leu184Pro | p.L184P | Q7L9L4 | protein_coding | deleterious(0) | probably_damaging(1) | TCGA-B5-A1MX-01 | Endometrium | uterine corpus endometrioid carcinoma | Female | <65 | I/II | Hormone Therapy | megace | SD |
| MOB1B | SNV | Missense_Mutation | c.47N>C | p.Lys16Thr | p.K16T | Q7L9L4 | protein_coding | deleterious(0.02) | benign(0.063) | TCGA-D1-A103-01 | Endometrium | uterine corpus endometrioid carcinoma | Female | >=65 | I/II | Unknown | Unknown | SD | |
| MOB1B | SNV | Missense_Mutation | c.631N>A | p.Glu211Lys | p.E211K | Q7L9L4 | protein_coding | deleterious(0.02) | benign(0.132) | TCGA-93-8067-01 | Lung | lung adenocarcinoma | Male | >=65 | I/II | Unknown | Unknown | SD | |
| MOB1B | SNV | Missense_Mutation | novel | c.139N>T | p.Arg47Trp | p.R47W | Q7L9L4 | protein_coding | deleterious(0) | probably_damaging(0.991) | TCGA-97-7941-01 | Lung | lung adenocarcinoma | Female | >=65 | I/II | Unknown | Unknown | SD |
| MOB1B | SNV | Missense_Mutation | c.550N>G | p.Leu184Val | p.L184V | Q7L9L4 | protein_coding | tolerated(0.34) | probably_damaging(0.964) | TCGA-97-A4M1-01 | Lung | lung adenocarcinoma | Female | <65 | I/II | Unknown | Unknown | SD |
| Page: 1 2 |
Top |
Related drugs of malignant transformation related genes |
| Identification of chemicals and drugs interact with genes involved in malignant transfromation |
| (DGIdb 4.0) |
| Entrez ID | Symbol | Category | Interaction Types | Drug Claim Name | Drug Name | PMIDs |
| Page: 1 |

Copyright 2023-Present -The University of Texas Health Science Center at Houston |