
|
|||||
|
 | |
| |
| |
| |
| |
| |
|
Gene: MOB1A |
Gene summary for MOB1A |
| Gene information | Species | Human | Gene symbol | MOB1A | Gene ID | 55233 |
| Gene name | MOB kinase activator 1A | |
| Gene Alias | C2orf6 | |
| Cytomap | 2p13.1 | |
| Gene Type | protein-coding | GO ID | GO:0001932 | UniProtAcc | Q9H8S9 |
Top |
Malignant transformation analysis |
| Identification of the aberrant gene expression in precancerous and cancerous lesions by comparing the gene expression of stem-like cells in diseased tissues with normal stem cells |
| Entrez ID | Symbol | Replicates | Species | Organ | Tissue | Adj P-value | Log2FC | Malignancy |
| 55233 | MOB1A | CA_HPV_1 | Human | Cervix | CC | 3.84e-07 | 1.62e-01 | 0.0264 |
| 55233 | MOB1A | CCI_1 | Human | Cervix | CC | 1.37e-02 | -4.62e-01 | 0.528 |
| 55233 | MOB1A | CCI_3 | Human | Cervix | CC | 3.54e-04 | -5.01e-01 | 0.516 |
| 55233 | MOB1A | CCII_1 | Human | Cervix | CC | 4.21e-16 | -6.25e-01 | 0.3249 |
| 55233 | MOB1A | L1 | Human | Cervix | CC | 1.50e-03 | -2.92e-01 | 0.0802 |
| 55233 | MOB1A | T1 | Human | Cervix | CC | 4.17e-11 | -4.67e-01 | 0.0918 |
| 55233 | MOB1A | LZE4T | Human | Esophagus | ESCC | 6.41e-27 | 1.17e+00 | 0.0811 |
| 55233 | MOB1A | LZE5T | Human | Esophagus | ESCC | 8.37e-04 | 5.17e-01 | 0.0514 |
| 55233 | MOB1A | LZE7T | Human | Esophagus | ESCC | 4.92e-10 | 8.49e-01 | 0.0667 |
| 55233 | MOB1A | LZE8T | Human | Esophagus | ESCC | 6.10e-10 | 6.08e-01 | 0.067 |
| 55233 | MOB1A | LZE20T | Human | Esophagus | ESCC | 1.29e-07 | 1.82e-01 | 0.0662 |
| 55233 | MOB1A | LZE22D1 | Human | Esophagus | HGIN | 3.17e-02 | 7.67e-02 | 0.0595 |
| 55233 | MOB1A | LZE22T | Human | Esophagus | ESCC | 9.16e-03 | 5.36e-01 | 0.068 |
| 55233 | MOB1A | LZE24T | Human | Esophagus | ESCC | 1.18e-28 | 1.03e+00 | 0.0596 |
| 55233 | MOB1A | LZE21T | Human | Esophagus | ESCC | 3.65e-06 | 7.94e-01 | 0.0655 |
| 55233 | MOB1A | LZE6T | Human | Esophagus | ESCC | 7.63e-08 | 8.55e-01 | 0.0845 |
| 55233 | MOB1A | P1T-E | Human | Esophagus | ESCC | 3.15e-07 | 7.64e-01 | 0.0875 |
| 55233 | MOB1A | P2T-E | Human | Esophagus | ESCC | 7.61e-55 | 1.14e+00 | 0.1177 |
| 55233 | MOB1A | P4T-E | Human | Esophagus | ESCC | 4.63e-50 | 1.35e+00 | 0.1323 |
| 55233 | MOB1A | P5T-E | Human | Esophagus | ESCC | 2.54e-36 | 8.61e-01 | 0.1327 |
| Page: 1 2 3 4 5 6 7 |
| Tissue | Expression Dynamics | Abbreviation |
| Cervix |  | CC: Cervix cancer |
| HSIL_HPV: HPV-infected high-grade squamous intraepithelial lesions | ||
| N_HPV: HPV-infected normal cervix | ||
| Esophagus |  | ESCC: Esophageal squamous cell carcinoma |
| HGIN: High-grade intraepithelial neoplasias | ||
| LGIN: Low-grade intraepithelial neoplasias | ||
| Liver |  | HCC: Hepatocellular carcinoma |
| NAFLD: Non-alcoholic fatty liver disease | ||
| Oral Cavity | 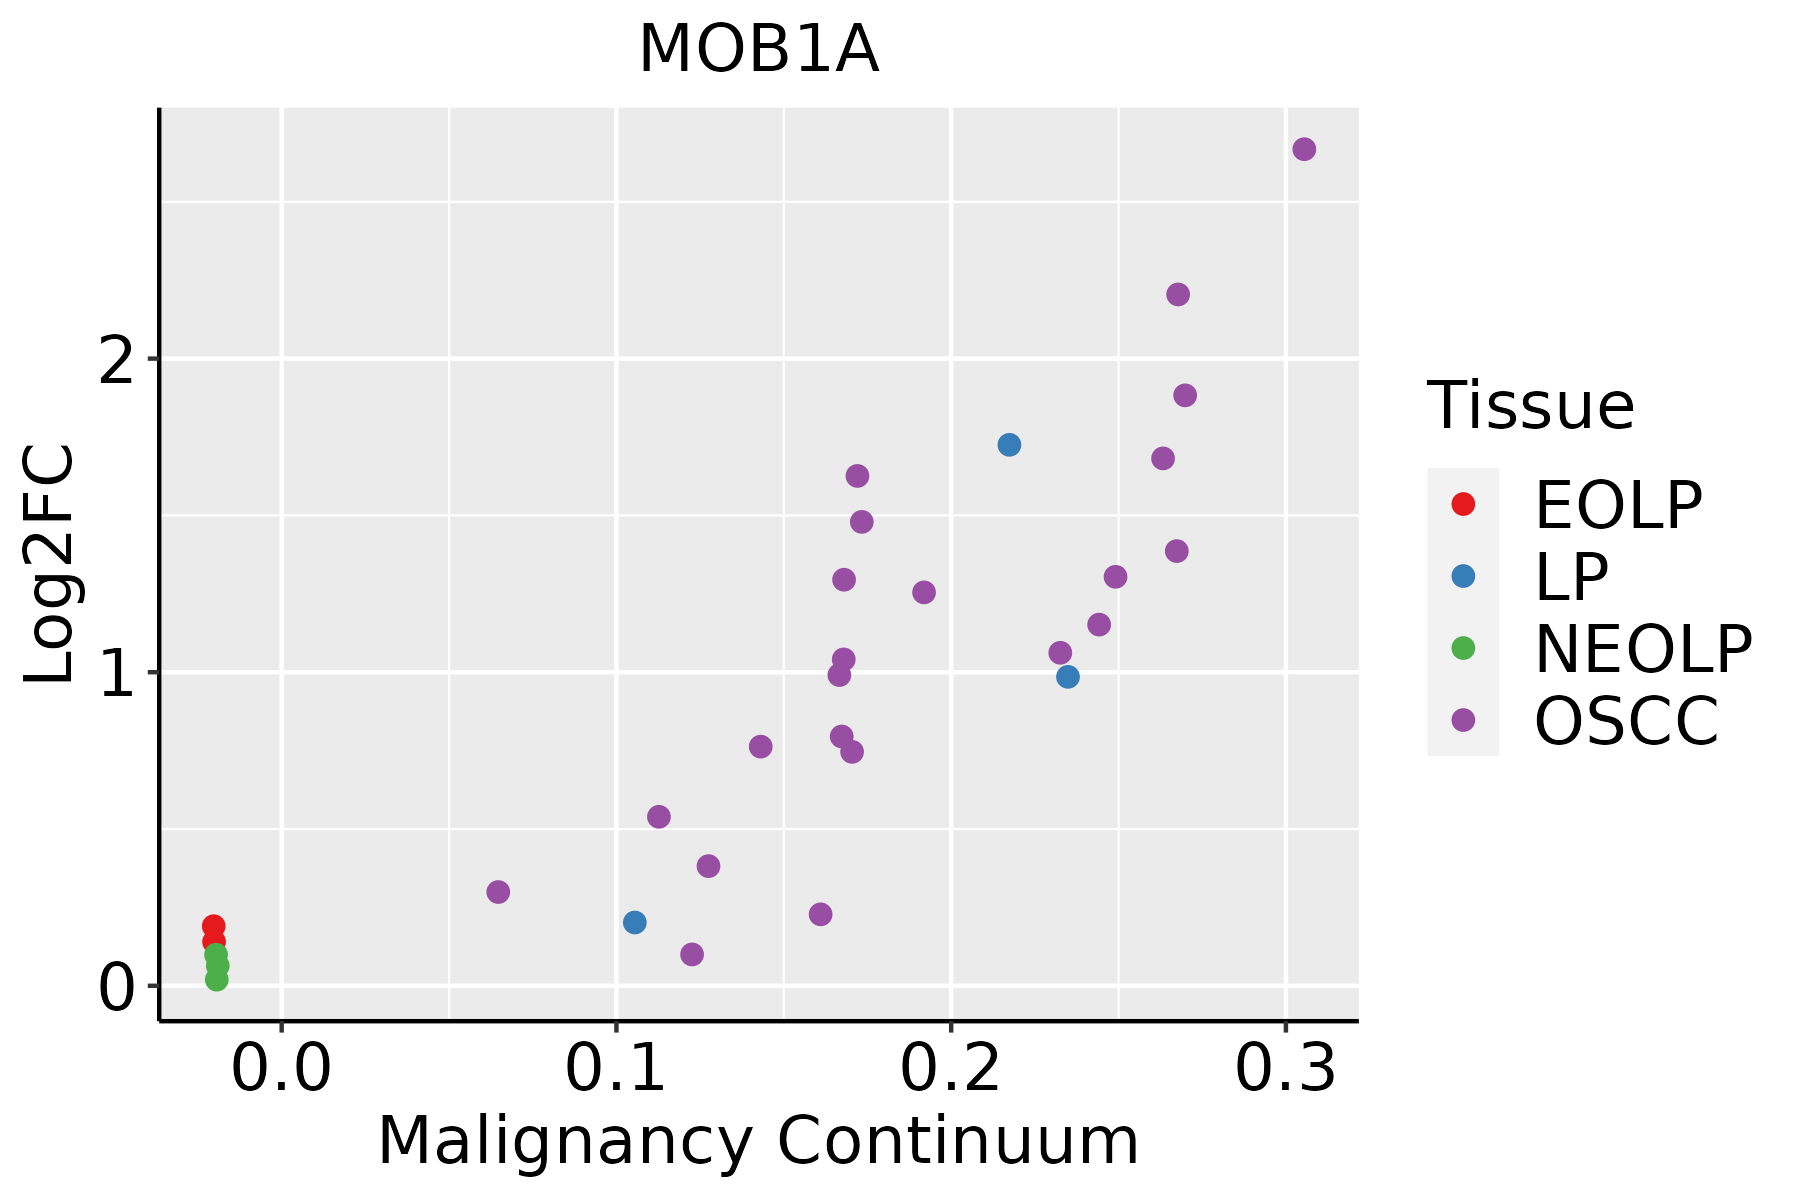 | EOLP: Erosive Oral lichen planus |
| LP: leukoplakia | ||
| NEOLP: Non-erosive oral lichen planus | ||
| OSCC: Oral squamous cell carcinoma | ||
| Skin | 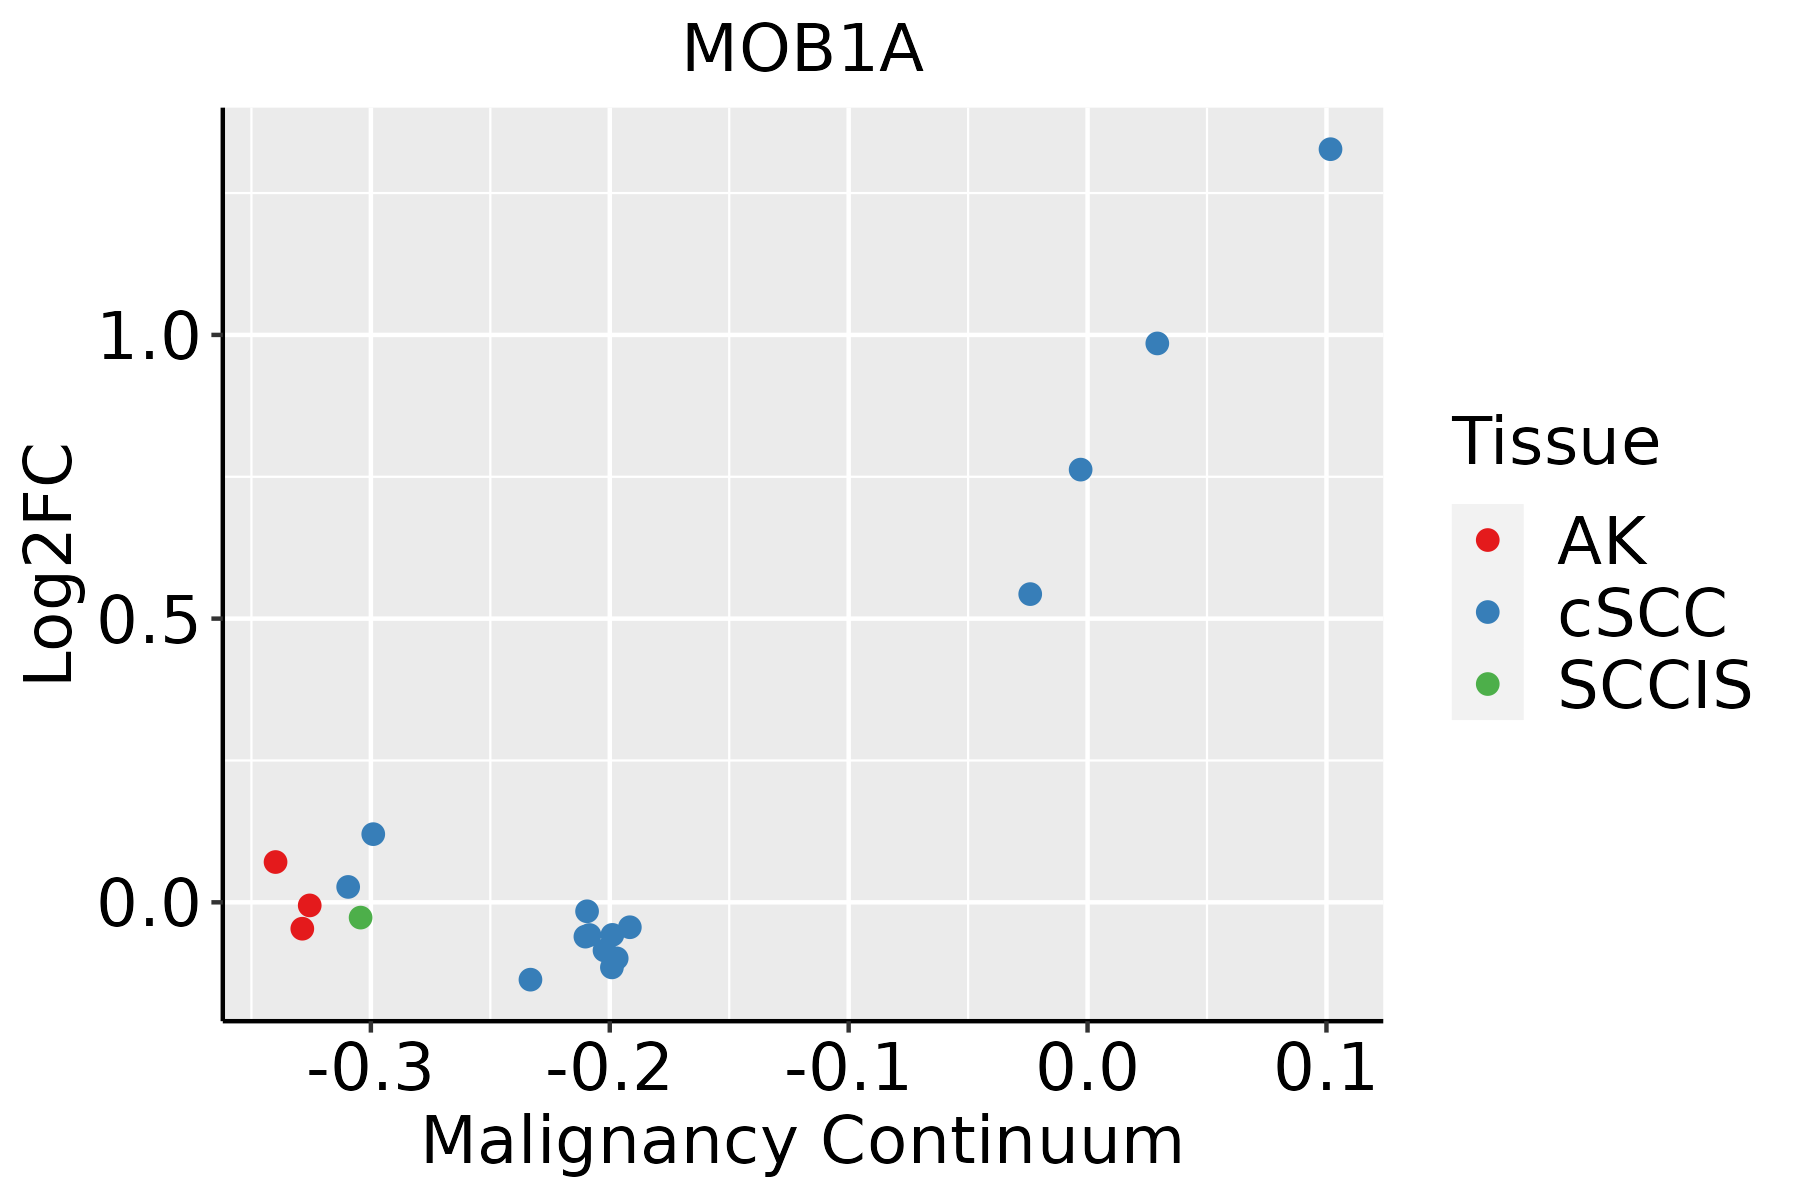 | AK: Actinic keratosis |
| cSCC: Cutaneous squamous cell carcinoma | ||
| SCCIS:squamous cell carcinoma in situ | ||
| Thyroid |  | ATC: Anaplastic thyroid cancer |
| HT: Hashimoto's thyroiditis | ||
| PTC: Papillary thyroid cancer |
| ∗log2FC in expression of this searched gene in stem-like cells from each diseased tissue sample relative to stem-like cells in normal samples in each tissue plotted against the malignancy continuum. Samples are colored based on if they are from different disease stage. |
Top |
Malignant transformation related pathway analysis |
| Find out the enriched GO biological processes and KEGG pathways involved in transition from healthy to precancer to cancer |
| Tissue | Disease Stage | Enriched GO biological Processes |
| Colorectum | AD |  |
| Colorectum | SER |  |
| Colorectum | MSS |  |
| Colorectum | MSI-H |  |
| Colorectum | FAP |  |
| ∗Top 15 enriched GO BP terms are showed in the bar plot of each disease state in each tissue. Each row represents a significant GO biological process which is colored according to the -log10(p.adjust). |
| Page: 1 2 3 4 5 6 7 8 9 |
| GO ID | Tissue | Disease Stage | Description | Gene Ratio | Bg Ratio | pvalue | p.adjust | Count |
| GO:00353294 | Cervix | CC | hippo signaling | 12/2311 | 40/18723 | 2.44e-03 | 1.71e-02 | 12 |
| GO:00353297 | Esophagus | ESCC | hippo signaling | 26/8552 | 40/18723 | 1.08e-02 | 3.66e-02 | 26 |
| GO:003532912 | Thyroid | PTC | hippo signaling | 24/5968 | 40/18723 | 2.27e-04 | 1.65e-03 | 24 |
| GO:003532921 | Thyroid | ATC | hippo signaling | 24/6293 | 40/18723 | 5.54e-04 | 3.20e-03 | 24 |
| Page: 1 |
| Pathway ID | Tissue | Disease Stage | Description | Gene Ratio | Bg Ratio | pvalue | p.adjust | qvalue | Count |
| hsa043908 | Cervix | CC | Hippo signaling pathway | 40/1267 | 157/8465 | 3.64e-04 | 1.82e-03 | 1.07e-03 | 40 |
| hsa0439013 | Cervix | CC | Hippo signaling pathway | 40/1267 | 157/8465 | 3.64e-04 | 1.82e-03 | 1.07e-03 | 40 |
| hsa0439018 | Esophagus | ESCC | Hippo signaling pathway | 92/4205 | 157/8465 | 1.46e-02 | 3.31e-02 | 1.69e-02 | 92 |
| hsa0439019 | Esophagus | ESCC | Hippo signaling pathway | 92/4205 | 157/8465 | 1.46e-02 | 3.31e-02 | 1.69e-02 | 92 |
| hsa0439016 | Oral cavity | OSCC | Hippo signaling pathway | 86/3704 | 157/8465 | 3.30e-03 | 8.24e-03 | 4.20e-03 | 86 |
| hsa0439017 | Oral cavity | OSCC | Hippo signaling pathway | 86/3704 | 157/8465 | 3.30e-03 | 8.24e-03 | 4.20e-03 | 86 |
| Page: 1 |
Top |
Cell-cell communication analysis |
| Identification of potential cell-cell interactions between two cell types and their ligand-receptor pairs for different disease states |
| Ligand | Receptor | LRpair | Pathway | Tissue | Disease Stage |
| Page: 1 |
Top |
Single-cell gene regulatory network inference analysis |
| Find out the significant the regulons (TFs) and the target genes of each regulon across cell types for different disease states |
| TF | Cell Type | Tissue | Disease Stage | Target Gene | RSS | Regulon Activity |
| ∗The dot plots of a searched regulon are shown for all cell subpopulations in each disease state of each tissue based on the regulon specific score inferred using pySCENIC and by calculating the average expression. |
| Page: 1 |
Top |
Somatic mutation of malignant transformation related genes |
| Annotation of somatic variants for genes involved in malignant transformation |
| Hugo Symbol | Variant Class | Variant Classification | dbSNP RS | HGVSc | HGVSp | HGVSp Short | SWISSPROT | BIOTYPE | SIFT | PolyPhen | Tumor Sample Barcode | Tissue | Histology | Sex | Age | Stage | Therapy Types | Drugs | Outcome |
| MOB1A | SNV | Missense_Mutation | c.48N>T | p.Lys16Asn | p.K16N | Q9H8S9 | protein_coding | deleterious(0) | benign(0.393) | TCGA-AN-A046-01 | Breast | breast invasive carcinoma | Female | >=65 | I/II | Unknown | Unknown | SD | |
| MOB1A | SNV | Missense_Mutation | novel | c.571N>G | p.Gln191Glu | p.Q191E | Q9H8S9 | protein_coding | tolerated(0.61) | benign(0.1) | TCGA-VS-A8EL-01 | Cervix | cervical & endocervical cancer | Female | <65 | I/II | Chemotherapy | cisplatin | CR |
| MOB1A | insertion | Frame_Shift_Ins | novel | c.411_412insCCAA | p.Val138ProfsTer32 | p.V138Pfs*32 | Q9H8S9 | protein_coding | TCGA-DS-A1OB-01 | Cervix | cervical & endocervical cancer | Female | <65 | I/II | Chemotherapy | carboplatin | PD | ||
| MOB1A | SNV | Missense_Mutation | c.192N>A | p.Phe64Leu | p.F64L | Q9H8S9 | protein_coding | deleterious(0.02) | probably_damaging(0.999) | TCGA-AG-A002-01 | Colorectum | rectum adenocarcinoma | Male | <65 | I/II | Unknown | Unknown | SD | |
| MOB1A | SNV | Missense_Mutation | novel | c.391N>A | p.Leu131Ile | p.L131I | Q9H8S9 | protein_coding | tolerated(1) | benign(0.014) | TCGA-AJ-A3EL-01 | Endometrium | uterine corpus endometrioid carcinoma | Female | <65 | I/II | Unknown | Unknown | SD |
| MOB1A | SNV | Missense_Mutation | c.48N>T | p.Lys16Asn | p.K16N | Q9H8S9 | protein_coding | deleterious(0) | benign(0.393) | TCGA-AX-A0J0-01 | Endometrium | uterine corpus endometrioid carcinoma | Female | <65 | I/II | Unknown | Unknown | SD | |
| MOB1A | SNV | Missense_Mutation | novel | c.17G>C | p.Ser6Thr | p.S6T | Q9H8S9 | protein_coding | tolerated(0.05) | benign(0.007) | TCGA-BK-A0CA-01 | Endometrium | uterine corpus endometrioid carcinoma | Female | <65 | III/IV | Chemotherapy | taxotere | SD |
| MOB1A | SNV | Missense_Mutation | novel | c.40N>G | p.Lys14Glu | p.K14E | Q9H8S9 | protein_coding | deleterious(0) | possibly_damaging(0.728) | TCGA-EO-A22U-01 | Endometrium | uterine corpus endometrioid carcinoma | Female | >=65 | I/II | Unknown | Unknown | SD |
| MOB1A | SNV | Missense_Mutation | novel | c.169N>T | p.Ile57Phe | p.I57F | Q9H8S9 | protein_coding | deleterious(0.01) | benign(0.319) | TCGA-78-8662-01 | Lung | lung adenocarcinoma | Female | <65 | I/II | Unknown | Unknown | PD |
| MOB1A | SNV | Missense_Mutation | novel | c.168N>T | p.Trp56Cys | p.W56C | Q9H8S9 | protein_coding | deleterious(0) | probably_damaging(1) | TCGA-78-8662-01 | Lung | lung adenocarcinoma | Female | <65 | I/II | Unknown | Unknown | PD |
| Page: 1 2 |
Top |
Related drugs of malignant transformation related genes |
| Identification of chemicals and drugs interact with genes involved in malignant transfromation |
| (DGIdb 4.0) |
| Entrez ID | Symbol | Category | Interaction Types | Drug Claim Name | Drug Name | PMIDs |
| Page: 1 |

Copyright 2023-Present -The University of Texas Health Science Center at Houston |