
|
|||||
|
 | |
| |
| |
| |
| |
| |
|
Gene: MNT |
Gene summary for MNT |
| Gene information | Species | Human | Gene symbol | MNT | Gene ID | 4335 |
| Gene name | MAX network transcriptional repressor | |
| Gene Alias | MAD6 | |
| Cytomap | 17p13.3 | |
| Gene Type | protein-coding | GO ID | GO:0000122 | UniProtAcc | Q99583 |
Top |
Malignant transformation analysis |
| Identification of the aberrant gene expression in precancerous and cancerous lesions by comparing the gene expression of stem-like cells in diseased tissues with normal stem cells |
| Entrez ID | Symbol | Replicates | Species | Organ | Tissue | Adj P-value | Log2FC | Malignancy |
| 4335 | MNT | C21 | Human | Oral cavity | OSCC | 1.89e-02 | 1.87e-01 | 0.2678 |
| 4335 | MNT | C30 | Human | Oral cavity | OSCC | 1.94e-17 | 7.92e-01 | 0.3055 |
| 4335 | MNT | C51 | Human | Oral cavity | OSCC | 1.25e-03 | 3.70e-01 | 0.2674 |
| 4335 | MNT | C07 | Human | Oral cavity | OSCC | 3.14e-02 | 4.06e-01 | 0.2491 |
| 4335 | MNT | C08 | Human | Oral cavity | OSCC | 1.83e-09 | 2.43e-01 | 0.1919 |
| 4335 | MNT | LP15 | Human | Oral cavity | LP | 1.97e-02 | 6.35e-01 | 0.2174 |
| 4335 | MNT | SYSMH1 | Human | Oral cavity | OSCC | 1.08e-07 | 2.65e-01 | 0.1127 |
| 4335 | MNT | SYSMH2 | Human | Oral cavity | OSCC | 8.29e-04 | 1.67e-01 | 0.2326 |
| 4335 | MNT | SYSMH3 | Human | Oral cavity | OSCC | 6.90e-15 | 4.36e-01 | 0.2442 |
| 4335 | MNT | male-WTA | Human | Thyroid | PTC | 1.47e-18 | 2.02e-01 | 0.1037 |
| 4335 | MNT | PTC01 | Human | Thyroid | PTC | 1.91e-04 | 1.23e-01 | 0.1899 |
| 4335 | MNT | PTC03 | Human | Thyroid | PTC | 2.82e-03 | 1.53e-01 | 0.1784 |
| 4335 | MNT | PTC04 | Human | Thyroid | PTC | 7.43e-16 | 3.06e-01 | 0.1927 |
| 4335 | MNT | PTC05 | Human | Thyroid | PTC | 2.13e-08 | 2.43e-01 | 0.2065 |
| 4335 | MNT | PTC06 | Human | Thyroid | PTC | 3.44e-28 | 6.97e-01 | 0.2057 |
| 4335 | MNT | PTC07 | Human | Thyroid | PTC | 1.23e-17 | 2.72e-01 | 0.2044 |
| 4335 | MNT | ATC09 | Human | Thyroid | ATC | 5.91e-06 | 2.09e-01 | 0.2871 |
| 4335 | MNT | ATC12 | Human | Thyroid | ATC | 1.30e-14 | 2.82e-01 | 0.34 |
| 4335 | MNT | ATC13 | Human | Thyroid | ATC | 1.14e-29 | 4.69e-01 | 0.34 |
| 4335 | MNT | ATC2 | Human | Thyroid | ATC | 1.14e-06 | 3.35e-01 | 0.34 |
| Page: 1 2 |
| Tissue | Expression Dynamics | Abbreviation |
| Oral Cavity | 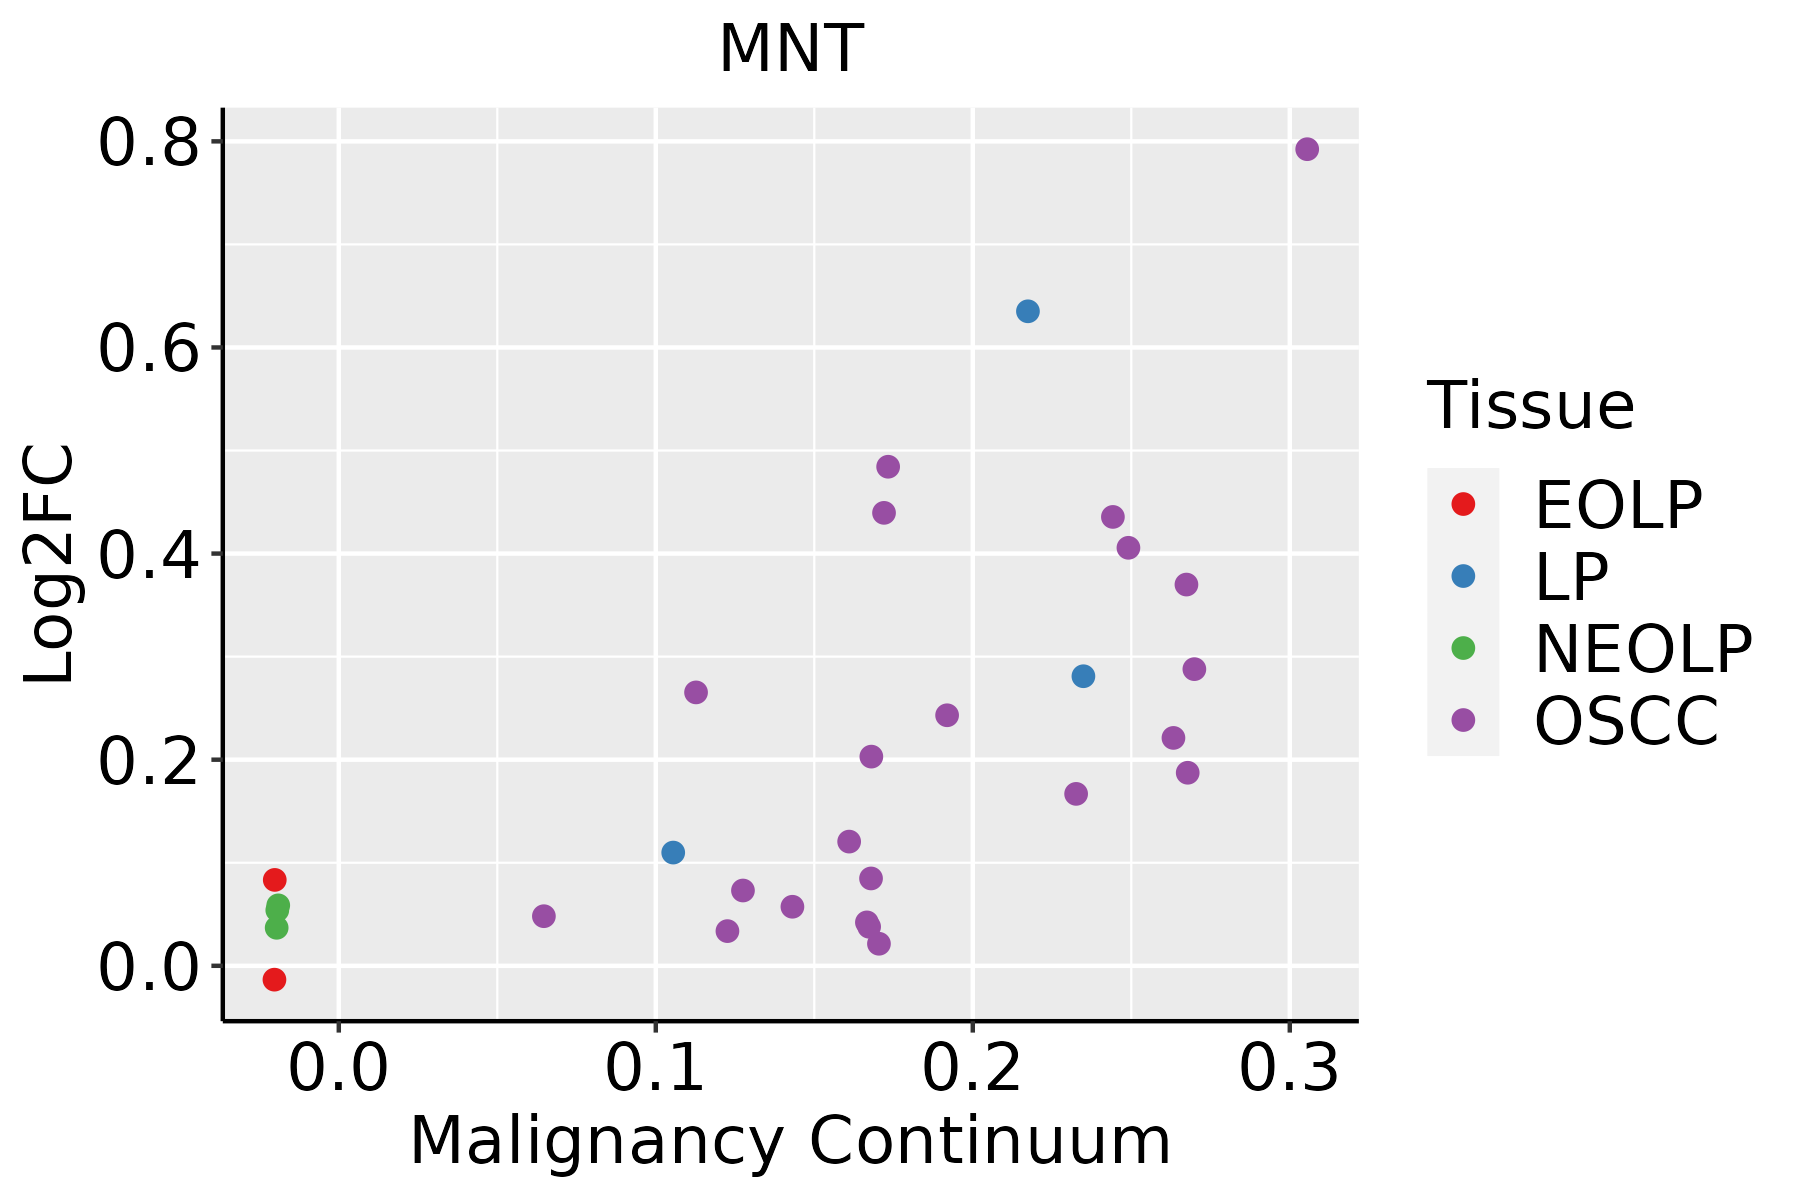 | EOLP: Erosive Oral lichen planus |
| LP: leukoplakia | ||
| NEOLP: Non-erosive oral lichen planus | ||
| OSCC: Oral squamous cell carcinoma | ||
| Thyroid | 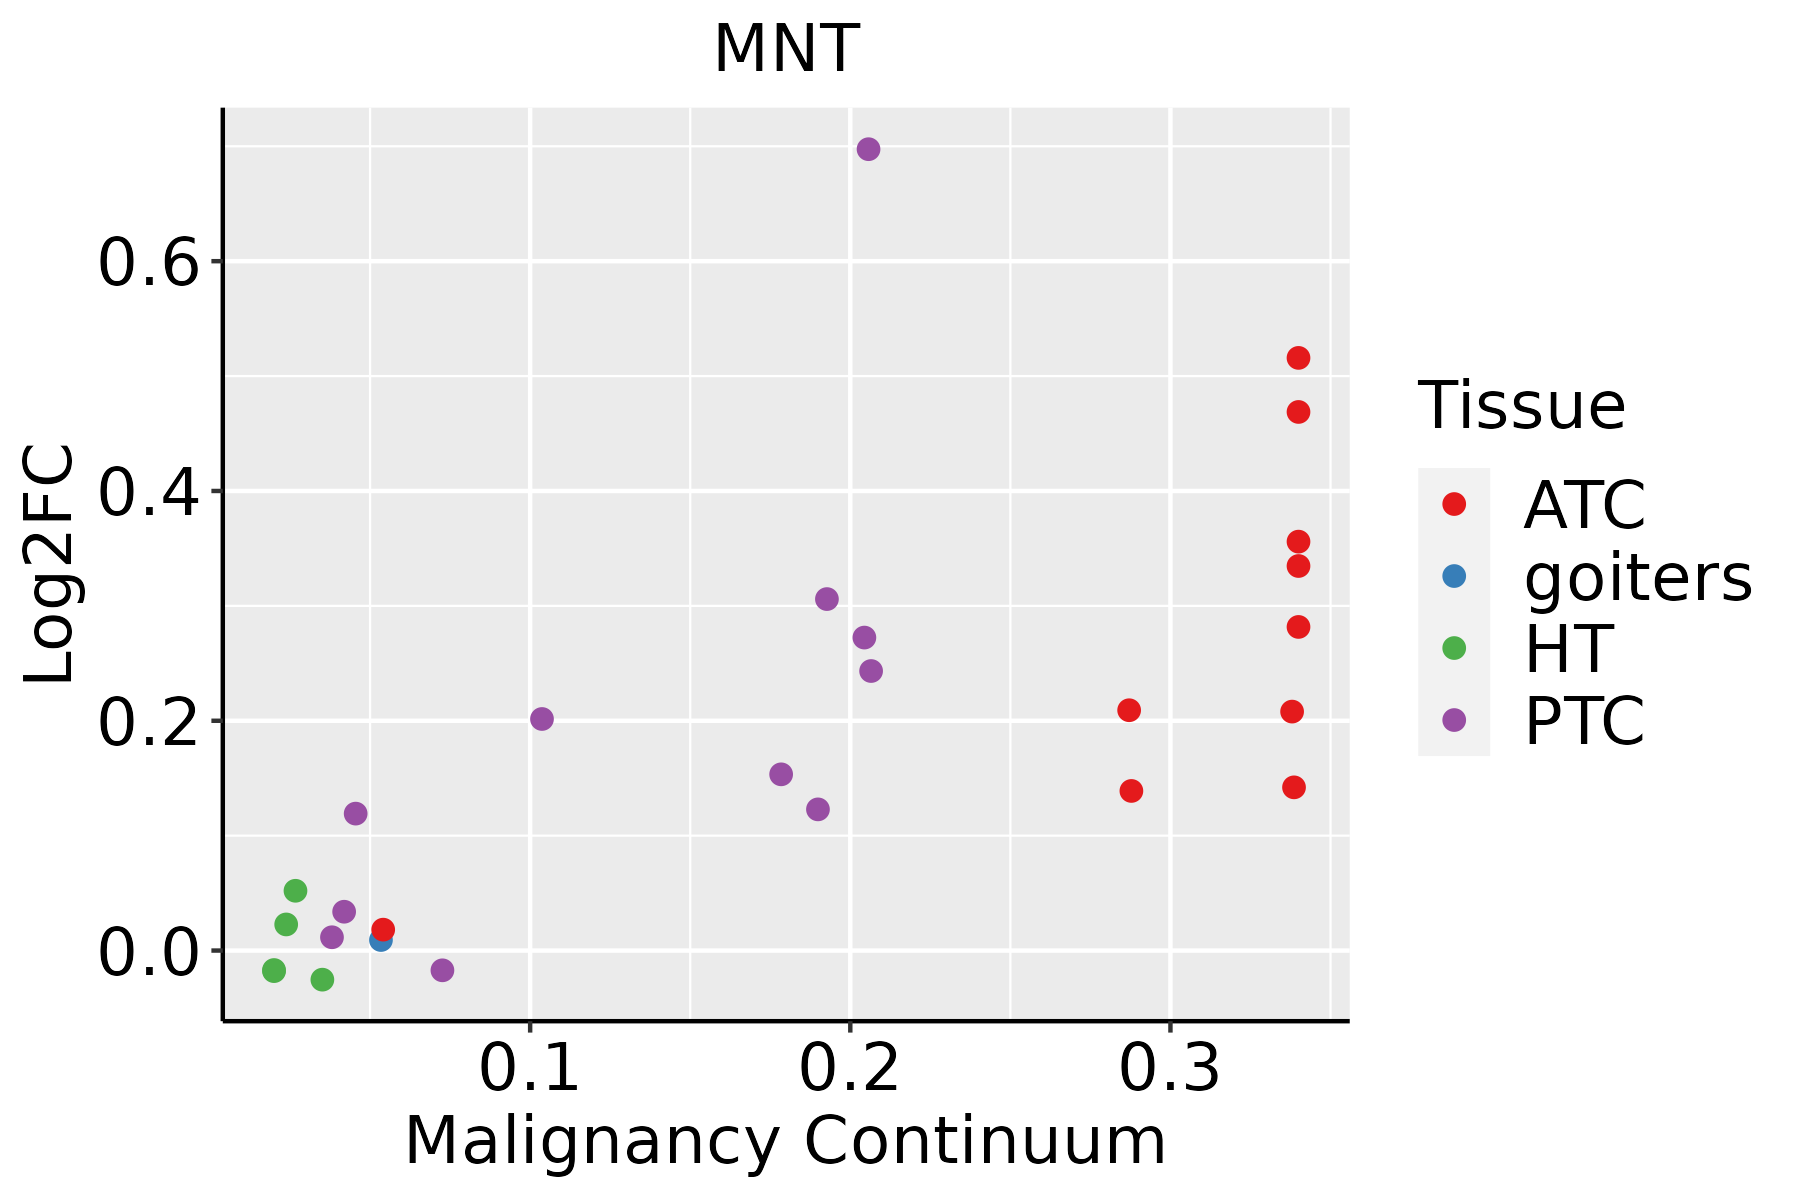 | ATC: Anaplastic thyroid cancer |
| HT: Hashimoto's thyroiditis | ||
| PTC: Papillary thyroid cancer |
| ∗log2FC in expression of this searched gene in stem-like cells from each diseased tissue sample relative to stem-like cells in normal samples in each tissue plotted against the malignancy continuum. Samples are colored based on if they are from different disease stage. |
Top |
Malignant transformation related pathway analysis |
| Find out the enriched GO biological processes and KEGG pathways involved in transition from healthy to precancer to cancer |
| Tissue | Disease Stage | Enriched GO biological Processes |
| Colorectum | AD |  |
| Colorectum | SER |  |
| Colorectum | MSS |  |
| Colorectum | MSI-H |  |
| Colorectum | FAP |  |
| ∗Top 15 enriched GO BP terms are showed in the bar plot of each disease state in each tissue. Each row represents a significant GO biological process which is colored according to the -log10(p.adjust). |
| Page: 1 2 3 4 5 6 7 8 9 |
| GO ID | Tissue | Disease Stage | Description | Gene Ratio | Bg Ratio | pvalue | p.adjust | Count |
| GO:200123320 | Oral cavity | OSCC | regulation of apoptotic signaling pathway | 242/7305 | 356/18723 | 6.66e-29 | 3.24e-26 | 242 |
| GO:200123420 | Oral cavity | OSCC | negative regulation of apoptotic signaling pathway | 148/7305 | 224/18723 | 1.71e-16 | 1.36e-14 | 148 |
| GO:000756818 | Oral cavity | OSCC | aging | 194/7305 | 339/18723 | 6.18e-12 | 2.33e-10 | 194 |
| GO:00075698 | Oral cavity | OSCC | cell aging | 73/7305 | 132/18723 | 1.05e-04 | 7.75e-04 | 73 |
| GO:2001233110 | Oral cavity | LP | regulation of apoptotic signaling pathway | 168/4623 | 356/18723 | 1.35e-20 | 3.02e-18 | 168 |
| GO:2001234110 | Oral cavity | LP | negative regulation of apoptotic signaling pathway | 102/4623 | 224/18723 | 7.22e-12 | 5.58e-10 | 102 |
| GO:000756819 | Oral cavity | LP | aging | 125/4623 | 339/18723 | 3.29e-07 | 9.62e-06 | 125 |
| GO:000756914 | Oral cavity | LP | cell aging | 46/4623 | 132/18723 | 5.64e-03 | 3.40e-02 | 46 |
| GO:2001233113 | Thyroid | PTC | regulation of apoptotic signaling pathway | 197/5968 | 356/18723 | 2.58e-20 | 3.69e-18 | 197 |
| GO:2001234113 | Thyroid | PTC | negative regulation of apoptotic signaling pathway | 124/5968 | 224/18723 | 2.57e-13 | 1.32e-11 | 124 |
| GO:0007568111 | Thyroid | PTC | aging | 153/5968 | 339/18723 | 1.80e-07 | 3.34e-06 | 153 |
| GO:000756917 | Thyroid | PTC | cell aging | 68/5968 | 132/18723 | 2.09e-06 | 2.84e-05 | 68 |
| GO:200123335 | Thyroid | ATC | regulation of apoptotic signaling pathway | 206/6293 | 356/18723 | 2.81e-21 | 5.92e-19 | 206 |
| GO:2001234210 | Thyroid | ATC | negative regulation of apoptotic signaling pathway | 129/6293 | 224/18723 | 1.26e-13 | 6.46e-12 | 129 |
| GO:000756829 | Thyroid | ATC | aging | 166/6293 | 339/18723 | 2.79e-09 | 6.60e-08 | 166 |
| GO:000756924 | Thyroid | ATC | cell aging | 72/6293 | 132/18723 | 5.77e-07 | 8.15e-06 | 72 |
| Page: 1 |
| Pathway ID | Tissue | Disease Stage | Description | Gene Ratio | Bg Ratio | pvalue | p.adjust | qvalue | Count |
| Page: 1 |
Top |
Cell-cell communication analysis |
| Identification of potential cell-cell interactions between two cell types and their ligand-receptor pairs for different disease states |
| Ligand | Receptor | LRpair | Pathway | Tissue | Disease Stage |
| Page: 1 |
Top |
Single-cell gene regulatory network inference analysis |
| Find out the significant the regulons (TFs) and the target genes of each regulon across cell types for different disease states |
| TF | Cell Type | Tissue | Disease Stage | Target Gene | RSS | Regulon Activity |
| MNT | TREG | Breast | ADJ | CTNNAL1,SLC27A2,CACNA1A, etc. | 8.05e-02 |  |
| MNT | CD4TN | Colorectum | CRC | C1orf162,GSN,UBN2, etc. | 2.85e-02 |  |
| MNT | cDC | Lung | IAC | IPP,LTB,AKAP5, etc. | 2.63e-02 |  |
| MNT | pDC | Lung | IAC | IPP,LTB,AKAP5, etc. | 8.97e-03 | |
| MNT | COR | Oral cavity | LP | CFB,TMEM41A,FSD1L, etc. | 2.04e-01 |  |
| MNT | PMC | Stomach | GC | LINC02614,ABCG1,SH3BP2, etc. | 3.35e-01 |  |
| MNT | MAIT | Stomach | CAG with IM | RGL4,CUL1,TIMP3, etc. | 4.66e-02 |  |
| MNT | BN | Stomach | WIM | RGL4,CUL1,TIMP3, etc. | 1.13e-01 |  |
| ∗The dot plots of a searched regulon are shown for all cell subpopulations in each disease state of each tissue based on the regulon specific score inferred using pySCENIC and by calculating the average expression. |
| Page: 1 |
Top |
Somatic mutation of malignant transformation related genes |
| Annotation of somatic variants for genes involved in malignant transformation |
| Hugo Symbol | Variant Class | Variant Classification | dbSNP RS | HGVSc | HGVSp | HGVSp Short | SWISSPROT | BIOTYPE | SIFT | PolyPhen | Tumor Sample Barcode | Tissue | Histology | Sex | Age | Stage | Therapy Types | Drugs | Outcome |
| MNT | SNV | Missense_Mutation | rs772821045 | c.985N>C | p.Thr329Pro | p.T329P | Q99583 | protein_coding | deleterious(0) | probably_damaging(0.991) | TCGA-A7-A4SB-01 | Breast | breast invasive carcinoma | Female | <65 | III/IV | Chemotherapy | docetaxel | CR |
| MNT | SNV | Missense_Mutation | novel | c.989N>G | p.Ser330Cys | p.S330C | Q99583 | protein_coding | deleterious(0.03) | probably_damaging(0.993) | TCGA-AC-A5XS-01 | Breast | breast invasive carcinoma | Female | >=65 | I/II | Hormone Therapy | femara | SD |
| MNT | SNV | Missense_Mutation | c.847N>C | p.Glu283Gln | p.E283Q | Q99583 | protein_coding | deleterious(0.02) | probably_damaging(0.994) | TCGA-AQ-A1H2-01 | Breast | breast invasive carcinoma | Female | >=65 | III/IV | Chemotherapy | herceptin | SD | |
| MNT | SNV | Missense_Mutation | c.1109N>A | p.Pro370His | p.P370H | Q99583 | protein_coding | deleterious(0.01) | benign(0.11) | TCGA-D8-A1XQ-01 | Breast | breast invasive carcinoma | Female | >=65 | I/II | Unknown | Unknown | SD | |
| MNT | SNV | Missense_Mutation | novel | c.1517C>T | p.Ser506Phe | p.S506F | Q99583 | protein_coding | deleterious(0.03) | benign(0.28) | TCGA-E2-A1LE-01 | Breast | breast invasive carcinoma | Female | >=65 | III/IV | Chemotherapy | herceptin | PD |
| MNT | SNV | Missense_Mutation | rs772821045 | c.985N>C | p.Thr329Pro | p.T329P | Q99583 | protein_coding | deleterious(0) | probably_damaging(0.991) | TCGA-JL-A3YW-01 | Breast | breast invasive carcinoma | Female | <65 | I/II | Unknown | Unknown | SD |
| MNT | deletion | Frame_Shift_Del | c.1678delC | p.Gln560ArgfsTer7 | p.Q560Rfs*7 | Q99583 | protein_coding | TCGA-EW-A2FV-01 | Breast | breast invasive carcinoma | Female | <65 | III/IV | Chemotherapy | docetaxel | SD | |||
| MNT | SNV | Missense_Mutation | rs769757715 | c.1402N>A | p.Ala468Thr | p.A468T | Q99583 | protein_coding | tolerated(0.19) | benign(0.354) | TCGA-2W-A8YY-01 | Cervix | cervical & endocervical cancer | Female | <65 | I/II | Chemotherapy | cisplatin | CR |
| MNT | SNV | Missense_Mutation | rs769757715 | c.1402N>A | p.Ala468Thr | p.A468T | Q99583 | protein_coding | tolerated(0.19) | benign(0.354) | TCGA-AA-3864-01 | Colorectum | colon adenocarcinoma | Male | >=65 | I/II | Unknown | Unknown | SD |
| MNT | SNV | Missense_Mutation | c.1600G>T | p.Gly534Cys | p.G534C | Q99583 | protein_coding | tolerated(0.07) | possibly_damaging(0.466) | TCGA-AA-3867-01 | Colorectum | colon adenocarcinoma | Male | >=65 | III/IV | Unknown | Unknown | PD |
| Page: 1 2 3 4 5 |
Top |
Related drugs of malignant transformation related genes |
| Identification of chemicals and drugs interact with genes involved in malignant transfromation |
| (DGIdb 4.0) |
| Entrez ID | Symbol | Category | Interaction Types | Drug Claim Name | Drug Name | PMIDs |
| Page: 1 |

Copyright 2023-Present -The University of Texas Health Science Center at Houston |