
|
|||||
|
 | |
| |
| |
| |
| |
| |
|
Gene: MND1 |
Gene summary for MND1 |
| Gene information | Species | Human | Gene symbol | MND1 | Gene ID | 84057 |
| Gene name | meiotic nuclear divisions 1 | |
| Gene Alias | GAJ | |
| Cytomap | 4q31.3 | |
| Gene Type | protein-coding | GO ID | GO:0000003 | UniProtAcc | A0A087WTC6 |
Top |
Malignant transformation analysis |
| Identification of the aberrant gene expression in precancerous and cancerous lesions by comparing the gene expression of stem-like cells in diseased tissues with normal stem cells |
| Entrez ID | Symbol | Replicates | Species | Organ | Tissue | Adj P-value | Log2FC | Malignancy |
| 84057 | MND1 | P2T-E | Human | Esophagus | ESCC | 6.62e-20 | 5.67e-01 | 0.1177 |
| 84057 | MND1 | P4T-E | Human | Esophagus | ESCC | 6.30e-15 | 5.01e-01 | 0.1323 |
| 84057 | MND1 | P5T-E | Human | Esophagus | ESCC | 1.30e-15 | 2.99e-01 | 0.1327 |
| 84057 | MND1 | P10T-E | Human | Esophagus | ESCC | 1.96e-05 | 1.28e-01 | 0.116 |
| 84057 | MND1 | P12T-E | Human | Esophagus | ESCC | 8.40e-04 | 1.54e-01 | 0.1122 |
| 84057 | MND1 | P15T-E | Human | Esophagus | ESCC | 1.36e-05 | 2.67e-01 | 0.1149 |
| 84057 | MND1 | P16T-E | Human | Esophagus | ESCC | 1.12e-06 | 2.64e-01 | 0.1153 |
| 84057 | MND1 | P17T-E | Human | Esophagus | ESCC | 1.20e-03 | 2.78e-01 | 0.1278 |
| 84057 | MND1 | P22T-E | Human | Esophagus | ESCC | 4.17e-05 | 1.54e-01 | 0.1236 |
| 84057 | MND1 | P24T-E | Human | Esophagus | ESCC | 3.89e-12 | 3.11e-01 | 0.1287 |
| 84057 | MND1 | P26T-E | Human | Esophagus | ESCC | 9.44e-07 | 2.32e-01 | 0.1276 |
| 84057 | MND1 | P28T-E | Human | Esophagus | ESCC | 4.41e-07 | 1.76e-01 | 0.1149 |
| 84057 | MND1 | P31T-E | Human | Esophagus | ESCC | 1.88e-11 | 3.47e-01 | 0.1251 |
| 84057 | MND1 | P32T-E | Human | Esophagus | ESCC | 3.89e-12 | 2.80e-01 | 0.1666 |
| 84057 | MND1 | P36T-E | Human | Esophagus | ESCC | 4.84e-02 | 2.30e-01 | 0.1187 |
| 84057 | MND1 | P37T-E | Human | Esophagus | ESCC | 2.19e-10 | 2.82e-01 | 0.1371 |
| 84057 | MND1 | P38T-E | Human | Esophagus | ESCC | 1.89e-04 | 1.69e-01 | 0.127 |
| 84057 | MND1 | P48T-E | Human | Esophagus | ESCC | 4.17e-05 | 1.34e-01 | 0.0959 |
| 84057 | MND1 | P49T-E | Human | Esophagus | ESCC | 3.84e-04 | 5.39e-01 | 0.1768 |
| 84057 | MND1 | P52T-E | Human | Esophagus | ESCC | 4.59e-26 | 6.00e-01 | 0.1555 |
| Page: 1 2 3 |
| Tissue | Expression Dynamics | Abbreviation |
| Esophagus | 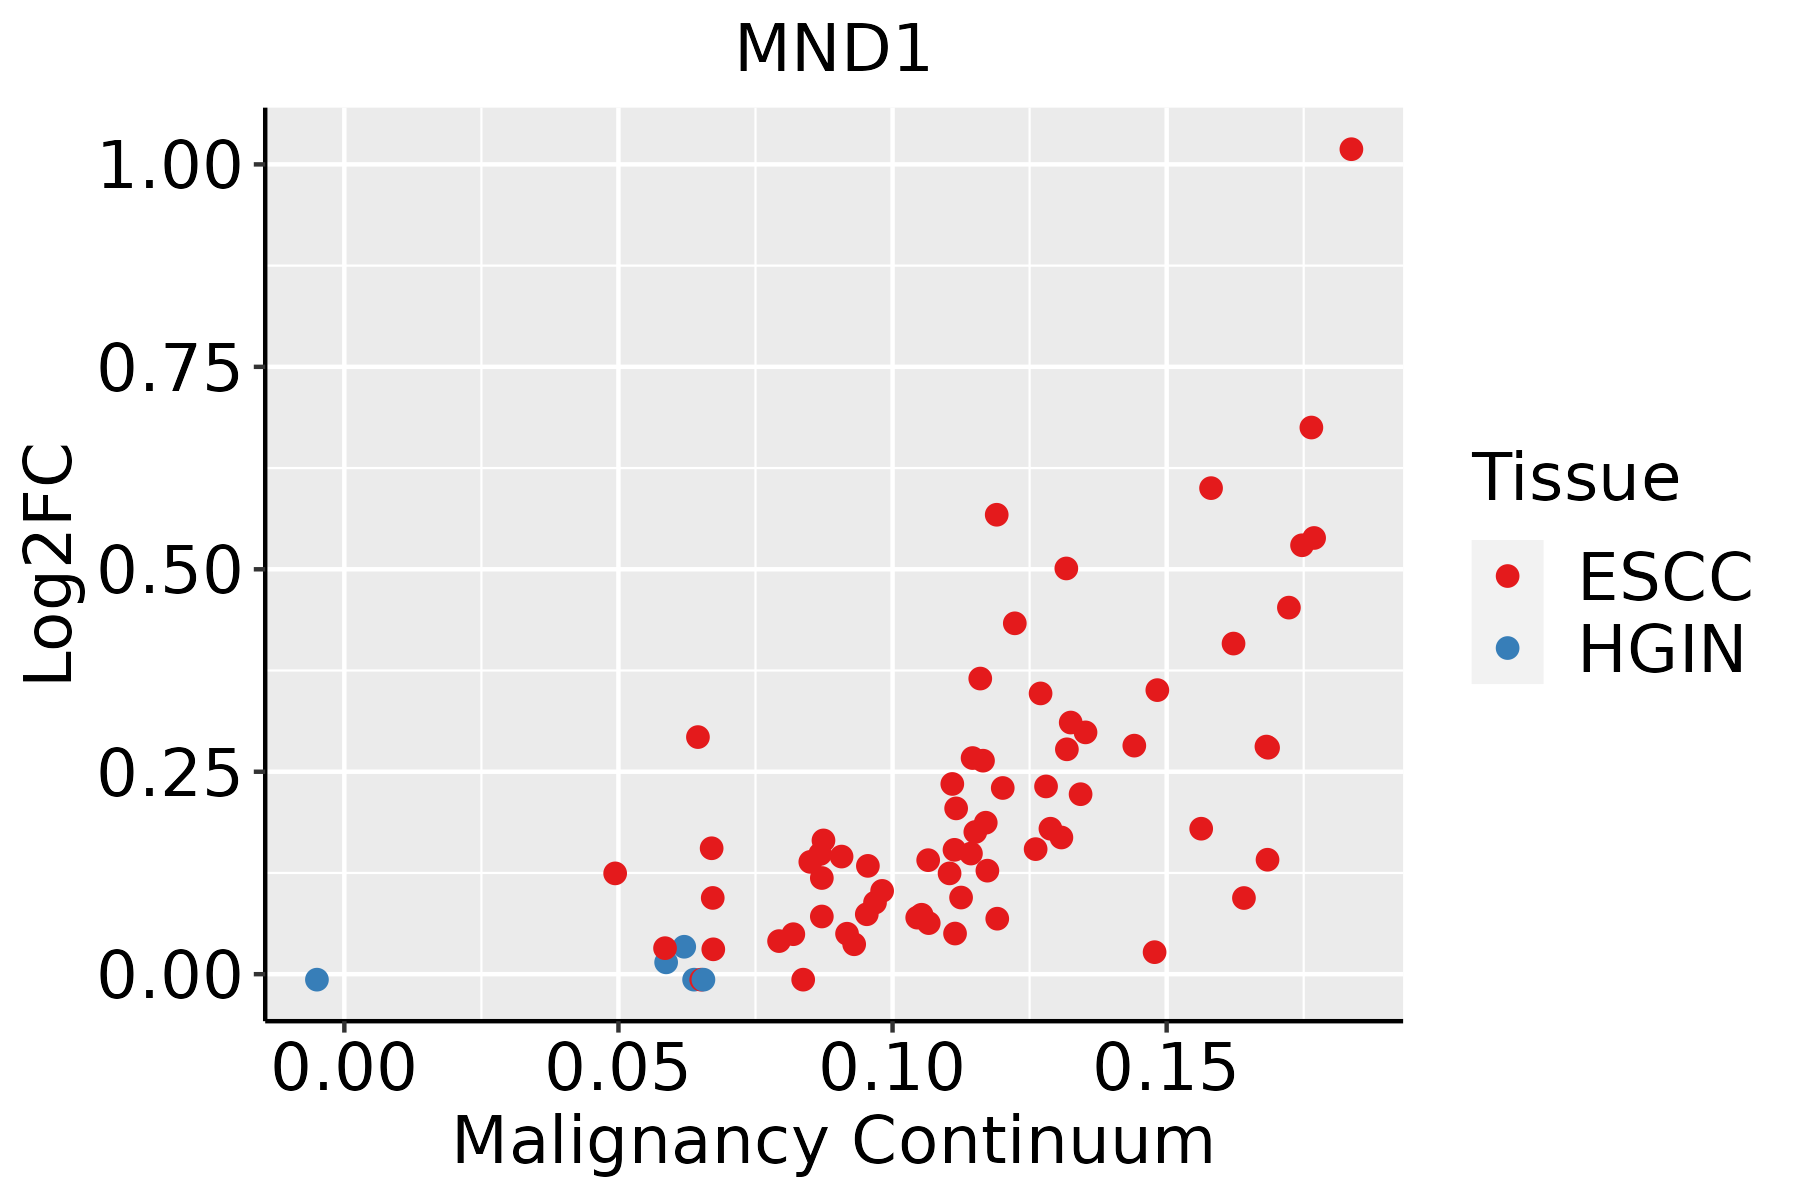 | ESCC: Esophageal squamous cell carcinoma |
| HGIN: High-grade intraepithelial neoplasias | ||
| LGIN: Low-grade intraepithelial neoplasias | ||
| Liver | 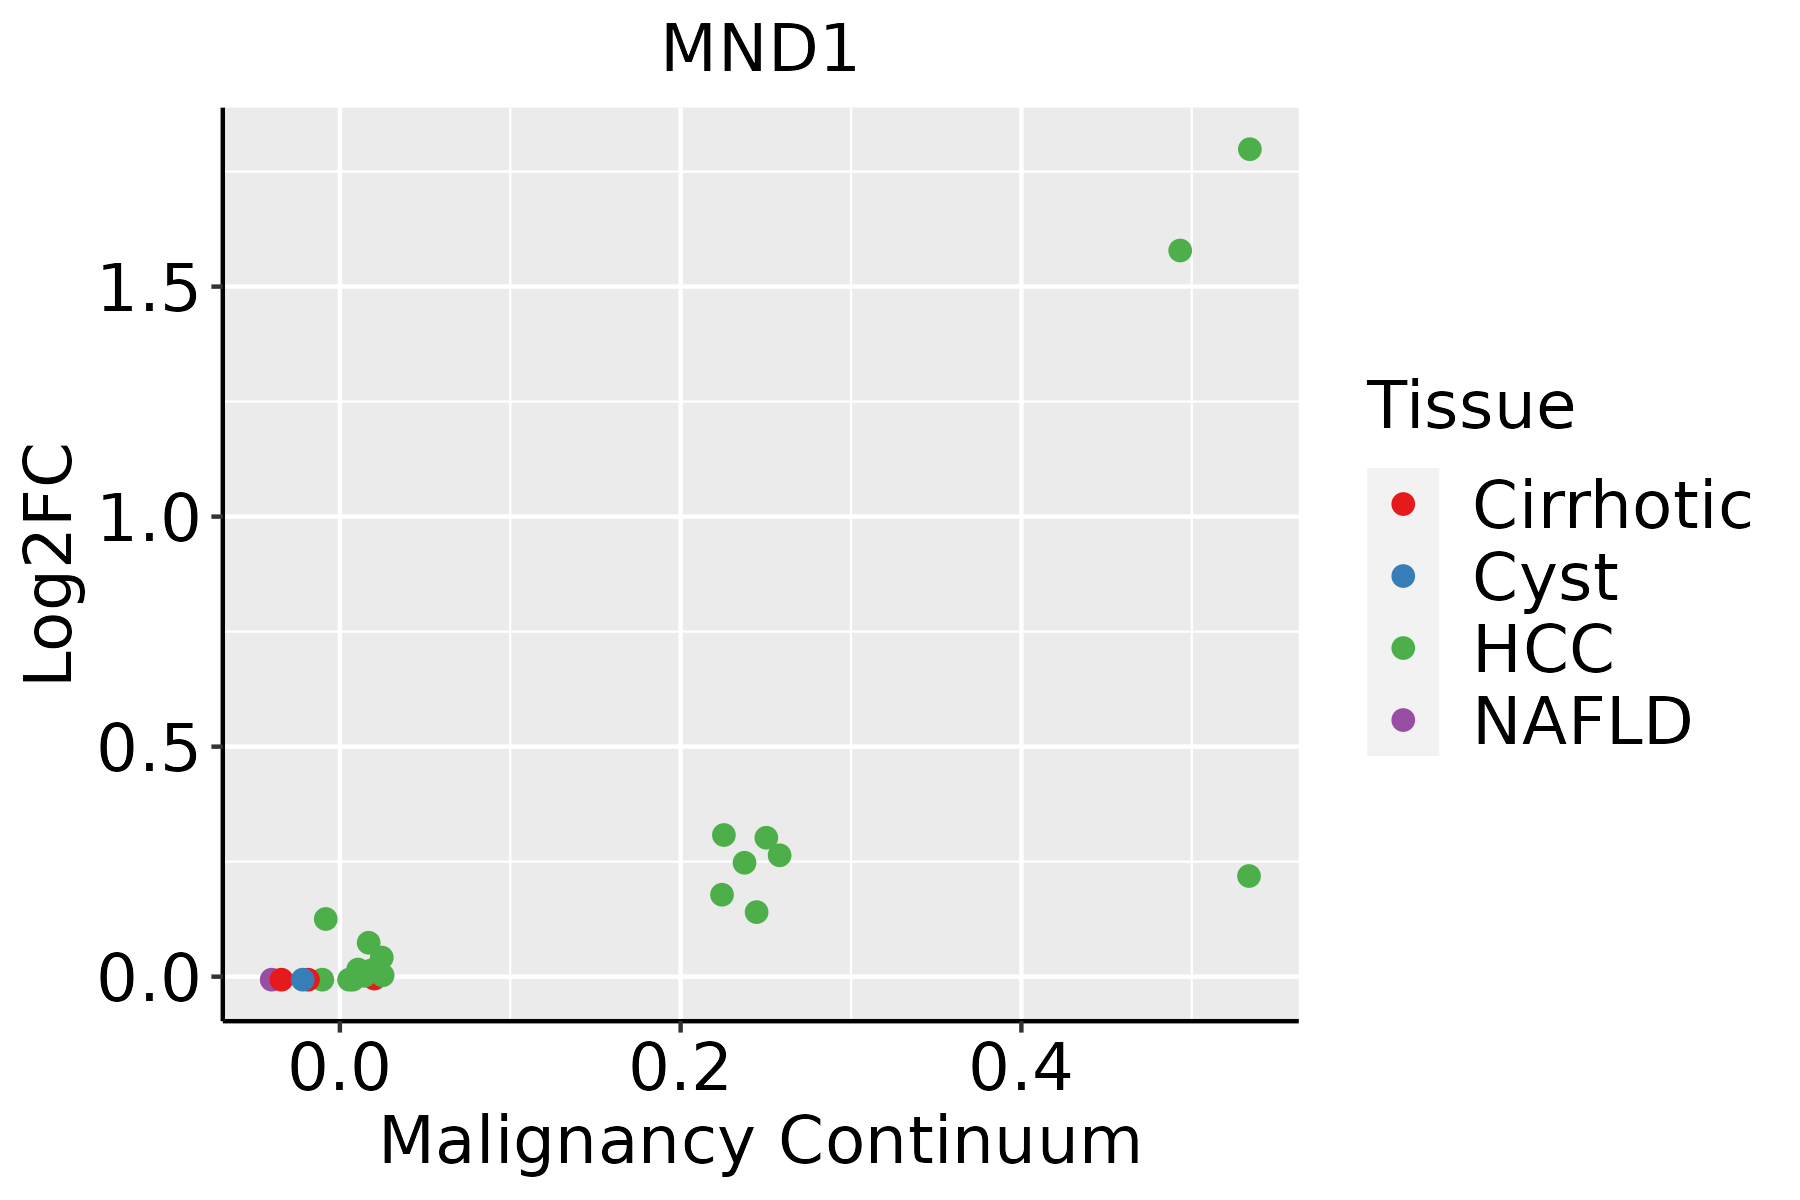 | HCC: Hepatocellular carcinoma |
| NAFLD: Non-alcoholic fatty liver disease | ||
| Oral Cavity | 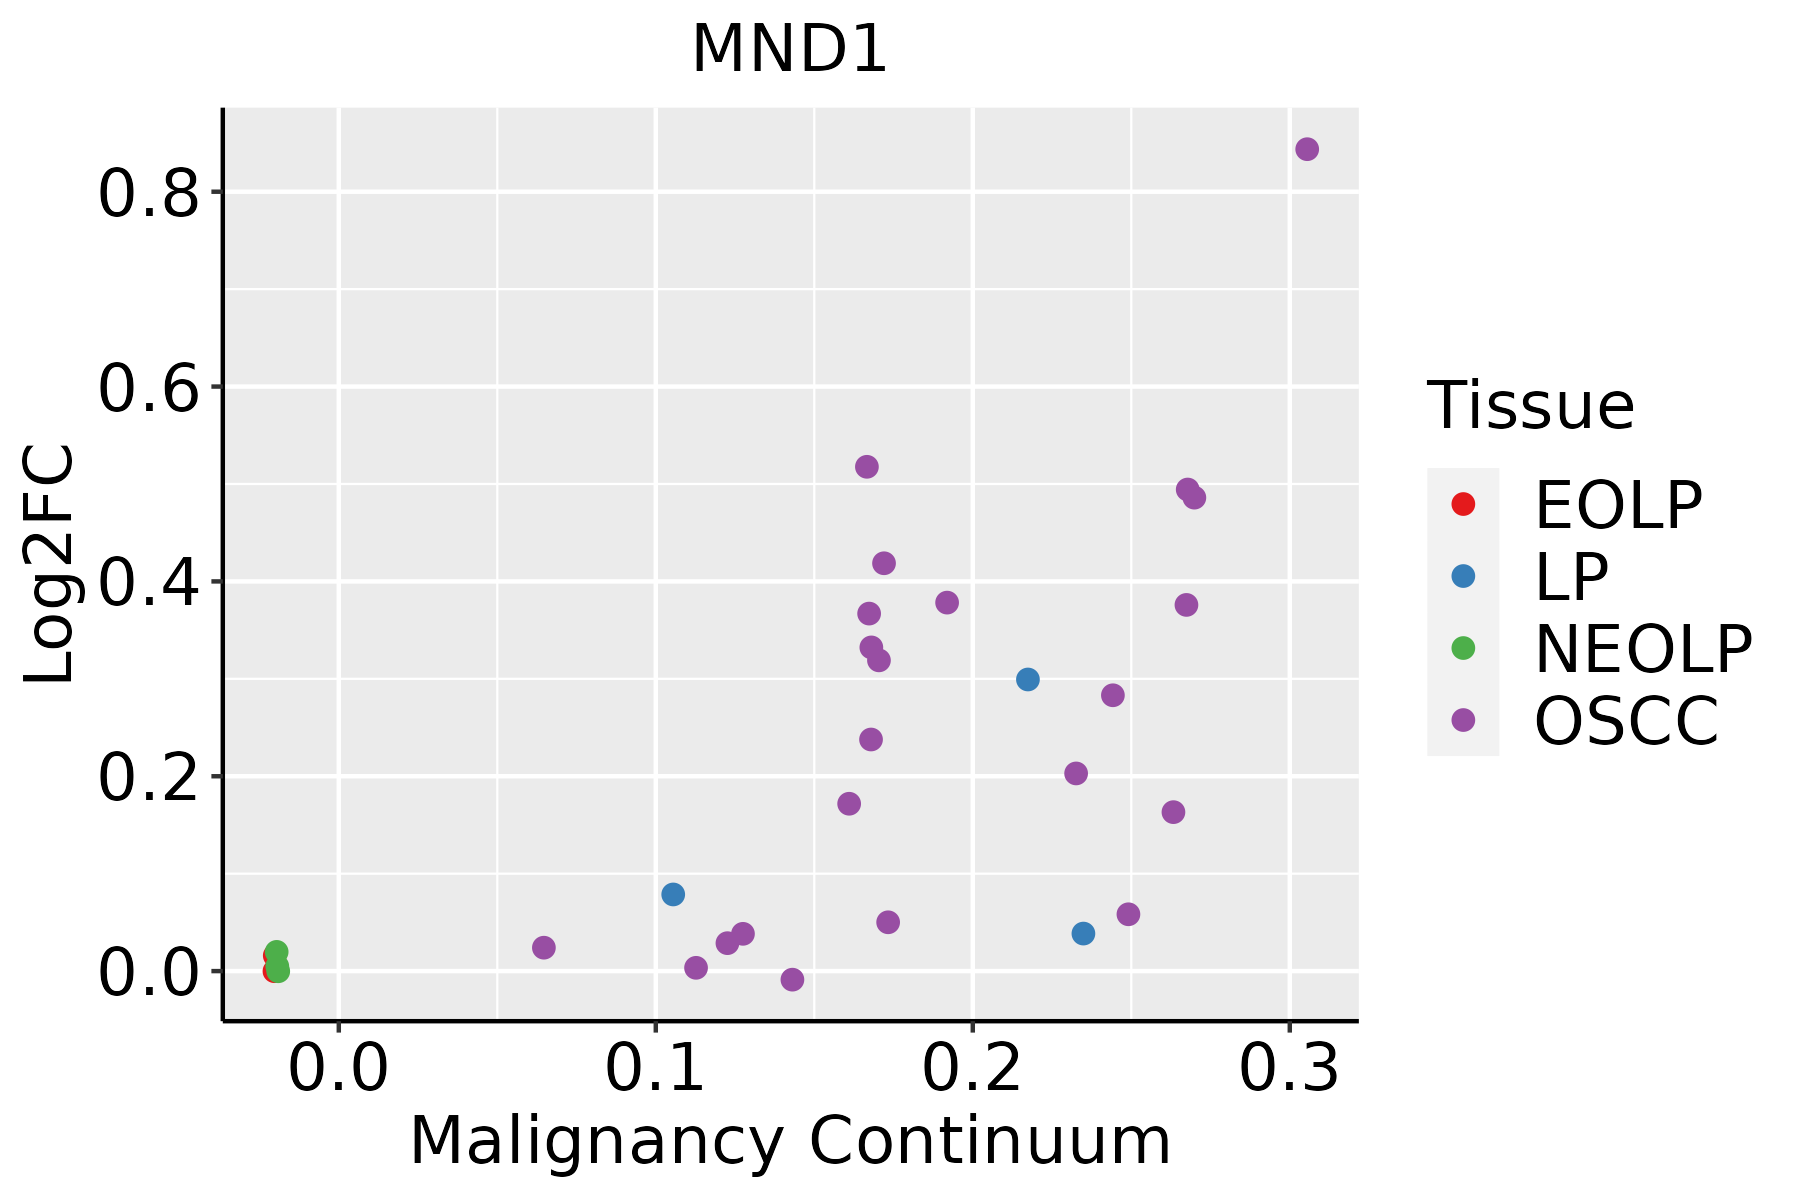 | EOLP: Erosive Oral lichen planus |
| LP: leukoplakia | ||
| NEOLP: Non-erosive oral lichen planus | ||
| OSCC: Oral squamous cell carcinoma |
| ∗log2FC in expression of this searched gene in stem-like cells from each diseased tissue sample relative to stem-like cells in normal samples in each tissue plotted against the malignancy continuum. Samples are colored based on if they are from different disease stage. |
Top |
Malignant transformation related pathway analysis |
| Find out the enriched GO biological processes and KEGG pathways involved in transition from healthy to precancer to cancer |
| Tissue | Disease Stage | Enriched GO biological Processes |
| Colorectum | AD |  |
| Colorectum | SER |  |
| Colorectum | MSS |  |
| Colorectum | MSI-H |  |
| Colorectum | FAP |  |
| ∗Top 15 enriched GO BP terms are showed in the bar plot of each disease state in each tissue. Each row represents a significant GO biological process which is colored according to the -log10(p.adjust). |
| Page: 1 2 3 4 5 6 7 8 9 |
| GO ID | Tissue | Disease Stage | Description | Gene Ratio | Bg Ratio | pvalue | p.adjust | Count |
| GO:000641714 | Breast | IDC | regulation of translation | 74/1434 | 468/18723 | 1.67e-09 | 1.53e-07 | 74 |
| GO:004572714 | Breast | IDC | positive regulation of translation | 33/1434 | 136/18723 | 1.92e-09 | 1.73e-07 | 33 |
| GO:003425014 | Breast | IDC | positive regulation of cellular amide metabolic process | 35/1434 | 162/18723 | 1.63e-08 | 1.16e-06 | 35 |
| GO:00325432 | Breast | IDC | mitochondrial translation | 13/1434 | 76/18723 | 4.81e-03 | 3.67e-02 | 13 |
| GO:000641724 | Breast | DCIS | regulation of translation | 72/1390 | 468/18723 | 2.46e-09 | 2.17e-07 | 72 |
| GO:004572724 | Breast | DCIS | positive regulation of translation | 32/1390 | 136/18723 | 3.56e-09 | 3.10e-07 | 32 |
| GO:003425023 | Breast | DCIS | positive regulation of cellular amide metabolic process | 34/1390 | 162/18723 | 2.60e-08 | 1.73e-06 | 34 |
| GO:003254311 | Breast | DCIS | mitochondrial translation | 13/1390 | 76/18723 | 3.70e-03 | 2.99e-02 | 13 |
| GO:014005313 | Esophagus | ESCC | mitochondrial gene expression | 93/8552 | 108/18723 | 1.96e-18 | 2.03e-16 | 93 |
| GO:0006417111 | Esophagus | ESCC | regulation of translation | 304/8552 | 468/18723 | 1.53e-17 | 1.33e-15 | 304 |
| GO:003254314 | Esophagus | ESCC | mitochondrial translation | 68/8552 | 76/18723 | 1.02e-15 | 6.86e-14 | 68 |
| GO:0045727111 | Esophagus | ESCC | positive regulation of translation | 107/8552 | 136/18723 | 2.79e-15 | 1.68e-13 | 107 |
| GO:0034250111 | Esophagus | ESCC | positive regulation of cellular amide metabolic process | 123/8552 | 162/18723 | 3.32e-15 | 1.93e-13 | 123 |
| GO:00482853 | Esophagus | ESCC | organelle fission | 301/8552 | 488/18723 | 4.64e-13 | 2.12e-11 | 301 |
| GO:00002802 | Esophagus | ESCC | nuclear division | 270/8552 | 439/18723 | 1.17e-11 | 4.24e-10 | 270 |
| GO:00701292 | Esophagus | ESCC | regulation of mitochondrial translation | 22/8552 | 24/18723 | 2.82e-06 | 3.21e-05 | 22 |
| GO:00621252 | Esophagus | ESCC | regulation of mitochondrial gene expression | 24/8552 | 28/18723 | 1.37e-05 | 1.25e-04 | 24 |
| GO:00701312 | Esophagus | ESCC | positive regulation of mitochondrial translation | 14/8552 | 15/18723 | 1.47e-04 | 9.85e-04 | 14 |
| GO:00063101 | Esophagus | ESCC | DNA recombination | 168/8552 | 305/18723 | 5.58e-04 | 3.05e-03 | 168 |
| GO:000641722 | Liver | HCC | regulation of translation | 287/7958 | 468/18723 | 8.79e-17 | 8.08e-15 | 287 |
| Page: 1 2 3 |
| Pathway ID | Tissue | Disease Stage | Description | Gene Ratio | Bg Ratio | pvalue | p.adjust | qvalue | Count |
| Page: 1 |
Top |
Cell-cell communication analysis |
| Identification of potential cell-cell interactions between two cell types and their ligand-receptor pairs for different disease states |
| Ligand | Receptor | LRpair | Pathway | Tissue | Disease Stage |
| Page: 1 |
Top |
Single-cell gene regulatory network inference analysis |
| Find out the significant the regulons (TFs) and the target genes of each regulon across cell types for different disease states |
| TF | Cell Type | Tissue | Disease Stage | Target Gene | RSS | Regulon Activity |
| ∗The dot plots of a searched regulon are shown for all cell subpopulations in each disease state of each tissue based on the regulon specific score inferred using pySCENIC and by calculating the average expression. |
| Page: 1 |
Top |
Somatic mutation of malignant transformation related genes |
| Annotation of somatic variants for genes involved in malignant transformation |
| Hugo Symbol | Variant Class | Variant Classification | dbSNP RS | HGVSc | HGVSp | HGVSp Short | SWISSPROT | BIOTYPE | SIFT | PolyPhen | Tumor Sample Barcode | Tissue | Histology | Sex | Age | Stage | Therapy Types | Drugs | Outcome |
| MND1 | SNV | Missense_Mutation | rs558905999 | c.523N>T | p.Ala175Ser | p.A175S | Q9BWT6 | protein_coding | tolerated(0.75) | benign(0.015) | TCGA-C8-A1HN-01 | Breast | breast invasive carcinoma | Female | <65 | I/II | Unknown | Unknown | SD |
| MND1 | SNV | Missense_Mutation | c.307N>G | p.Leu103Val | p.L103V | Q9BWT6 | protein_coding | tolerated(0.18) | benign(0.095) | TCGA-D8-A1JG-01 | Breast | breast invasive carcinoma | Female | <65 | I/II | Chemotherapy | doxorubicin | SD | |
| MND1 | SNV | Missense_Mutation | novel | c.62N>G | p.Ser21Cys | p.S21C | Q9BWT6 | protein_coding | deleterious(0.01) | benign(0.022) | TCGA-GM-A3XL-01 | Breast | breast invasive carcinoma | Female | <65 | I/II | Chemotherapy | fluorouracil | CR |
| MND1 | insertion | Frame_Shift_Ins | novel | c.605_606insT | p.Tyr203LeufsTer27 | p.Y203Lfs*27 | Q9BWT6 | protein_coding | TCGA-A8-A09X-01 | Breast | breast invasive carcinoma | Female | <65 | III/IV | Unknown | Unknown | SD | ||
| MND1 | insertion | Frame_Shift_Ins | novel | c.606_607insCAGAAATGTGTTTATCAATATTTGA | p.Tyr203GlnfsTer35 | p.Y203Qfs*35 | Q9BWT6 | protein_coding | TCGA-A8-A09X-01 | Breast | breast invasive carcinoma | Female | <65 | III/IV | Unknown | Unknown | SD | ||
| MND1 | SNV | Missense_Mutation | novel | c.476N>T | p.Asn159Ile | p.N159I | Q9BWT6 | protein_coding | tolerated(0.34) | benign(0.029) | TCGA-AA-A02W-01 | Colorectum | colon adenocarcinoma | Female | >=65 | I/II | Unknown | Unknown | PD |
| MND1 | SNV | Missense_Mutation | rs748702473 | c.392N>A | p.Arg131Gln | p.R131Q | Q9BWT6 | protein_coding | tolerated(0.55) | benign(0.007) | TCGA-AZ-4315-01 | Colorectum | colon adenocarcinoma | Male | <65 | I/II | Unknown | Unknown | SD |
| MND1 | SNV | Missense_Mutation | novel | c.58N>C | p.Phe20Leu | p.F20L | Q9BWT6 | protein_coding | deleterious(0.01) | possibly_damaging(0.489) | TCGA-CA-6717-01 | Colorectum | colon adenocarcinoma | Male | <65 | I/II | Chemotherapy | oxaliplatin | CR |
| MND1 | SNV | Missense_Mutation | novel | c.533C>A | p.Ser178Tyr | p.S178Y | Q9BWT6 | protein_coding | deleterious(0) | probably_damaging(0.992) | TCGA-F5-6814-01 | Colorectum | rectum adenocarcinoma | Male | <65 | I/II | Unknown | Unknown | SD |
| MND1 | SNV | Missense_Mutation | novel | c.73N>T | p.Asp25Tyr | p.D25Y | Q9BWT6 | protein_coding | deleterious(0) | probably_damaging(0.994) | TCGA-AJ-A3EL-01 | Endometrium | uterine corpus endometrioid carcinoma | Female | <65 | I/II | Unknown | Unknown | SD |
| Page: 1 2 3 |
Top |
Related drugs of malignant transformation related genes |
| Identification of chemicals and drugs interact with genes involved in malignant transfromation |
| (DGIdb 4.0) |
| Entrez ID | Symbol | Category | Interaction Types | Drug Claim Name | Drug Name | PMIDs |
| Page: 1 |

Copyright 2023-Present -The University of Texas Health Science Center at Houston |