
|
|||||
|
 | |
| |
| |
| |
| |
| |
|
Gene: MNAT1 |
Gene summary for MNAT1 |
| Gene information | Species | Human | Gene symbol | MNAT1 | Gene ID | 4331 |
| Gene name | MNAT1 component of CDK activating kinase | |
| Gene Alias | CAP35 | |
| Cytomap | 14q23.1 | |
| Gene Type | protein-coding | GO ID | GO:0000079 | UniProtAcc | A0A024R669 |
Top |
Malignant transformation analysis |
| Identification of the aberrant gene expression in precancerous and cancerous lesions by comparing the gene expression of stem-like cells in diseased tissues with normal stem cells |
| Entrez ID | Symbol | Replicates | Species | Organ | Tissue | Adj P-value | Log2FC | Malignancy |
| 4331 | MNAT1 | CCI_2 | Human | Cervix | CC | 9.47e-09 | 9.76e-01 | 0.5249 |
| 4331 | MNAT1 | CCI_3 | Human | Cervix | CC | 1.51e-05 | 6.21e-01 | 0.516 |
| 4331 | MNAT1 | HTA11_3410_2000001011 | Human | Colorectum | AD | 4.40e-14 | -5.79e-01 | 0.0155 |
| 4331 | MNAT1 | HTA11_2487_2000001011 | Human | Colorectum | SER | 1.40e-06 | -5.61e-01 | -0.1808 |
| 4331 | MNAT1 | HTA11_78_2000001011 | Human | Colorectum | AD | 9.70e-04 | -4.79e-01 | -0.1088 |
| 4331 | MNAT1 | HTA11_347_2000001011 | Human | Colorectum | AD | 1.21e-07 | -4.71e-01 | -0.1954 |
| 4331 | MNAT1 | HTA11_3361_2000001011 | Human | Colorectum | AD | 1.23e-04 | -5.53e-01 | -0.1207 |
| 4331 | MNAT1 | HTA11_83_2000001011 | Human | Colorectum | SER | 3.81e-04 | -5.78e-01 | -0.1526 |
| 4331 | MNAT1 | HTA11_696_2000001011 | Human | Colorectum | AD | 7.71e-25 | -5.62e-01 | -0.1464 |
| 4331 | MNAT1 | HTA11_866_2000001011 | Human | Colorectum | AD | 1.96e-14 | -4.71e-01 | -0.1001 |
| 4331 | MNAT1 | HTA11_1391_2000001011 | Human | Colorectum | AD | 7.87e-04 | -4.51e-01 | -0.059 |
| 4331 | MNAT1 | HTA11_866_3004761011 | Human | Colorectum | AD | 1.22e-07 | -5.15e-01 | 0.096 |
| 4331 | MNAT1 | HTA11_10711_2000001011 | Human | Colorectum | AD | 2.32e-04 | -5.05e-01 | 0.0338 |
| 4331 | MNAT1 | HTA11_7696_3000711011 | Human | Colorectum | AD | 1.71e-17 | -4.92e-01 | 0.0674 |
| 4331 | MNAT1 | HTA11_99999970781_79442 | Human | Colorectum | MSS | 6.58e-12 | -4.30e-01 | 0.294 |
| 4331 | MNAT1 | HTA11_99999971662_82457 | Human | Colorectum | MSS | 4.99e-16 | -4.81e-01 | 0.3859 |
| 4331 | MNAT1 | HTA11_99999973899_84307 | Human | Colorectum | MSS | 2.25e-04 | -5.91e-01 | 0.2585 |
| 4331 | MNAT1 | HTA11_99999974143_84620 | Human | Colorectum | MSS | 3.56e-20 | -5.02e-01 | 0.3005 |
| 4331 | MNAT1 | A015-C-203 | Human | Colorectum | FAP | 1.07e-23 | -2.80e-01 | -0.1294 |
| 4331 | MNAT1 | A015-C-204 | Human | Colorectum | FAP | 2.29e-02 | -1.78e-01 | -0.0228 |
| Page: 1 2 3 4 5 6 7 8 9 10 |
| Tissue | Expression Dynamics | Abbreviation |
| Cervix | 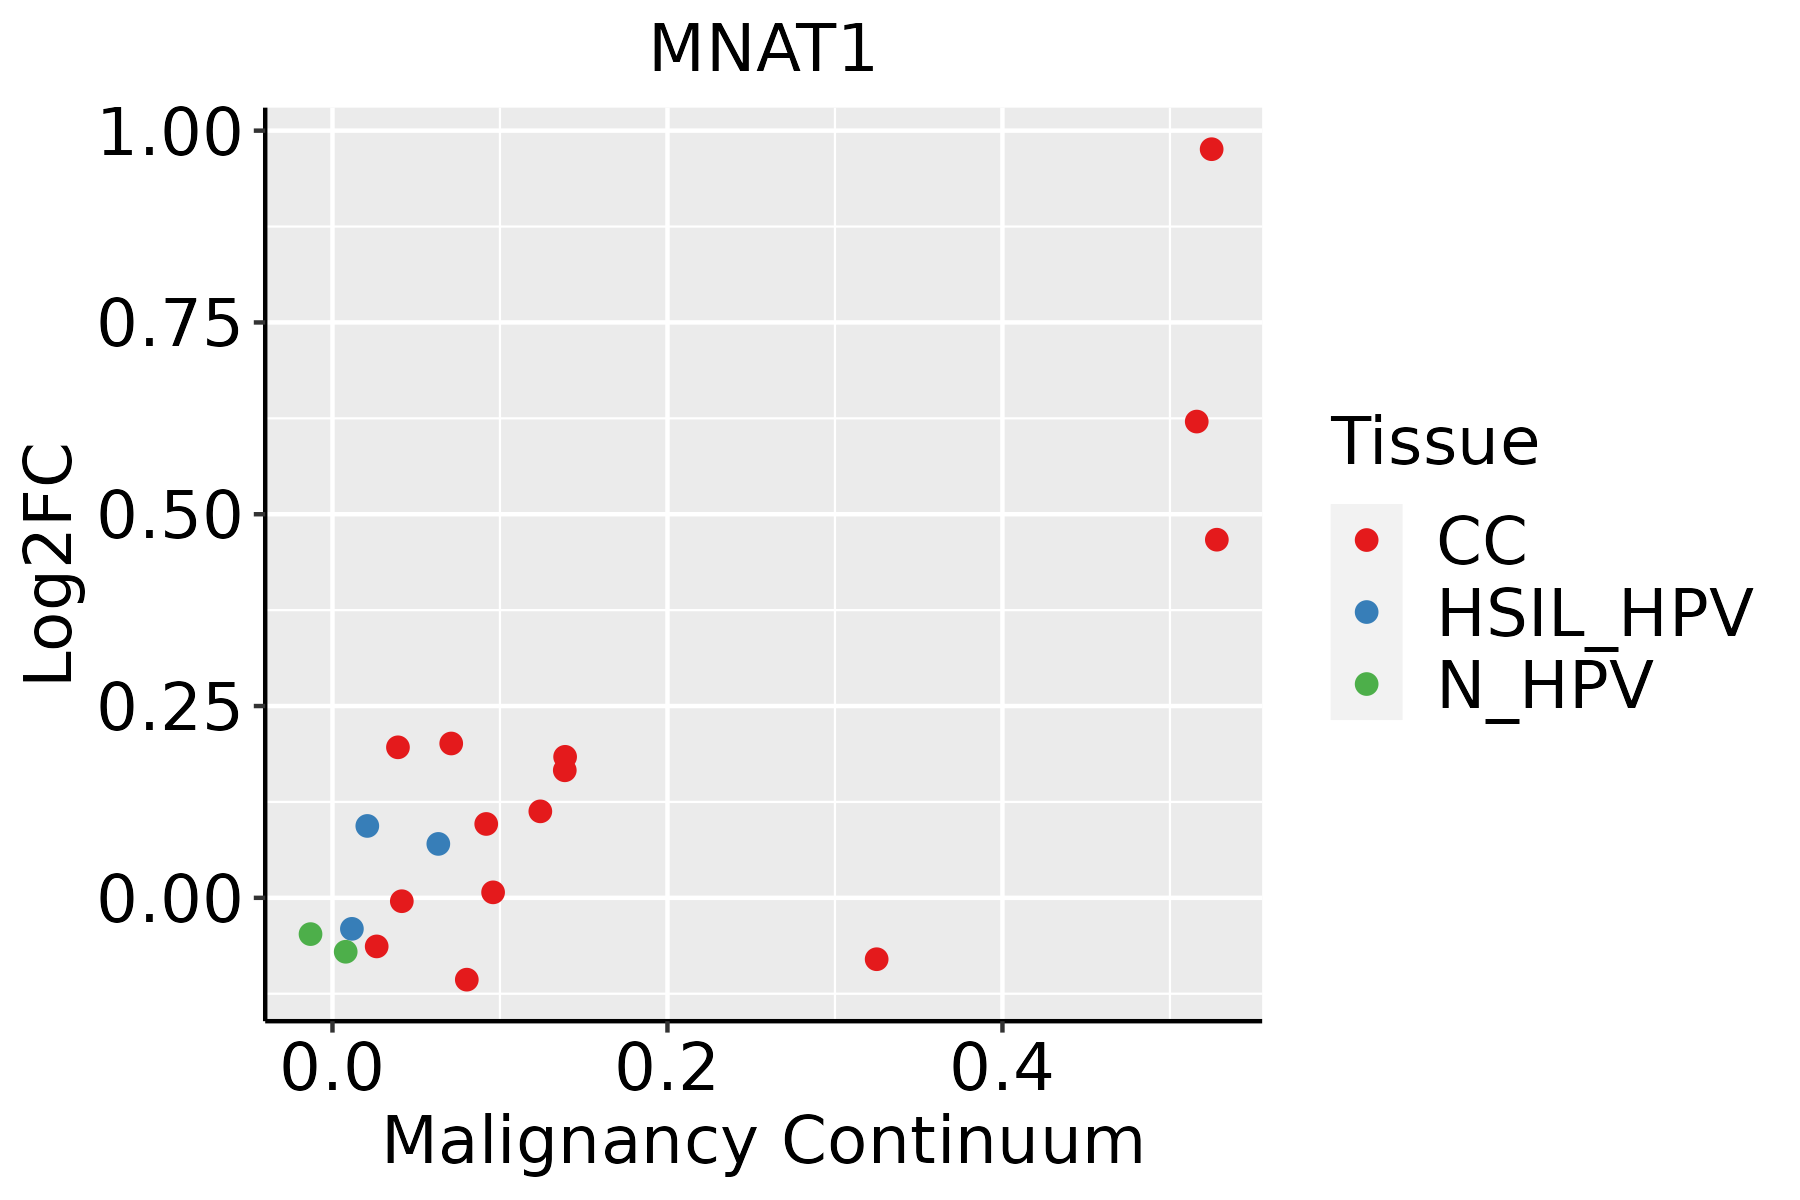 | CC: Cervix cancer |
| HSIL_HPV: HPV-infected high-grade squamous intraepithelial lesions | ||
| N_HPV: HPV-infected normal cervix | ||
| Colorectum (GSE201348) |  | FAP: Familial adenomatous polyposis |
| CRC: Colorectal cancer | ||
| Colorectum (HTA11) |  | AD: Adenomas |
| SER: Sessile serrated lesions | ||
| MSI-H: Microsatellite-high colorectal cancer | ||
| MSS: Microsatellite stable colorectal cancer | ||
| Endometrium | 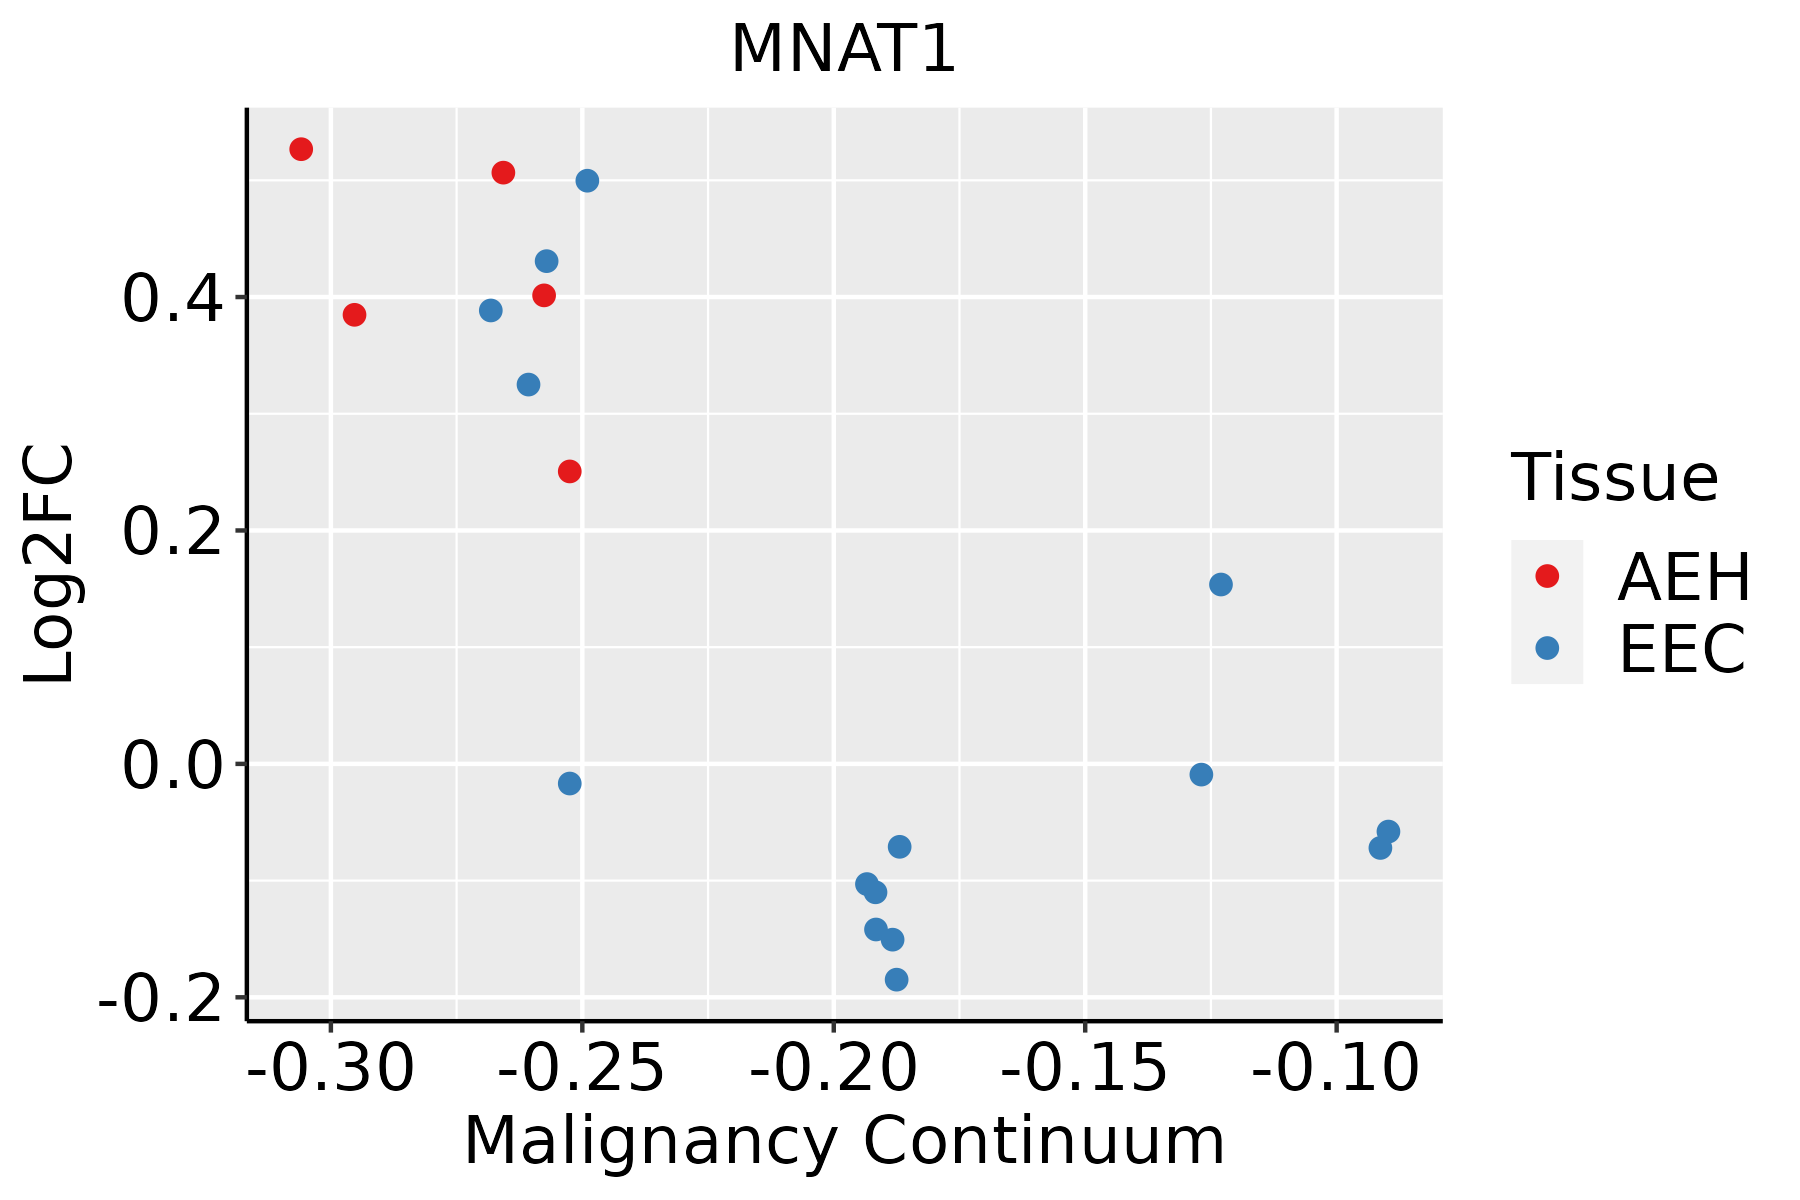 | AEH: Atypical endometrial hyperplasia |
| EEC: Endometrioid Cancer | ||
| Esophagus | 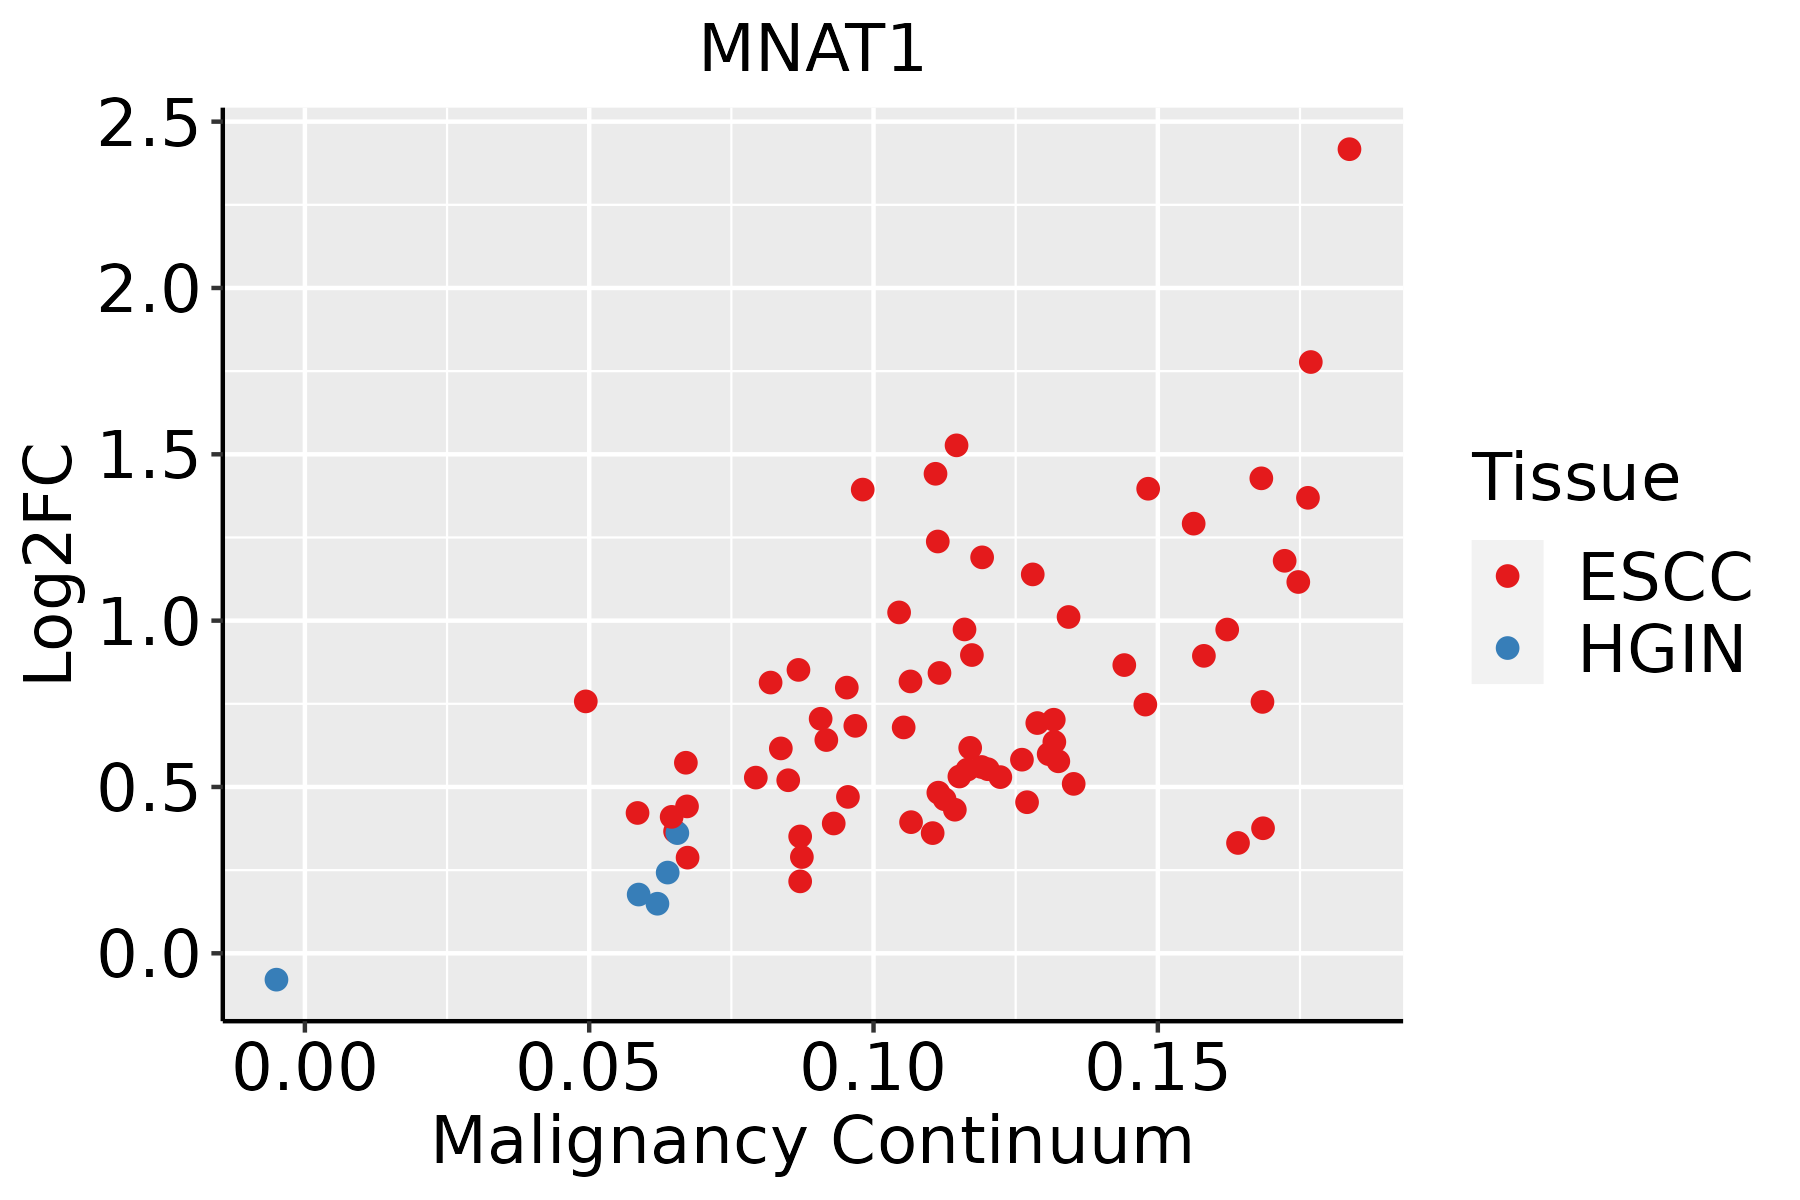 | ESCC: Esophageal squamous cell carcinoma |
| HGIN: High-grade intraepithelial neoplasias | ||
| LGIN: Low-grade intraepithelial neoplasias | ||
| Liver |  | HCC: Hepatocellular carcinoma |
| NAFLD: Non-alcoholic fatty liver disease | ||
| Lung | 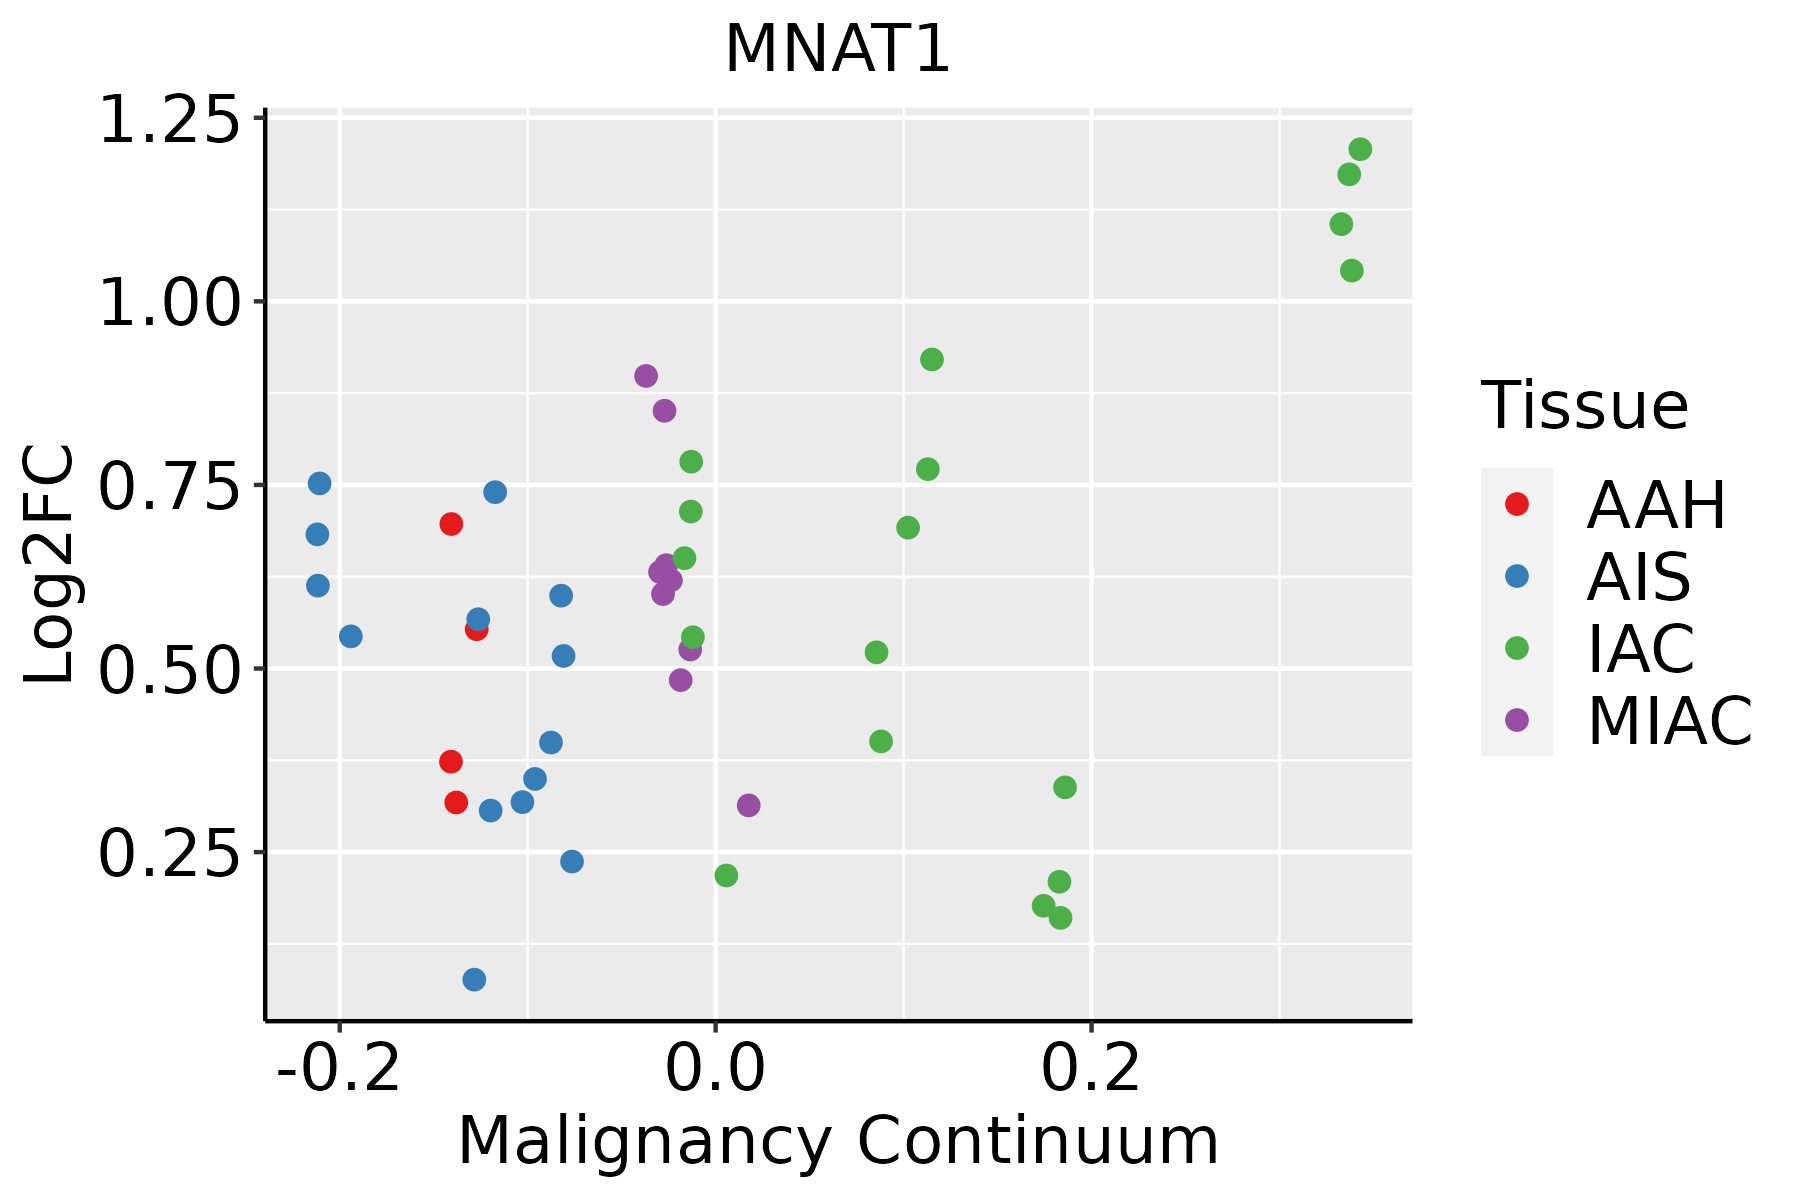 | AAH: Atypical adenomatous hyperplasia |
| AIS: Adenocarcinoma in situ | ||
| IAC: Invasive lung adenocarcinoma | ||
| MIA: Minimally invasive adenocarcinoma | ||
| Oral Cavity | 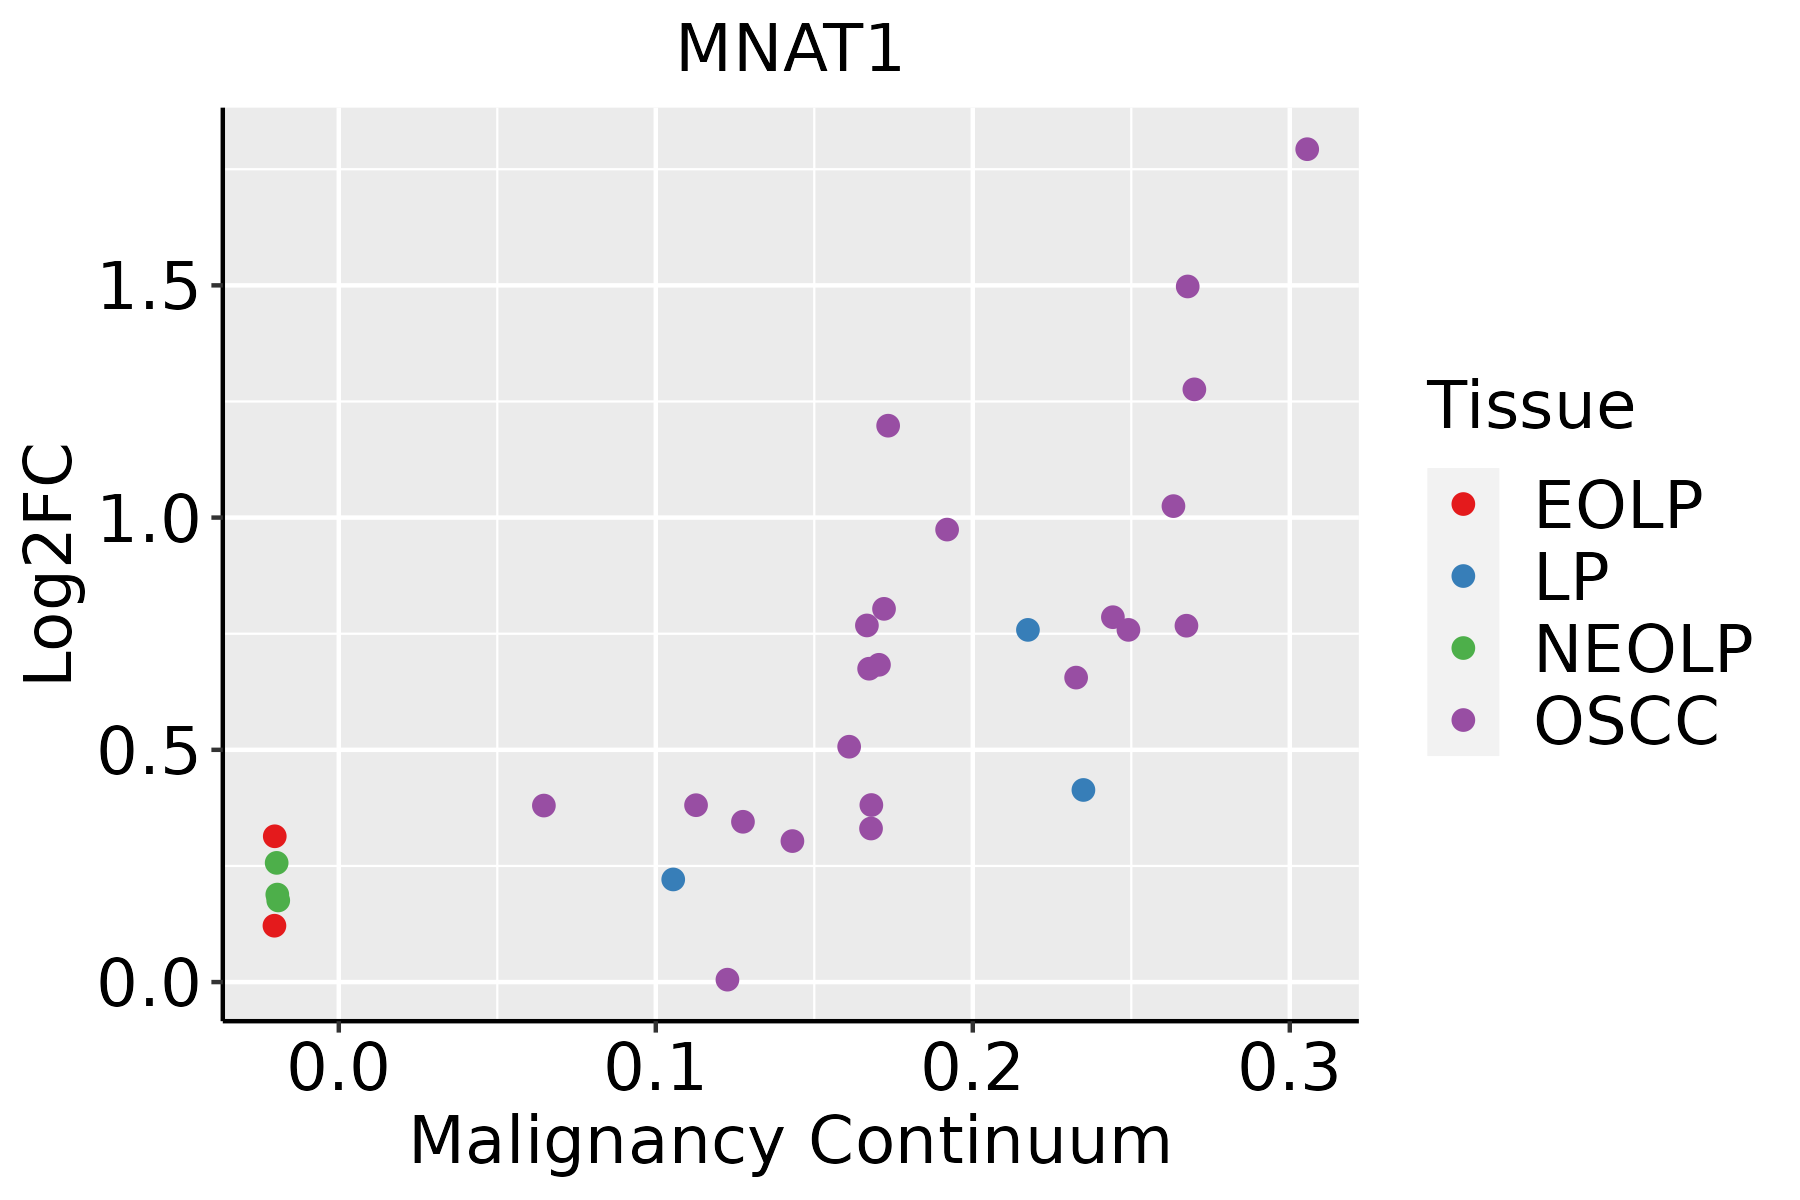 | EOLP: Erosive Oral lichen planus |
| LP: leukoplakia | ||
| NEOLP: Non-erosive oral lichen planus | ||
| OSCC: Oral squamous cell carcinoma | ||
| Skin |  | AK: Actinic keratosis |
| cSCC: Cutaneous squamous cell carcinoma | ||
| SCCIS:squamous cell carcinoma in situ | ||
| Thyroid | 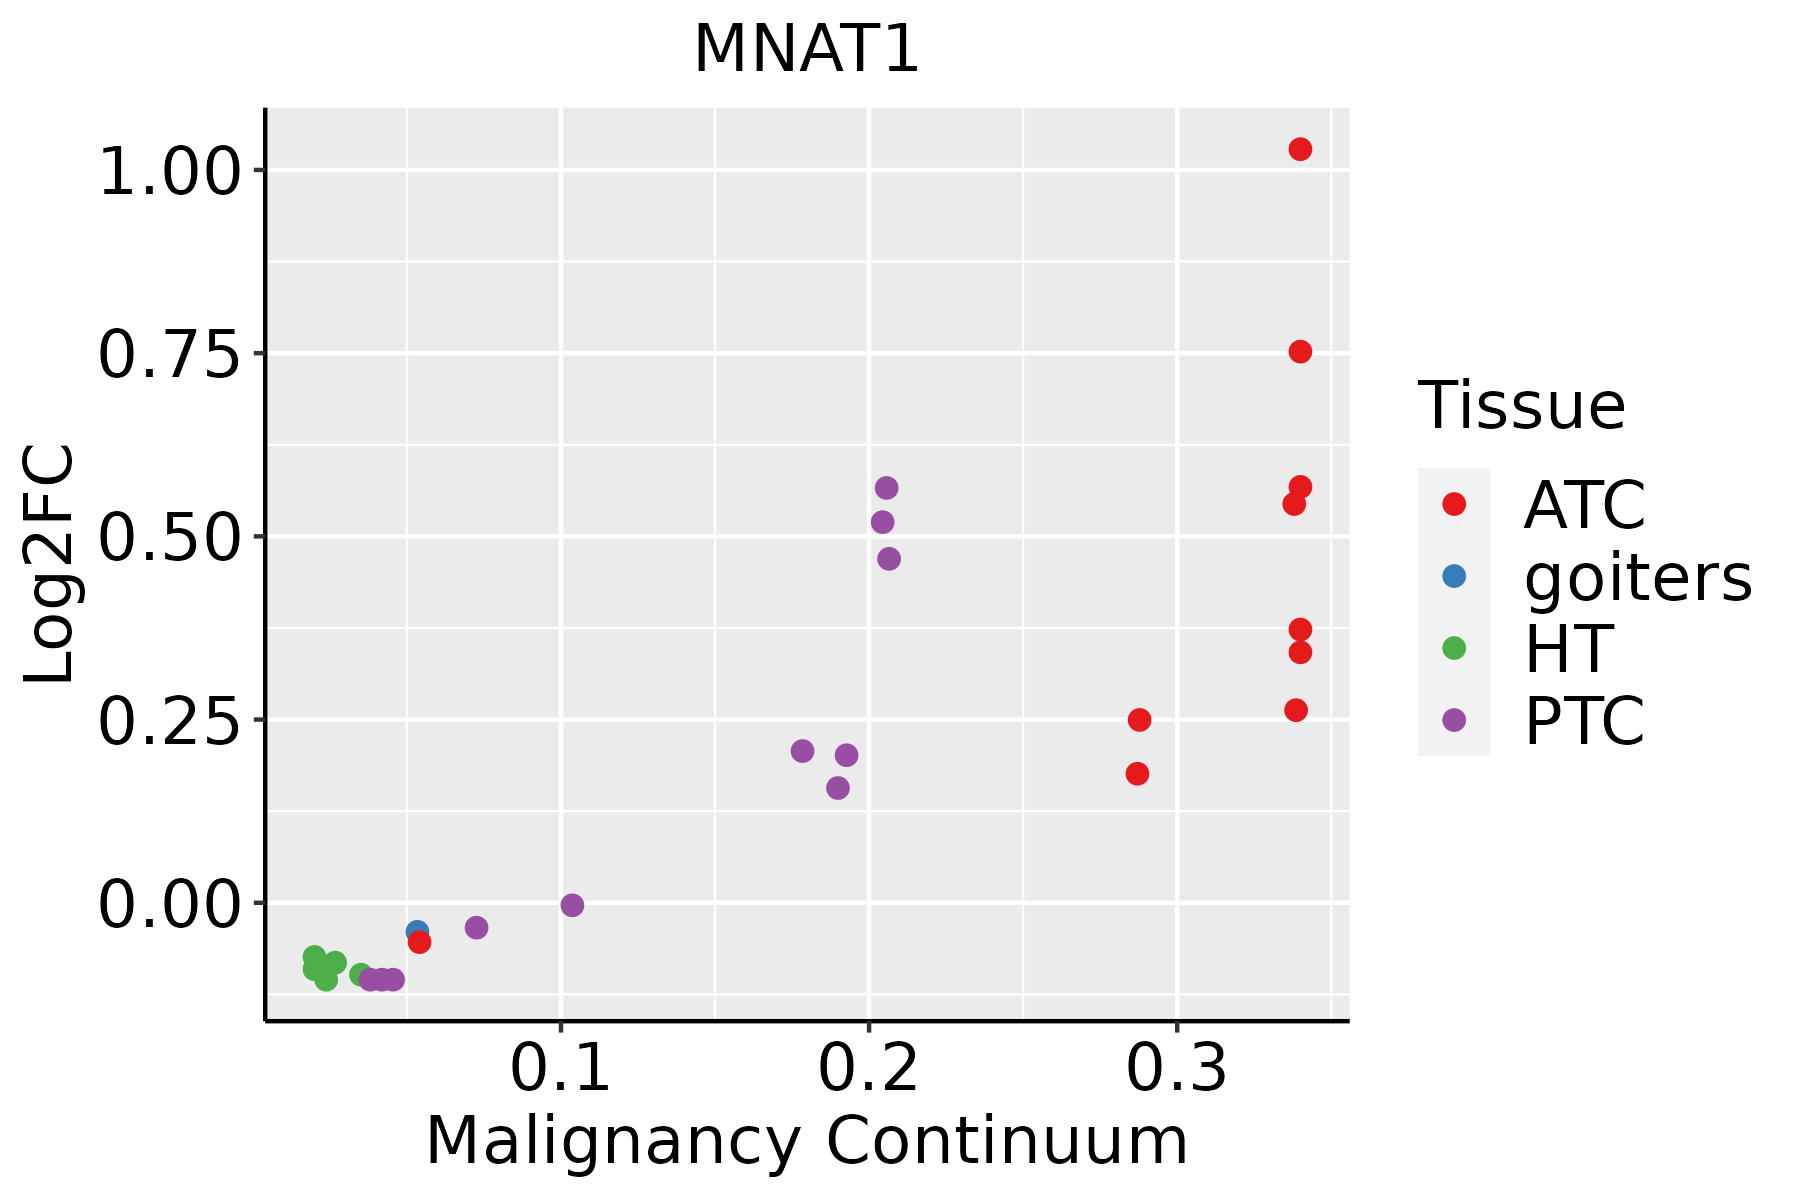 | ATC: Anaplastic thyroid cancer |
| HT: Hashimoto's thyroiditis | ||
| PTC: Papillary thyroid cancer |
| ∗log2FC in expression of this searched gene in stem-like cells from each diseased tissue sample relative to stem-like cells in normal samples in each tissue plotted against the malignancy continuum. Samples are colored based on if they are from different disease stage. |
Top |
Malignant transformation related pathway analysis |
| Find out the enriched GO biological processes and KEGG pathways involved in transition from healthy to precancer to cancer |
| Tissue | Disease Stage | Enriched GO biological Processes |
| Colorectum | AD |  |
| Colorectum | SER |  |
| Colorectum | MSS |  |
| Colorectum | MSI-H |  |
| Colorectum | FAP |  |
| ∗Top 15 enriched GO BP terms are showed in the bar plot of each disease state in each tissue. Each row represents a significant GO biological process which is colored according to the -log10(p.adjust). |
| Page: 1 2 3 4 5 6 7 8 9 |
| GO ID | Tissue | Disease Stage | Description | Gene Ratio | Bg Ratio | pvalue | p.adjust | Count |
| GO:003367410 | Cervix | CC | positive regulation of kinase activity | 101/2311 | 467/18723 | 8.66e-09 | 7.22e-07 | 101 |
| GO:00458608 | Cervix | CC | positive regulation of protein kinase activity | 85/2311 | 386/18723 | 5.61e-08 | 3.29e-06 | 85 |
| GO:00447725 | Cervix | CC | mitotic cell cycle phase transition | 89/2311 | 424/18723 | 2.70e-07 | 1.12e-05 | 89 |
| GO:00719007 | Cervix | CC | regulation of protein serine/threonine kinase activity | 75/2311 | 359/18723 | 2.76e-06 | 8.02e-05 | 75 |
| GO:00457876 | Cervix | CC | positive regulation of cell cycle | 66/2311 | 313/18723 | 7.78e-06 | 1.81e-04 | 66 |
| GO:00000824 | Cervix | CC | G1/S transition of mitotic cell cycle | 49/2311 | 214/18723 | 1.16e-05 | 2.48e-04 | 49 |
| GO:00448434 | Cervix | CC | cell cycle G1/S phase transition | 53/2311 | 241/18723 | 1.76e-05 | 3.32e-04 | 53 |
| GO:00719025 | Cervix | CC | positive regulation of protein serine/threonine kinase activity | 46/2311 | 200/18723 | 1.87e-05 | 3.47e-04 | 46 |
| GO:00106399 | Cervix | CC | negative regulation of organelle organization | 68/2311 | 348/18723 | 7.40e-05 | 1.03e-03 | 68 |
| GO:0033002 | Cervix | CC | muscle cell proliferation | 49/2311 | 248/18723 | 5.43e-04 | 5.24e-03 | 49 |
| GO:001003810 | Cervix | CC | response to metal ion | 67/2311 | 373/18723 | 9.67e-04 | 8.10e-03 | 67 |
| GO:00515926 | Cervix | CC | response to calcium ion | 31/2311 | 149/18723 | 2.31e-03 | 1.65e-02 | 31 |
| GO:00323923 | Cervix | CC | DNA geometric change | 21/2311 | 90/18723 | 2.71e-03 | 1.85e-02 | 21 |
| GO:00486593 | Cervix | CC | smooth muscle cell proliferation | 36/2311 | 184/18723 | 3.27e-03 | 2.13e-02 | 36 |
| GO:00486603 | Cervix | CC | regulation of smooth muscle cell proliferation | 35/2311 | 180/18723 | 4.10e-03 | 2.54e-02 | 35 |
| GO:00486612 | Cervix | CC | positive regulation of smooth muscle cell proliferation | 22/2311 | 104/18723 | 7.59e-03 | 4.04e-02 | 22 |
| GO:0010639 | Colorectum | AD | negative regulation of organelle organization | 114/3918 | 348/18723 | 1.41e-07 | 6.49e-06 | 114 |
| GO:0033674 | Colorectum | AD | positive regulation of kinase activity | 131/3918 | 467/18723 | 1.28e-04 | 1.85e-03 | 131 |
| GO:0033044 | Colorectum | AD | regulation of chromosome organization | 60/3918 | 187/18723 | 2.25e-04 | 2.94e-03 | 60 |
| GO:0010038 | Colorectum | AD | response to metal ion | 106/3918 | 373/18723 | 3.22e-04 | 3.83e-03 | 106 |
| Page: 1 2 3 4 5 6 7 8 9 10 11 12 13 14 15 16 17 |
| Pathway ID | Tissue | Disease Stage | Description | Gene Ratio | Bg Ratio | pvalue | p.adjust | qvalue | Count |
| hsa0342022 | Esophagus | ESCC | Nucleotide excision repair | 54/4205 | 63/8465 | 2.01e-09 | 2.17e-08 | 1.11e-08 | 54 |
| hsa030222 | Esophagus | ESCC | Basal transcription factors | 35/4205 | 45/8465 | 1.01e-04 | 4.06e-04 | 2.08e-04 | 35 |
| hsa0342032 | Esophagus | ESCC | Nucleotide excision repair | 54/4205 | 63/8465 | 2.01e-09 | 2.17e-08 | 1.11e-08 | 54 |
| hsa0302211 | Esophagus | ESCC | Basal transcription factors | 35/4205 | 45/8465 | 1.01e-04 | 4.06e-04 | 2.08e-04 | 35 |
| hsa03420 | Liver | Cirrhotic | Nucleotide excision repair | 29/2530 | 63/8465 | 4.81e-03 | 1.74e-02 | 1.07e-02 | 29 |
| hsa034201 | Liver | Cirrhotic | Nucleotide excision repair | 29/2530 | 63/8465 | 4.81e-03 | 1.74e-02 | 1.07e-02 | 29 |
| hsa034202 | Liver | HCC | Nucleotide excision repair | 41/4020 | 63/8465 | 3.59e-03 | 1.12e-02 | 6.22e-03 | 41 |
| hsa034203 | Liver | HCC | Nucleotide excision repair | 41/4020 | 63/8465 | 3.59e-03 | 1.12e-02 | 6.22e-03 | 41 |
| hsa034204 | Oral cavity | OSCC | Nucleotide excision repair | 49/3704 | 63/8465 | 3.48e-08 | 2.91e-07 | 1.48e-07 | 49 |
| hsa03022 | Oral cavity | OSCC | Basal transcription factors | 28/3704 | 45/8465 | 9.53e-03 | 2.11e-02 | 1.08e-02 | 28 |
| hsa0342011 | Oral cavity | OSCC | Nucleotide excision repair | 49/3704 | 63/8465 | 3.48e-08 | 2.91e-07 | 1.48e-07 | 49 |
| hsa030221 | Oral cavity | OSCC | Basal transcription factors | 28/3704 | 45/8465 | 9.53e-03 | 2.11e-02 | 1.08e-02 | 28 |
| Page: 1 |
Top |
Cell-cell communication analysis |
| Identification of potential cell-cell interactions between two cell types and their ligand-receptor pairs for different disease states |
| Ligand | Receptor | LRpair | Pathway | Tissue | Disease Stage |
| Page: 1 |
Top |
Single-cell gene regulatory network inference analysis |
| Find out the significant the regulons (TFs) and the target genes of each regulon across cell types for different disease states |
| TF | Cell Type | Tissue | Disease Stage | Target Gene | RSS | Regulon Activity |
| ∗The dot plots of a searched regulon are shown for all cell subpopulations in each disease state of each tissue based on the regulon specific score inferred using pySCENIC and by calculating the average expression. |
| Page: 1 |
Top |
Somatic mutation of malignant transformation related genes |
| Annotation of somatic variants for genes involved in malignant transformation |
| Hugo Symbol | Variant Class | Variant Classification | dbSNP RS | HGVSc | HGVSp | HGVSp Short | SWISSPROT | BIOTYPE | SIFT | PolyPhen | Tumor Sample Barcode | Tissue | Histology | Sex | Age | Stage | Therapy Types | Drugs | Outcome |
| MNAT1 | SNV | Missense_Mutation | c.611N>C | p.Arg204Thr | p.R204T | P51948 | protein_coding | tolerated(0.07) | benign(0.258) | TCGA-A2-A0D1-01 | Breast | breast invasive carcinoma | Female | >=65 | I/II | Chemotherapy | taxotere | SD | |
| MNAT1 | SNV | Missense_Mutation | c.827G>C | p.Arg276Thr | p.R276T | P51948 | protein_coding | deleterious(0) | probably_damaging(0.991) | TCGA-A7-A26H-01 | Breast | breast invasive carcinoma | Female | >=65 | I/II | Hormone Therapy | anastrozole | PD | |
| MNAT1 | insertion | Nonsense_Mutation | novel | c.731_732insATAAGACCAT | p.Leu245Ter | p.L245* | P51948 | protein_coding | TCGA-AR-A0U2-01 | Breast | breast invasive carcinoma | Female | <65 | III/IV | Hormone Therapy | tamoxiphen | PD | ||
| MNAT1 | SNV | Missense_Mutation | novel | c.614C>T | p.Ser205Phe | p.S205F | P51948 | protein_coding | deleterious(0.01) | possibly_damaging(0.617) | TCGA-C5-A7X5-01 | Cervix | cervical & endocervical cancer | Female | >=65 | I/II | Chemotherapy | carboplatin | PD |
| MNAT1 | SNV | Missense_Mutation | c.539A>C | p.Lys180Thr | p.K180T | P51948 | protein_coding | deleterious(0) | probably_damaging(0.985) | TCGA-A6-6653-01 | Colorectum | colon adenocarcinoma | Male | >=65 | I/II | Unknown | Unknown | SD | |
| MNAT1 | SNV | Missense_Mutation | novel | c.294N>A | p.Phe98Leu | p.F98L | P51948 | protein_coding | deleterious(0) | benign(0.136) | TCGA-AA-3510-01 | Colorectum | colon adenocarcinoma | Male | >=65 | I/II | Unknown | Unknown | SD |
| MNAT1 | SNV | Missense_Mutation | novel | c.229A>C | p.Lys77Gln | p.K77Q | P51948 | protein_coding | deleterious(0.01) | probably_damaging(0.979) | TCGA-CA-6717-01 | Colorectum | colon adenocarcinoma | Male | <65 | I/II | Chemotherapy | oxaliplatin | CR |
| MNAT1 | SNV | Missense_Mutation | c.461N>T | p.Glu154Val | p.E154V | P51948 | protein_coding | deleterious(0) | probably_damaging(0.999) | TCGA-G4-6304-01 | Colorectum | colon adenocarcinoma | Female | >=65 | I/II | Chemotherapy | fluorouracil | PD | |
| MNAT1 | insertion | Nonsense_Mutation | novel | c.136_137insA | p.Cys46Ter | p.C46* | P51948 | protein_coding | TCGA-AM-5820-01 | Colorectum | colon adenocarcinoma | Female | <65 | I/II | Unknown | Unknown | SD | ||
| MNAT1 | insertion | Frame_Shift_Ins | novel | c.137_138insTCACTTCTATTTAAAAT | p.Pro47HisfsTer39 | p.P47Hfs*39 | P51948 | protein_coding | TCGA-AM-5820-01 | Colorectum | colon adenocarcinoma | Female | <65 | I/II | Unknown | Unknown | SD |
| Page: 1 2 3 |
Top |
Related drugs of malignant transformation related genes |
| Identification of chemicals and drugs interact with genes involved in malignant transfromation |
| (DGIdb 4.0) |
| Entrez ID | Symbol | Category | Interaction Types | Drug Claim Name | Drug Name | PMIDs |
| Page: 1 |

Copyright 2023-Present -The University of Texas Health Science Center at Houston |