
|
|||||
|
 | |
| |
| |
| |
| |
| |
|
Gene: MMS22L |
Gene summary for MMS22L |
| Gene information | Species | Human | Gene symbol | MMS22L | Gene ID | 253714 |
| Gene name | MMS22 like, DNA repair protein | |
| Gene Alias | C6orf167 | |
| Cytomap | 6q16.1 | |
| Gene Type | protein-coding | GO ID | GO:0000724 | UniProtAcc | Q6ZRQ5 |
Top |
Malignant transformation analysis |
| Identification of the aberrant gene expression in precancerous and cancerous lesions by comparing the gene expression of stem-like cells in diseased tissues with normal stem cells |
| Entrez ID | Symbol | Replicates | Species | Organ | Tissue | Adj P-value | Log2FC | Malignancy |
| 253714 | MMS22L | HSIL_HPV_2 | Human | Cervix | HSIL_HPV | 1.74e-02 | 1.93e-01 | 0.0208 |
| 253714 | MMS22L | CCI_1 | Human | Cervix | CC | 7.22e-11 | 8.70e-01 | 0.528 |
| 253714 | MMS22L | CCI_2 | Human | Cervix | CC | 3.02e-11 | 9.88e-01 | 0.5249 |
| 253714 | MMS22L | CCI_3 | Human | Cervix | CC | 6.61e-14 | 1.18e+00 | 0.516 |
| 253714 | MMS22L | sample3 | Human | Cervix | CC | 5.28e-04 | 2.36e-01 | 0.1387 |
| 253714 | MMS22L | T3 | Human | Cervix | CC | 5.92e-03 | 1.96e-01 | 0.1389 |
| 253714 | MMS22L | C04 | Human | Oral cavity | OSCC | 6.78e-07 | 2.88e-01 | 0.2633 |
| 253714 | MMS22L | C21 | Human | Oral cavity | OSCC | 9.07e-10 | 5.16e-01 | 0.2678 |
| 253714 | MMS22L | C30 | Human | Oral cavity | OSCC | 8.97e-07 | 5.07e-01 | 0.3055 |
| 253714 | MMS22L | C38 | Human | Oral cavity | OSCC | 3.52e-05 | 6.89e-01 | 0.172 |
| 253714 | MMS22L | C43 | Human | Oral cavity | OSCC | 2.08e-14 | 2.61e-01 | 0.1704 |
| 253714 | MMS22L | C46 | Human | Oral cavity | OSCC | 3.10e-15 | 4.01e-01 | 0.1673 |
| 253714 | MMS22L | C57 | Human | Oral cavity | OSCC | 4.70e-08 | 3.39e-01 | 0.1679 |
| 253714 | MMS22L | C08 | Human | Oral cavity | OSCC | 1.45e-06 | 1.99e-01 | 0.1919 |
| 253714 | MMS22L | LN22 | Human | Oral cavity | OSCC | 1.64e-04 | 4.65e-01 | 0.1733 |
| 253714 | MMS22L | LN46 | Human | Oral cavity | OSCC | 3.65e-08 | 2.92e-01 | 0.1666 |
| 253714 | MMS22L | SYSMH1 | Human | Oral cavity | OSCC | 1.74e-04 | 1.01e-01 | 0.1127 |
| 253714 | MMS22L | SYSMH2 | Human | Oral cavity | OSCC | 1.57e-04 | 2.91e-01 | 0.2326 |
| 253714 | MMS22L | SYSMH3 | Human | Oral cavity | OSCC | 2.53e-12 | 2.99e-01 | 0.2442 |
| 253714 | MMS22L | PTC05 | Human | Thyroid | PTC | 7.54e-06 | 2.76e-01 | 0.2065 |
| Page: 1 2 |
| Tissue | Expression Dynamics | Abbreviation |
| Cervix | 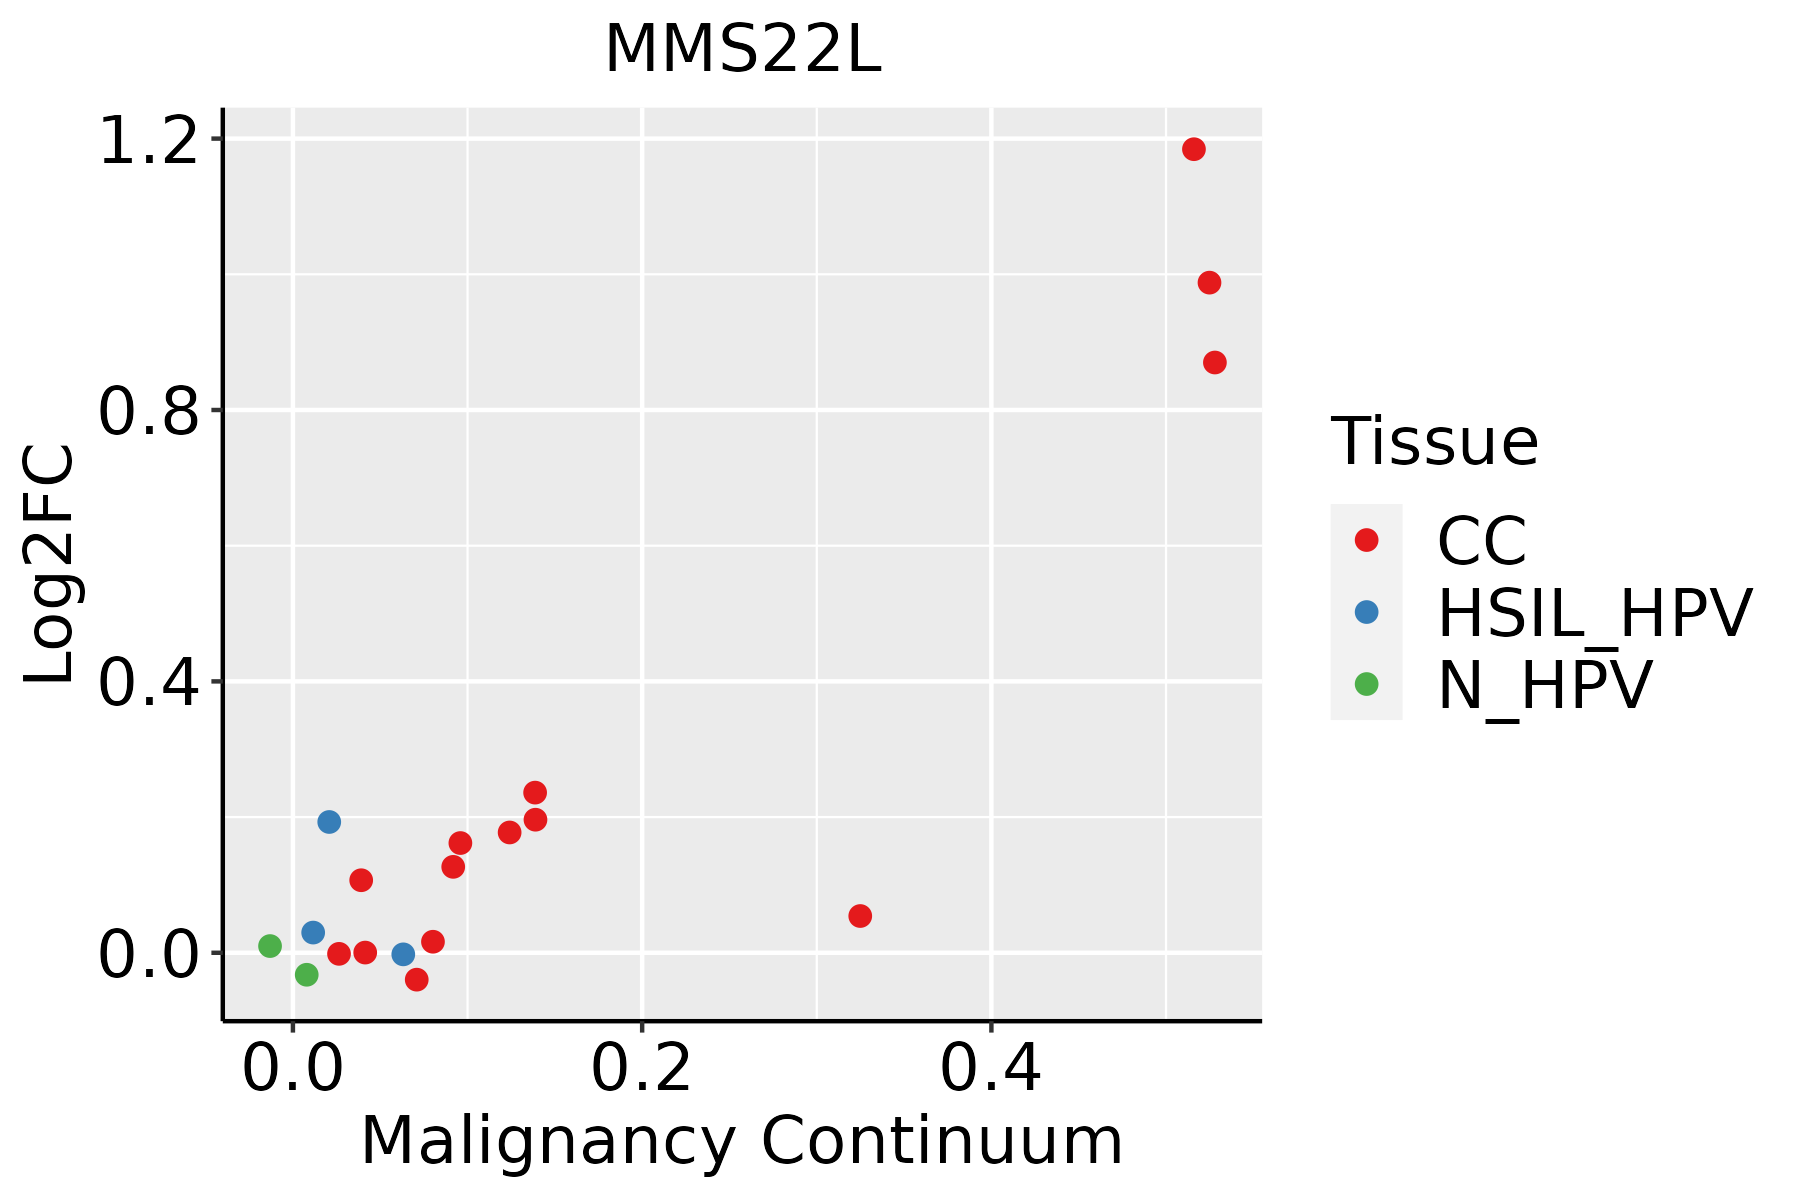 | CC: Cervix cancer |
| HSIL_HPV: HPV-infected high-grade squamous intraepithelial lesions | ||
| N_HPV: HPV-infected normal cervix | ||
| Oral Cavity | 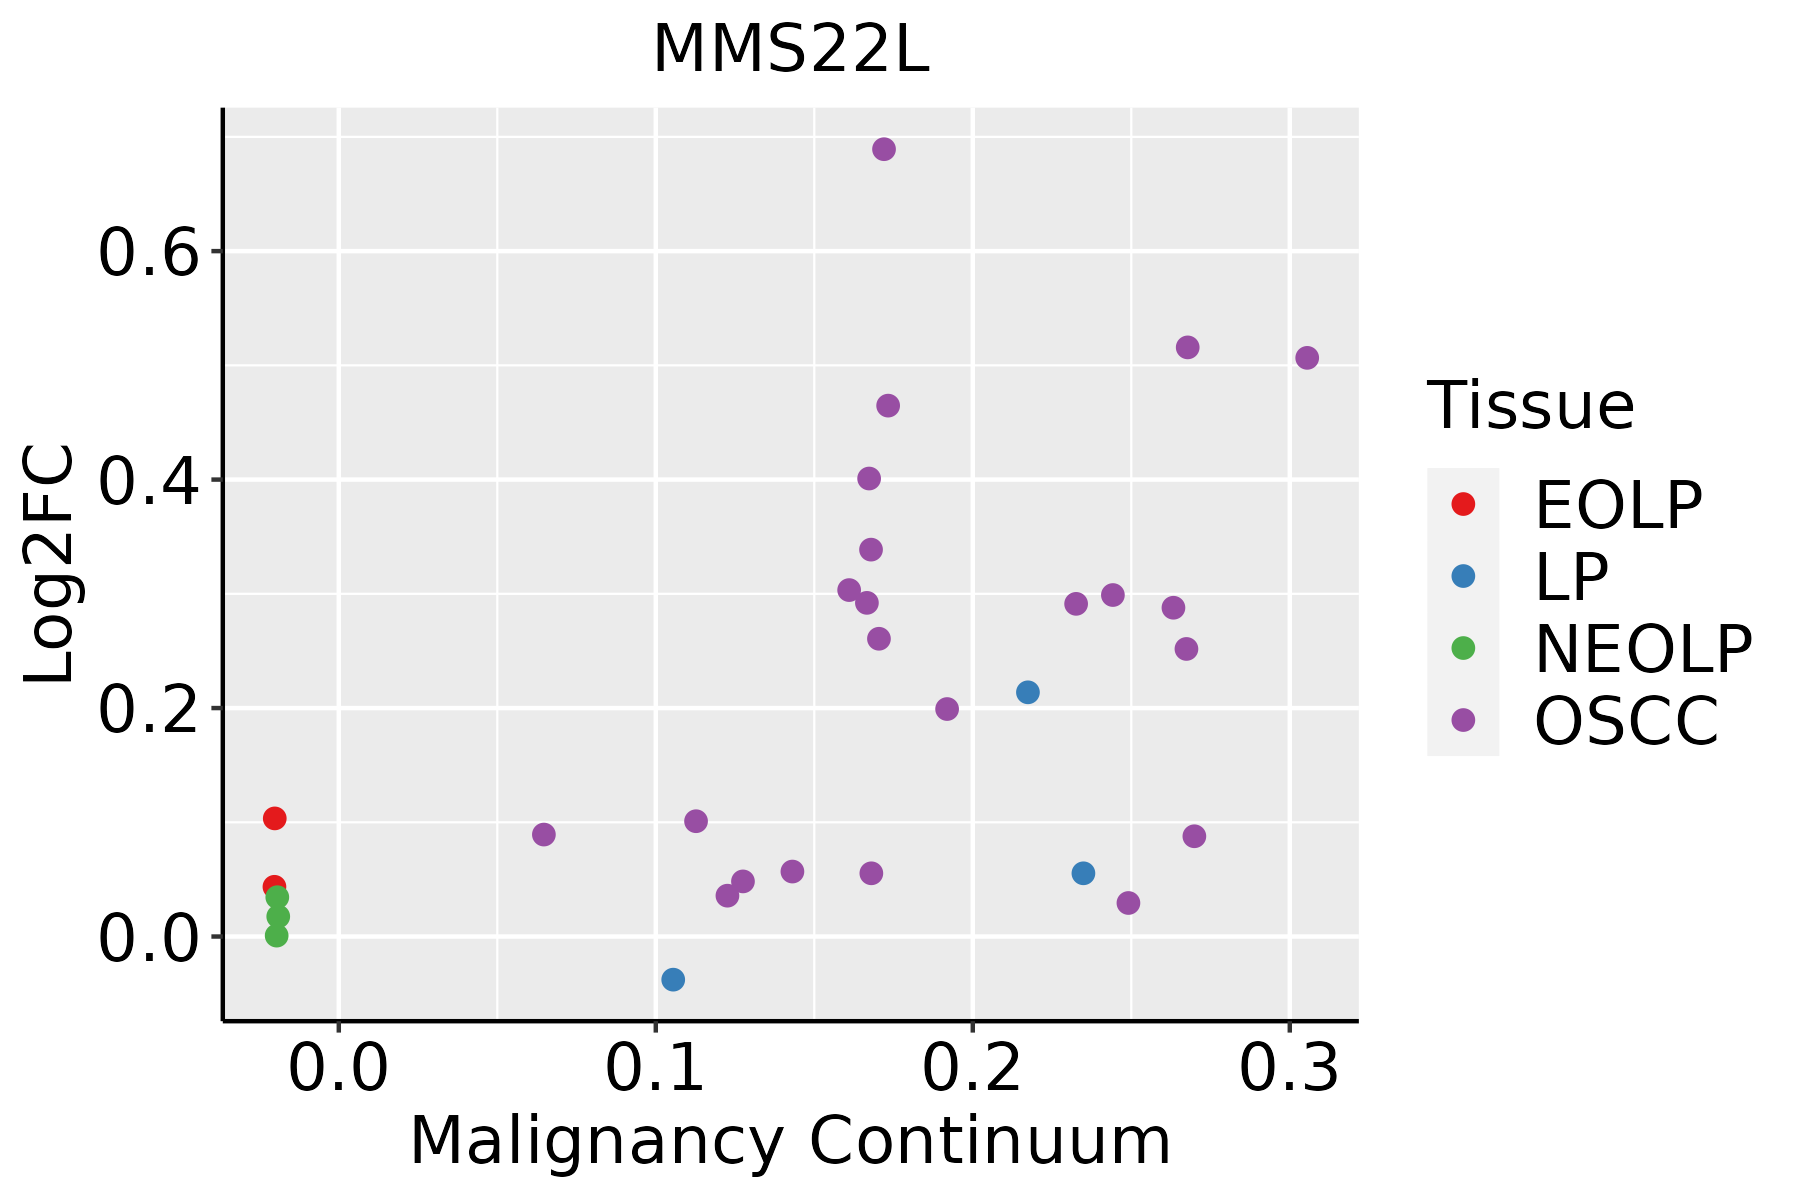 | EOLP: Erosive Oral lichen planus |
| LP: leukoplakia | ||
| NEOLP: Non-erosive oral lichen planus | ||
| OSCC: Oral squamous cell carcinoma | ||
| Thyroid |  | ATC: Anaplastic thyroid cancer |
| HT: Hashimoto's thyroiditis | ||
| PTC: Papillary thyroid cancer |
| ∗log2FC in expression of this searched gene in stem-like cells from each diseased tissue sample relative to stem-like cells in normal samples in each tissue plotted against the malignancy continuum. Samples are colored based on if they are from different disease stage. |
Top |
Malignant transformation related pathway analysis |
| Find out the enriched GO biological processes and KEGG pathways involved in transition from healthy to precancer to cancer |
| Tissue | Disease Stage | Enriched GO biological Processes |
| Colorectum | AD |  |
| Colorectum | SER |  |
| Colorectum | MSS |  |
| Colorectum | MSI-H |  |
| Colorectum | FAP |  |
| ∗Top 15 enriched GO BP terms are showed in the bar plot of each disease state in each tissue. Each row represents a significant GO biological process which is colored according to the -log10(p.adjust). |
| Page: 1 2 3 4 5 6 7 8 9 |
| GO ID | Tissue | Disease Stage | Description | Gene Ratio | Bg Ratio | pvalue | p.adjust | Count |
| GO:00062602 | Cervix | CC | DNA replication | 48/2311 | 260/18723 | 2.70e-03 | 1.85e-02 | 48 |
| GO:00062603 | Oral cavity | OSCC | DNA replication | 159/7305 | 260/18723 | 3.25e-13 | 1.59e-11 | 159 |
| GO:00063023 | Oral cavity | OSCC | double-strand break repair | 132/7305 | 251/18723 | 7.93e-06 | 8.52e-05 | 132 |
| GO:00062611 | Oral cavity | OSCC | DNA-dependent DNA replication | 84/7305 | 151/18723 | 2.46e-05 | 2.30e-04 | 84 |
| GO:0006310 | Oral cavity | OSCC | DNA recombination | 147/7305 | 305/18723 | 6.33e-04 | 3.56e-03 | 147 |
| GO:0000725 | Oral cavity | OSCC | recombinational repair | 70/7305 | 140/18723 | 5.22e-03 | 2.03e-02 | 70 |
| GO:0000724 | Oral cavity | OSCC | double-strand break repair via homologous recombination | 69/7305 | 138/18723 | 5.52e-03 | 2.14e-02 | 69 |
| GO:00062606 | Thyroid | PTC | DNA replication | 114/5968 | 260/18723 | 3.09e-05 | 2.95e-04 | 114 |
| GO:00063026 | Thyroid | PTC | double-strand break repair | 103/5968 | 251/18723 | 1.30e-03 | 7.40e-03 | 103 |
| GO:000626013 | Thyroid | ATC | DNA replication | 124/6293 | 260/18723 | 1.58e-06 | 1.93e-05 | 124 |
| GO:000630212 | Thyroid | ATC | double-strand break repair | 110/6293 | 251/18723 | 4.48e-04 | 2.65e-03 | 110 |
| Page: 1 |
| Pathway ID | Tissue | Disease Stage | Description | Gene Ratio | Bg Ratio | pvalue | p.adjust | qvalue | Count |
| Page: 1 |
Top |
Cell-cell communication analysis |
| Identification of potential cell-cell interactions between two cell types and their ligand-receptor pairs for different disease states |
| Ligand | Receptor | LRpair | Pathway | Tissue | Disease Stage |
| Page: 1 |
Top |
Single-cell gene regulatory network inference analysis |
| Find out the significant the regulons (TFs) and the target genes of each regulon across cell types for different disease states |
| TF | Cell Type | Tissue | Disease Stage | Target Gene | RSS | Regulon Activity |
| ∗The dot plots of a searched regulon are shown for all cell subpopulations in each disease state of each tissue based on the regulon specific score inferred using pySCENIC and by calculating the average expression. |
| Page: 1 |
Top |
Somatic mutation of malignant transformation related genes |
| Annotation of somatic variants for genes involved in malignant transformation |
| Hugo Symbol | Variant Class | Variant Classification | dbSNP RS | HGVSc | HGVSp | HGVSp Short | SWISSPROT | BIOTYPE | SIFT | PolyPhen | Tumor Sample Barcode | Tissue | Histology | Sex | Age | Stage | Therapy Types | Drugs | Outcome |
| MMS22L | SNV | Missense_Mutation | rs148291789 | c.2219N>T | p.Ala740Val | p.A740V | Q6ZRQ5 | protein_coding | deleterious(0.01) | probably_damaging(0.993) | TCGA-A1-A0SP-01 | Breast | breast invasive carcinoma | Female | <65 | I/II | Chemotherapy | SD | |
| MMS22L | SNV | Missense_Mutation | c.809C>T | p.Ser270Leu | p.S270L | Q6ZRQ5 | protein_coding | deleterious(0) | benign(0.436) | TCGA-A2-A0YK-01 | Breast | breast invasive carcinoma | Female | <65 | I/II | Chemotherapy | cytoxan | SD | |
| MMS22L | SNV | Missense_Mutation | c.2470A>G | p.Met824Val | p.M824V | Q6ZRQ5 | protein_coding | deleterious(0.03) | benign(0.155) | TCGA-BH-A0B0-01 | Breast | breast invasive carcinoma | Female | <65 | I/II | Chemotherapy | adriamycin | CR | |
| MMS22L | SNV | Missense_Mutation | novel | c.1330C>T | p.Pro444Ser | p.P444S | Q6ZRQ5 | protein_coding | tolerated(0.18) | benign(0.213) | TCGA-GM-A2D9-01 | Breast | breast invasive carcinoma | Female | >=65 | I/II | Hormone Therapy | arimidex | SD |
| MMS22L | insertion | Frame_Shift_Ins | novel | c.740_741insT | p.Asn248GlnfsTer9 | p.N248Qfs*9 | Q6ZRQ5 | protein_coding | TCGA-AR-A0TY-01 | Breast | breast invasive carcinoma | Female | <65 | I/II | Unspecific | Paclitaxel | PD | ||
| MMS22L | insertion | In_Frame_Ins | novel | c.739_740insCTTTTTGGGGTC | p.Asp247delinsAlaPheTrpGlyHis | p.D247delinsAFWGH | Q6ZRQ5 | protein_coding | TCGA-AR-A0TY-01 | Breast | breast invasive carcinoma | Female | <65 | I/II | Unspecific | Paclitaxel | PD | ||
| MMS22L | SNV | Missense_Mutation | novel | c.1010N>T | p.Ser337Phe | p.S337F | Q6ZRQ5 | protein_coding | tolerated(0.7) | benign(0) | TCGA-HM-A4S6-01 | Cervix | cervical & endocervical cancer | Female | <65 | III/IV | Chemotherapy | cisplatin | CR |
| MMS22L | SNV | Missense_Mutation | c.1069N>T | p.His357Tyr | p.H357Y | Q6ZRQ5 | protein_coding | deleterious(0) | possibly_damaging(0.877) | TCGA-IR-A3LI-01 | Cervix | cervical & endocervical cancer | Female | <65 | I/II | Chemotherapy | cisplatin | CR | |
| MMS22L | SNV | Missense_Mutation | novel | c.1580N>A | p.Gly527Asp | p.G527D | Q6ZRQ5 | protein_coding | deleterious(0) | probably_damaging(0.961) | TCGA-VS-A952-01 | Cervix | cervical & endocervical cancer | Female | >=65 | I/II | Unknown | Unknown | SD |
| MMS22L | SNV | Missense_Mutation | c.2002N>C | p.Val668Leu | p.V668L | Q6ZRQ5 | protein_coding | tolerated(0.05) | benign(0.039) | TCGA-A6-2686-01 | Colorectum | colon adenocarcinoma | Female | >=65 | I/II | Unknown | Unknown | SD |
| Page: 1 2 3 4 5 6 7 8 9 10 11 12 13 14 |
Top |
Related drugs of malignant transformation related genes |
| Identification of chemicals and drugs interact with genes involved in malignant transfromation |
| (DGIdb 4.0) |
| Entrez ID | Symbol | Category | Interaction Types | Drug Claim Name | Drug Name | PMIDs |
| Page: 1 |

Copyright 2023-Present -The University of Texas Health Science Center at Houston |