
|
|||||
|
 | |
| |
| |
| |
| |
| |
|
Gene: MMP9 |
Gene summary for MMP9 |
| Gene information | Species | Human | Gene symbol | MMP9 | Gene ID | 4318 |
| Gene name | matrix metallopeptidase 9 | |
| Gene Alias | CLG4B | |
| Cytomap | 20q13.12 | |
| Gene Type | protein-coding | GO ID | GO:0000003 | UniProtAcc | P14780 |
Top |
Malignant transformation analysis |
| Identification of the aberrant gene expression in precancerous and cancerous lesions by comparing the gene expression of stem-like cells in diseased tissues with normal stem cells |
| Entrez ID | Symbol | Replicates | Species | Organ | Tissue | Adj P-value | Log2FC | Malignancy |
| 4318 | MMP9 | P37T-E | Human | Esophagus | ESCC | 2.83e-10 | 8.69e-01 | 0.1371 |
| 4318 | MMP9 | P76T-E | Human | Esophagus | ESCC | 9.35e-10 | 1.01e+00 | 0.1207 |
| 4318 | MMP9 | P89T-E | Human | Esophagus | ESCC | 5.92e-05 | 1.23e+00 | 0.1752 |
| 4318 | MMP9 | P126T-E | Human | Esophagus | ESCC | 3.52e-08 | 2.80e+00 | 0.1125 |
| 4318 | MMP9 | P130T-E | Human | Esophagus | ESCC | 1.88e-11 | 6.35e-01 | 0.1676 |
| 4318 | MMP9 | C04 | Human | Oral cavity | OSCC | 3.02e-07 | 1.05e+00 | 0.2633 |
| 4318 | MMP9 | C21 | Human | Oral cavity | OSCC | 1.47e-56 | 3.28e+00 | 0.2678 |
| 4318 | MMP9 | C30 | Human | Oral cavity | OSCC | 2.90e-15 | 1.15e+00 | 0.3055 |
| 4318 | MMP9 | C43 | Human | Oral cavity | OSCC | 3.95e-11 | 1.46e+00 | 0.1704 |
| 4318 | MMP9 | C51 | Human | Oral cavity | OSCC | 1.74e-06 | 2.93e-01 | 0.2674 |
| 4318 | MMP9 | C06 | Human | Oral cavity | OSCC | 6.15e-08 | 2.04e+00 | 0.2699 |
| 4318 | MMP9 | C08 | Human | Oral cavity | OSCC | 7.87e-03 | 3.22e-01 | 0.1919 |
| 4318 | MMP9 | LN22 | Human | Oral cavity | OSCC | 2.77e-04 | 4.02e-01 | 0.1733 |
| 4318 | MMP9 | SYSMH5 | Human | Oral cavity | OSCC | 2.01e-07 | 5.59e-01 | 0.0647 |
| Page: 1 |
| Tissue | Expression Dynamics | Abbreviation |
| Esophagus | 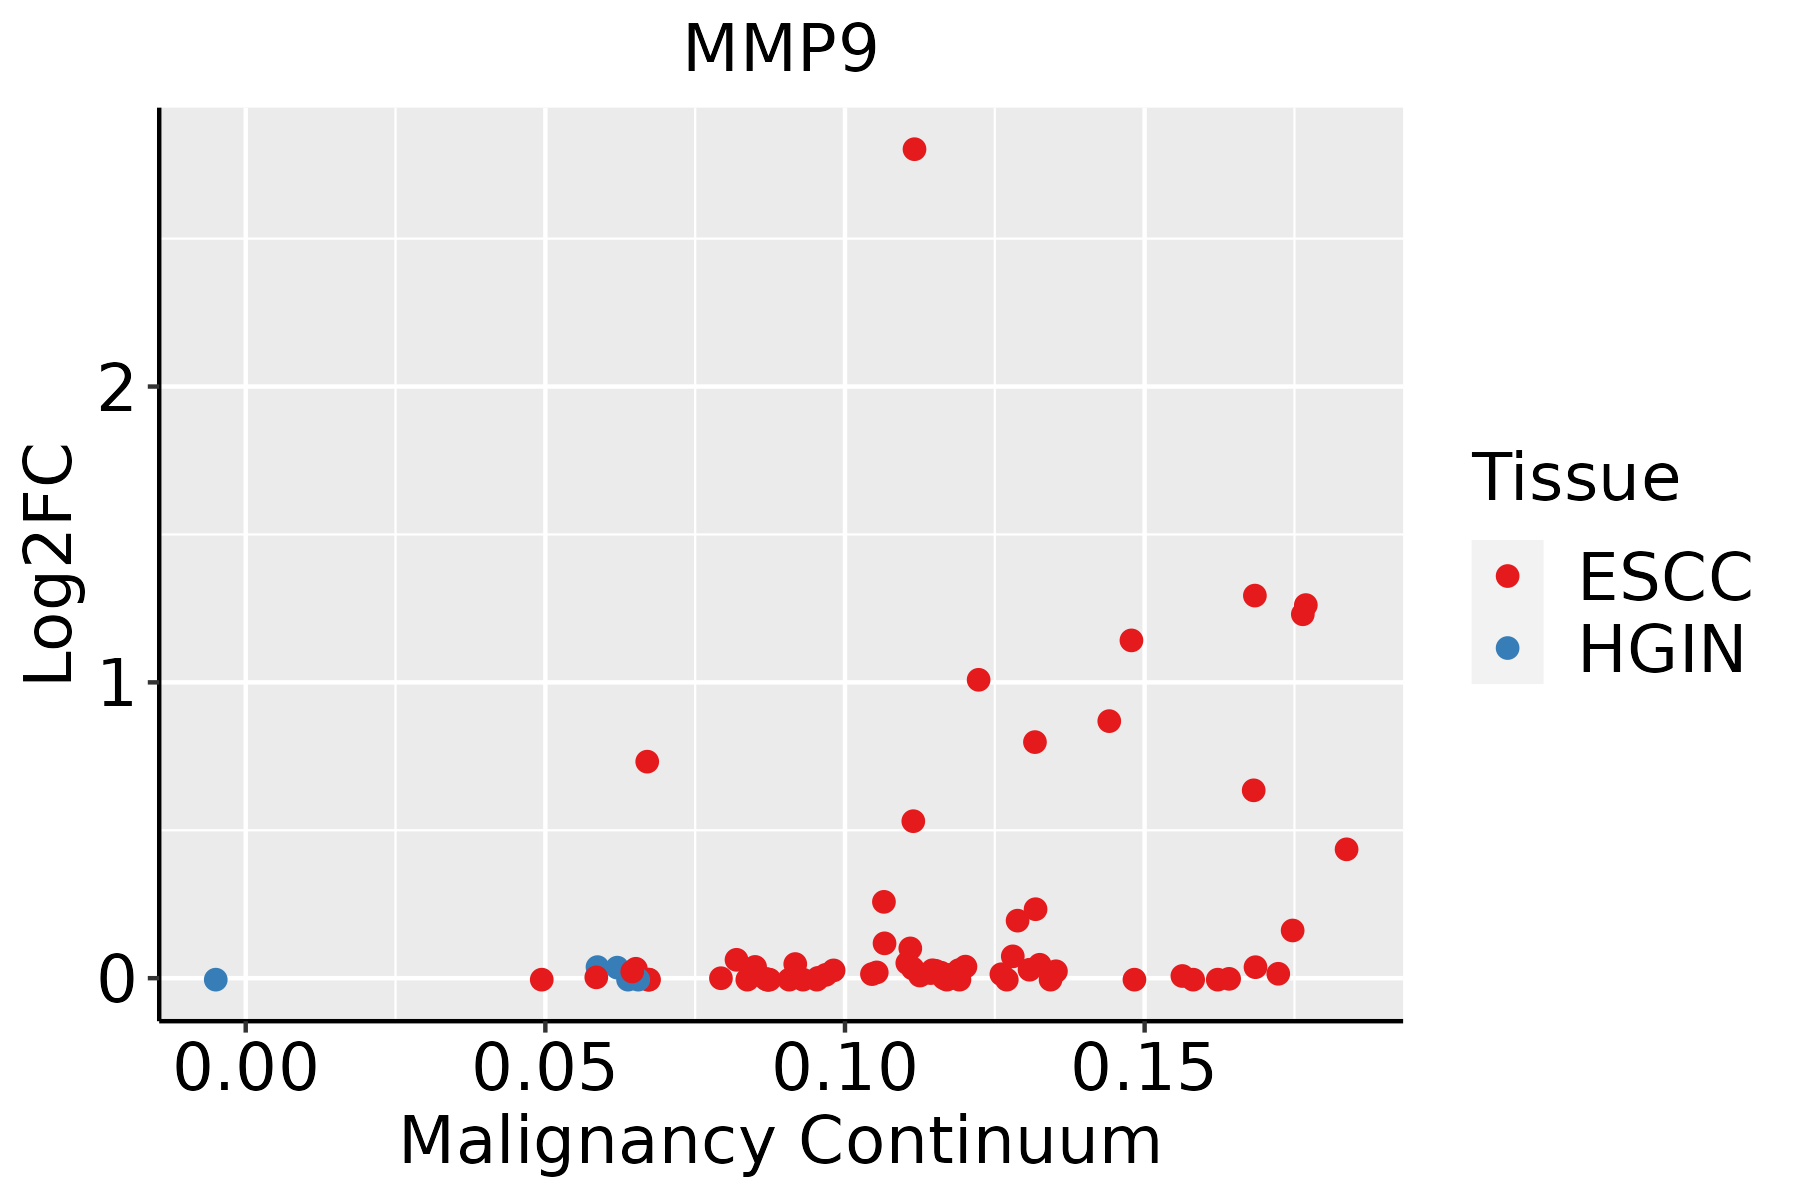 | ESCC: Esophageal squamous cell carcinoma |
| HGIN: High-grade intraepithelial neoplasias | ||
| LGIN: Low-grade intraepithelial neoplasias | ||
| Oral Cavity |  | EOLP: Erosive Oral lichen planus |
| LP: leukoplakia | ||
| NEOLP: Non-erosive oral lichen planus | ||
| OSCC: Oral squamous cell carcinoma |
| ∗log2FC in expression of this searched gene in stem-like cells from each diseased tissue sample relative to stem-like cells in normal samples in each tissue plotted against the malignancy continuum. Samples are colored based on if they are from different disease stage. |
Top |
Malignant transformation related pathway analysis |
| Find out the enriched GO biological processes and KEGG pathways involved in transition from healthy to precancer to cancer |
| Tissue | Disease Stage | Enriched GO biological Processes |
| Colorectum | AD |  |
| Colorectum | SER |  |
| Colorectum | MSS |  |
| Colorectum | MSI-H |  |
| Colorectum | FAP |  |
| ∗Top 15 enriched GO BP terms are showed in the bar plot of each disease state in each tissue. Each row represents a significant GO biological process which is colored according to the -log10(p.adjust). |
| Page: 1 2 3 4 5 6 7 8 9 |
| GO ID | Tissue | Disease Stage | Description | Gene Ratio | Bg Ratio | pvalue | p.adjust | Count |
| GO:0097193111 | Esophagus | ESCC | intrinsic apoptotic signaling pathway | 222/8552 | 288/18723 | 5.87e-28 | 2.02e-25 | 222 |
| GO:2001233111 | Esophagus | ESCC | regulation of apoptotic signaling pathway | 256/8552 | 356/18723 | 4.11e-24 | 1.04e-21 | 256 |
| GO:0022411111 | Esophagus | ESCC | cellular component disassembly | 305/8552 | 443/18723 | 1.94e-23 | 4.57e-21 | 305 |
| GO:0006979111 | Esophagus | ESCC | response to oxidative stress | 303/8552 | 446/18723 | 7.15e-22 | 1.30e-19 | 303 |
| GO:0051098111 | Esophagus | ESCC | regulation of binding | 251/8552 | 363/18723 | 6.73e-20 | 8.46e-18 | 251 |
| GO:0062197111 | Esophagus | ESCC | cellular response to chemical stress | 234/8552 | 337/18723 | 5.37e-19 | 5.97e-17 | 234 |
| GO:2001242111 | Esophagus | ESCC | regulation of intrinsic apoptotic signaling pathway | 128/8552 | 164/18723 | 1.75e-17 | 1.50e-15 | 128 |
| GO:2001234111 | Esophagus | ESCC | negative regulation of apoptotic signaling pathway | 161/8552 | 224/18723 | 1.24e-15 | 8.09e-14 | 161 |
| GO:000941113 | Esophagus | ESCC | response to UV | 115/8552 | 149/18723 | 3.29e-15 | 1.93e-13 | 115 |
| GO:0034599111 | Esophagus | ESCC | cellular response to oxidative stress | 197/8552 | 288/18723 | 3.76e-15 | 2.15e-13 | 197 |
| GO:0010821110 | Esophagus | ESCC | regulation of mitochondrion organization | 107/8552 | 144/18723 | 2.31e-12 | 9.41e-11 | 107 |
| GO:2001243111 | Esophagus | ESCC | negative regulation of intrinsic apoptotic signaling pathway | 78/8552 | 98/18723 | 5.50e-12 | 2.10e-10 | 78 |
| GO:0008637110 | Esophagus | ESCC | apoptotic mitochondrial changes | 83/8552 | 107/18723 | 1.43e-11 | 5.08e-10 | 83 |
| GO:2000116111 | Esophagus | ESCC | regulation of cysteine-type endopeptidase activity | 158/8552 | 235/18723 | 1.67e-11 | 5.90e-10 | 158 |
| GO:0043281111 | Esophagus | ESCC | regulation of cysteine-type endopeptidase activity involved in apoptotic process | 143/8552 | 209/18723 | 2.12e-11 | 7.31e-10 | 143 |
| GO:0051099111 | Esophagus | ESCC | positive regulation of binding | 122/8552 | 173/18723 | 2.79e-11 | 9.45e-10 | 122 |
| GO:0000302111 | Esophagus | ESCC | response to reactive oxygen species | 150/8552 | 222/18723 | 3.06e-11 | 1.02e-09 | 150 |
| GO:004339320 | Esophagus | ESCC | regulation of protein binding | 135/8552 | 196/18723 | 3.69e-11 | 1.22e-09 | 135 |
| GO:000931419 | Esophagus | ESCC | response to radiation | 277/8552 | 456/18723 | 4.42e-11 | 1.43e-09 | 277 |
| GO:003464413 | Esophagus | ESCC | cellular response to UV | 70/8552 | 90/18723 | 4.59e-10 | 1.20e-08 | 70 |
| Page: 1 2 3 4 5 6 7 8 |
| Pathway ID | Tissue | Disease Stage | Description | Gene Ratio | Bg Ratio | pvalue | p.adjust | qvalue | Count |
| hsa046689 | Oral cavity | OSCC | TNF signaling pathway | 82/3704 | 114/8465 | 8.30e-10 | 9.59e-09 | 4.88e-09 | 82 |
| hsa0541529 | Oral cavity | OSCC | Diabetic cardiomyopathy | 131/3704 | 203/8465 | 1.33e-09 | 1.49e-08 | 7.57e-09 | 131 |
| hsa0520526 | Oral cavity | OSCC | Proteoglycans in cancer | 128/3704 | 205/8465 | 4.00e-08 | 3.12e-07 | 1.59e-07 | 128 |
| hsa0541830 | Oral cavity | OSCC | Fluid shear stress and atherosclerosis | 92/3704 | 139/8465 | 6.51e-08 | 4.84e-07 | 2.47e-07 | 92 |
| hsa0541730 | Oral cavity | OSCC | Lipid and atherosclerosis | 131/3704 | 215/8465 | 2.20e-07 | 1.45e-06 | 7.37e-07 | 131 |
| hsa051618 | Oral cavity | OSCC | Hepatitis B | 103/3704 | 162/8465 | 2.34e-07 | 1.51e-06 | 7.69e-07 | 103 |
| hsa0521510 | Oral cavity | OSCC | Prostate cancer | 66/3704 | 97/8465 | 1.05e-06 | 5.89e-06 | 3.00e-06 | 66 |
| hsa0465724 | Oral cavity | OSCC | IL-17 signaling pathway | 64/3704 | 94/8465 | 1.48e-06 | 7.87e-06 | 4.01e-06 | 64 |
| hsa052199 | Oral cavity | OSCC | Bladder cancer | 32/3704 | 41/8465 | 7.73e-06 | 3.59e-05 | 1.83e-05 | 32 |
| hsa015226 | Oral cavity | OSCC | Endocrine resistance | 63/3704 | 98/8465 | 3.09e-05 | 1.31e-04 | 6.67e-05 | 63 |
| hsa049267 | Oral cavity | OSCC | Relaxin signaling pathway | 74/3704 | 129/8465 | 1.20e-03 | 3.37e-03 | 1.72e-03 | 74 |
| hsa0467030 | Oral cavity | OSCC | Leukocyte transendothelial migration | 63/3704 | 114/8465 | 8.46e-03 | 1.96e-02 | 9.95e-03 | 63 |
| hsa0466816 | Oral cavity | OSCC | TNF signaling pathway | 82/3704 | 114/8465 | 8.30e-10 | 9.59e-09 | 4.88e-09 | 82 |
| hsa05415113 | Oral cavity | OSCC | Diabetic cardiomyopathy | 131/3704 | 203/8465 | 1.33e-09 | 1.49e-08 | 7.57e-09 | 131 |
| hsa05205111 | Oral cavity | OSCC | Proteoglycans in cancer | 128/3704 | 205/8465 | 4.00e-08 | 3.12e-07 | 1.59e-07 | 128 |
| hsa05418114 | Oral cavity | OSCC | Fluid shear stress and atherosclerosis | 92/3704 | 139/8465 | 6.51e-08 | 4.84e-07 | 2.47e-07 | 92 |
| hsa05417113 | Oral cavity | OSCC | Lipid and atherosclerosis | 131/3704 | 215/8465 | 2.20e-07 | 1.45e-06 | 7.37e-07 | 131 |
| hsa0516113 | Oral cavity | OSCC | Hepatitis B | 103/3704 | 162/8465 | 2.34e-07 | 1.51e-06 | 7.69e-07 | 103 |
| hsa0521515 | Oral cavity | OSCC | Prostate cancer | 66/3704 | 97/8465 | 1.05e-06 | 5.89e-06 | 3.00e-06 | 66 |
| hsa04657112 | Oral cavity | OSCC | IL-17 signaling pathway | 64/3704 | 94/8465 | 1.48e-06 | 7.87e-06 | 4.01e-06 | 64 |
| Page: 1 2 |
Top |
Cell-cell communication analysis |
| Identification of potential cell-cell interactions between two cell types and their ligand-receptor pairs for different disease states |
| Ligand | Receptor | LRpair | Pathway | Tissue | Disease Stage |
| Page: 1 |
Top |
Single-cell gene regulatory network inference analysis |
| Find out the significant the regulons (TFs) and the target genes of each regulon across cell types for different disease states |
| TF | Cell Type | Tissue | Disease Stage | Target Gene | RSS | Regulon Activity |
| ∗The dot plots of a searched regulon are shown for all cell subpopulations in each disease state of each tissue based on the regulon specific score inferred using pySCENIC and by calculating the average expression. |
| Page: 1 |
Top |
Somatic mutation of malignant transformation related genes |
| Annotation of somatic variants for genes involved in malignant transformation |
| Hugo Symbol | Variant Class | Variant Classification | dbSNP RS | HGVSc | HGVSp | HGVSp Short | SWISSPROT | BIOTYPE | SIFT | PolyPhen | Tumor Sample Barcode | Tissue | Histology | Sex | Age | Stage | Therapy Types | Drugs | Outcome |
| MMP9 | SNV | Missense_Mutation | c.901N>A | p.Ala301Thr | p.A301T | P14780 | protein_coding | tolerated(0.3) | benign(0.001) | TCGA-A8-A082-01 | Breast | breast invasive carcinoma | Female | <65 | I/II | Chemotherapy | 5-fluorouracil | CR | |
| MMP9 | SNV | Missense_Mutation | rs139620474 | c.151N>T | p.Arg51Cys | p.R51C | P14780 | protein_coding | deleterious(0) | probably_damaging(0.997) | TCGA-D8-A1XB-01 | Breast | breast invasive carcinoma | Female | <65 | I/II | Unknown | Unknown | SD |
| MMP9 | SNV | Missense_Mutation | c.1743C>A | p.Phe581Leu | p.F581L | P14780 | protein_coding | deleterious(0.03) | possibly_damaging(0.848) | TCGA-GM-A2D9-01 | Breast | breast invasive carcinoma | Female | >=65 | I/II | Hormone Therapy | arimidex | SD | |
| MMP9 | SNV | Missense_Mutation | c.1397N>T | p.Thr466Met | p.T466M | P14780 | protein_coding | deleterious(0.03) | possibly_damaging(0.635) | TCGA-ZX-AA5X-01 | Cervix | cervical & endocervical cancer | Female | <65 | III/IV | Unknown | Unknown | SD | |
| MMP9 | SNV | Missense_Mutation | c.793G>A | p.Asp265Asn | p.D265N | P14780 | protein_coding | deleterious(0) | probably_damaging(0.997) | TCGA-4N-A93T-01 | Colorectum | colon adenocarcinoma | Male | >=65 | III/IV | Chemotherapy | xeloda | SD | |
| MMP9 | SNV | Missense_Mutation | c.322N>G | p.Gln108Glu | p.Q108E | P14780 | protein_coding | tolerated(0.25) | possibly_damaging(0.516) | TCGA-A6-2671-01 | Colorectum | colon adenocarcinoma | Male | >=65 | III/IV | Other, specify in notesProtocol AMG 20060464 | study | PD | |
| MMP9 | SNV | Missense_Mutation | rs200118434 | c.2030N>A | p.Arg677His | p.R677H | P14780 | protein_coding | tolerated(0.16) | possibly_damaging(0.626) | TCGA-A6-2686-01 | Colorectum | colon adenocarcinoma | Female | >=65 | I/II | Unknown | Unknown | SD |
| MMP9 | SNV | Missense_Mutation | c.1337N>A | p.Arg446His | p.R446H | P14780 | protein_coding | tolerated(0.09) | benign(0.007) | TCGA-A6-5665-01 | Colorectum | colon adenocarcinoma | Female | >=65 | I/II | Unknown | Unknown | PD | |
| MMP9 | SNV | Missense_Mutation | c.1646N>A | p.Arg549Gln | p.R549Q | P14780 | protein_coding | tolerated(0.37) | benign(0.101) | TCGA-A6-6654-01 | Colorectum | colon adenocarcinoma | Female | >=65 | III/IV | Chemotherapy | oxaliplatin | SD | |
| MMP9 | SNV | Missense_Mutation | c.1099N>A | p.Gly367Arg | p.G367R | P14780 | protein_coding | tolerated(0.25) | benign(0.007) | TCGA-AA-3672-01 | Colorectum | colon adenocarcinoma | Female | >=65 | III/IV | Unknown | Unknown | SD |
| Page: 1 2 3 4 5 6 7 8 9 10 11 |
Top |
Related drugs of malignant transformation related genes |
| Identification of chemicals and drugs interact with genes involved in malignant transfromation |
| (DGIdb 4.0) |
| Entrez ID | Symbol | Category | Interaction Types | Drug Claim Name | Drug Name | PMIDs |
| 4318 | MMP9 | DRUGGABLE GENOME, PROTEASE, ENZYME, NEUTRAL ZINC METALLOPEPTIDASE, DRUG RESISTANCE | celecoxib | CELECOXIB | 22336956 | |
| 4318 | MMP9 | DRUGGABLE GENOME, PROTEASE, ENZYME, NEUTRAL ZINC METALLOPEPTIDASE, DRUG RESISTANCE | inhibitor | 223366154 | ||
| 4318 | MMP9 | DRUGGABLE GENOME, PROTEASE, ENZYME, NEUTRAL ZINC METALLOPEPTIDASE, DRUG RESISTANCE | MARIMASTAT | MARIMASTAT | ||
| 4318 | MMP9 | DRUGGABLE GENOME, PROTEASE, ENZYME, NEUTRAL ZINC METALLOPEPTIDASE, DRUG RESISTANCE | GM6001 | |||
| 4318 | MMP9 | DRUGGABLE GENOME, PROTEASE, ENZYME, NEUTRAL ZINC METALLOPEPTIDASE, DRUG RESISTANCE | antibody | 329968449 | ANDECALIXIMAB | |
| 4318 | MMP9 | DRUGGABLE GENOME, PROTEASE, ENZYME, NEUTRAL ZINC METALLOPEPTIDASE, DRUG RESISTANCE | PMID29130358-Compound-Figure17(11) | |||
| 4318 | MMP9 | DRUGGABLE GENOME, PROTEASE, ENZYME, NEUTRAL ZINC METALLOPEPTIDASE, DRUG RESISTANCE | inhibitor | 329968448 | ||
| 4318 | MMP9 | DRUGGABLE GENOME, PROTEASE, ENZYME, NEUTRAL ZINC METALLOPEPTIDASE, DRUG RESISTANCE | Curcumin | CURCUMIN | ||
| 4318 | MMP9 | DRUGGABLE GENOME, PROTEASE, ENZYME, NEUTRAL ZINC METALLOPEPTIDASE, DRUG RESISTANCE | PMID29130358-Compound-Figure17(10) | |||
| 4318 | MMP9 | DRUGGABLE GENOME, PROTEASE, ENZYME, NEUTRAL ZINC METALLOPEPTIDASE, DRUG RESISTANCE | inhibitor | 178103128 |
| Page: 1 2 3 4 |

Copyright 2023-Present -The University of Texas Health Science Center at Houston |