
|
|||||
|
 | |
| |
| |
| |
| |
| |
|
Gene: MMP3 |
Gene summary for MMP3 |
| Gene information | Species | Human | Gene symbol | MMP3 | Gene ID | 4314 |
| Gene name | matrix metallopeptidase 3 | |
| Gene Alias | CHDS6 | |
| Cytomap | 11q22.2 | |
| Gene Type | protein-coding | GO ID | GO:0006508 | UniProtAcc | P08254 |
Top |
Malignant transformation analysis |
| Identification of the aberrant gene expression in precancerous and cancerous lesions by comparing the gene expression of stem-like cells in diseased tissues with normal stem cells |
| Entrez ID | Symbol | Replicates | Species | Organ | Tissue | Adj P-value | Log2FC | Malignancy |
| 4314 | MMP3 | GSM4909277 | Human | Breast | Precancer | 1.37e-04 | 7.14e-01 | 0.0177 |
| 4314 | MMP3 | brca7 | Human | Breast | Precancer | 2.21e-05 | 5.37e-01 | -0.009 |
| 4314 | MMP3 | P21T-E | Human | Esophagus | ESCC | 8.01e-10 | 1.07e+00 | 0.1617 |
| 4314 | MMP3 | P56T-E | Human | Esophagus | ESCC | 3.51e-02 | 7.00e-01 | 0.1613 |
| 4314 | MMP3 | P61T-E | Human | Esophagus | ESCC | 9.57e-03 | 3.38e-01 | 0.099 |
| 4314 | MMP3 | RNA-P7T1-P7T1-1 | Human | Lung | AIS | 1.98e-07 | 6.31e-01 | -0.0961 |
| 4314 | MMP3 | RNA-P7T1-P7T1-2 | Human | Lung | AIS | 1.59e-10 | 7.13e-01 | -0.0876 |
| 4314 | MMP3 | RNA-P7T1-P7T1-3 | Human | Lung | AIS | 1.49e-08 | 6.75e-01 | -0.0822 |
| 4314 | MMP3 | RNA-P7T1-P7T1-4 | Human | Lung | AIS | 1.58e-07 | 5.79e-01 | -0.0809 |
| 4314 | MMP3 | C04 | Human | Oral cavity | OSCC | 1.10e-26 | 2.16e+00 | 0.2633 |
| 4314 | MMP3 | C21 | Human | Oral cavity | OSCC | 7.38e-22 | 1.44e+00 | 0.2678 |
| 4314 | MMP3 | C06 | Human | Oral cavity | OSCC | 1.88e-20 | 1.69e+00 | 0.2699 |
| 4314 | MMP3 | SYSMH2 | Human | Oral cavity | OSCC | 2.35e-09 | 1.14e+00 | 0.2326 |
| 4314 | MMP3 | SYSMH3 | Human | Oral cavity | OSCC | 1.89e-36 | 2.92e+00 | 0.2442 |
| 4314 | MMP3 | SYSMH5 | Human | Oral cavity | OSCC | 1.07e-30 | 1.55e+00 | 0.0647 |
| 4314 | MMP3 | P5_S10_cSCC | Human | Skin | cSCC | 6.36e-20 | 4.13e-01 | -0.299 |
| 4314 | MMP3 | P1_cSCC | Human | Skin | cSCC | 3.04e-09 | 7.02e-01 | 0.0292 |
| 4314 | MMP3 | P10_cSCC | Human | Skin | cSCC | 1.12e-72 | 3.12e+00 | 0.1017 |
| Page: 1 |
| Tissue | Expression Dynamics | Abbreviation |
| Breast |  | IDC: Invasive ductal carcinoma |
| DCIS: Ductal carcinoma in situ | ||
| Precancer(BRCA1-mut): Precancerous lesion from BRCA1 mutation carriers | ||
| Esophagus | 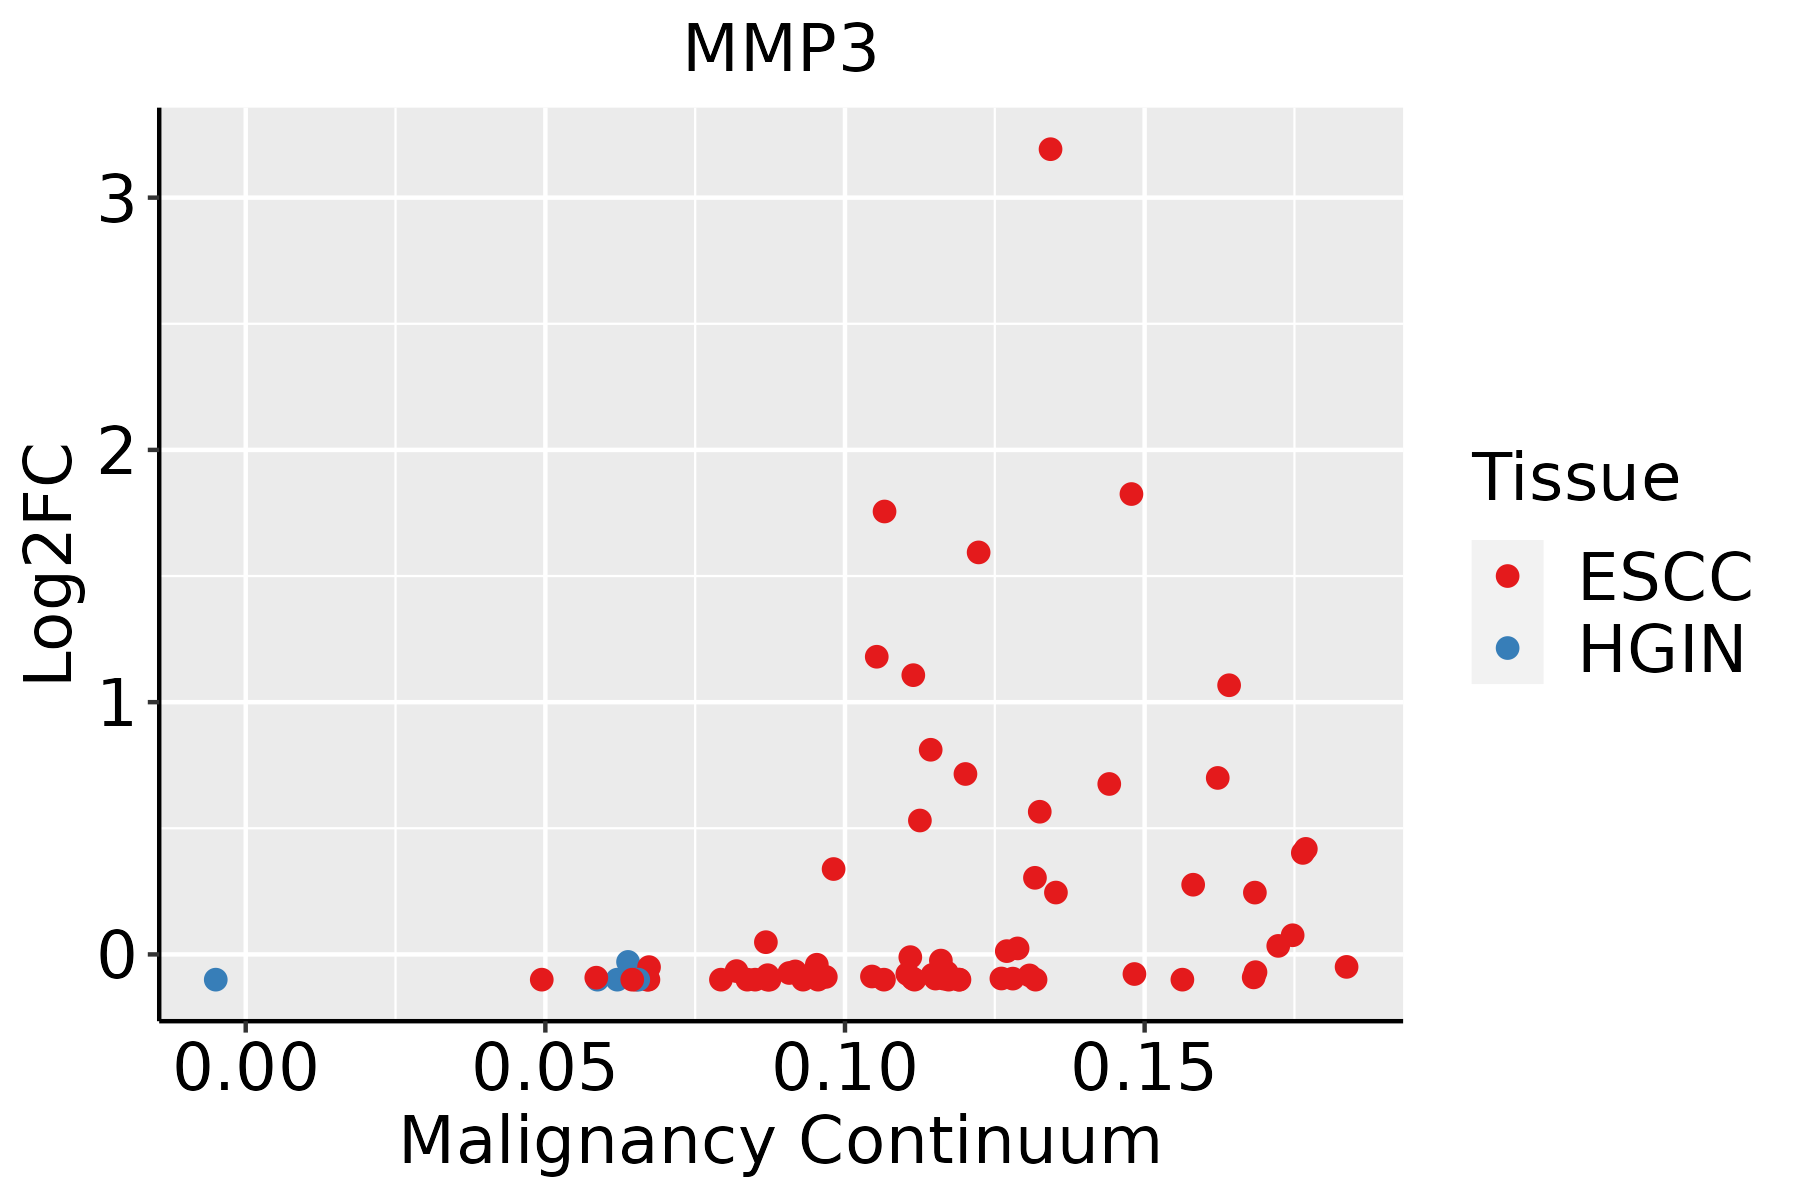 | ESCC: Esophageal squamous cell carcinoma |
| HGIN: High-grade intraepithelial neoplasias | ||
| LGIN: Low-grade intraepithelial neoplasias | ||
| Lung |  | AAH: Atypical adenomatous hyperplasia |
| AIS: Adenocarcinoma in situ | ||
| IAC: Invasive lung adenocarcinoma | ||
| MIA: Minimally invasive adenocarcinoma | ||
| Oral Cavity | 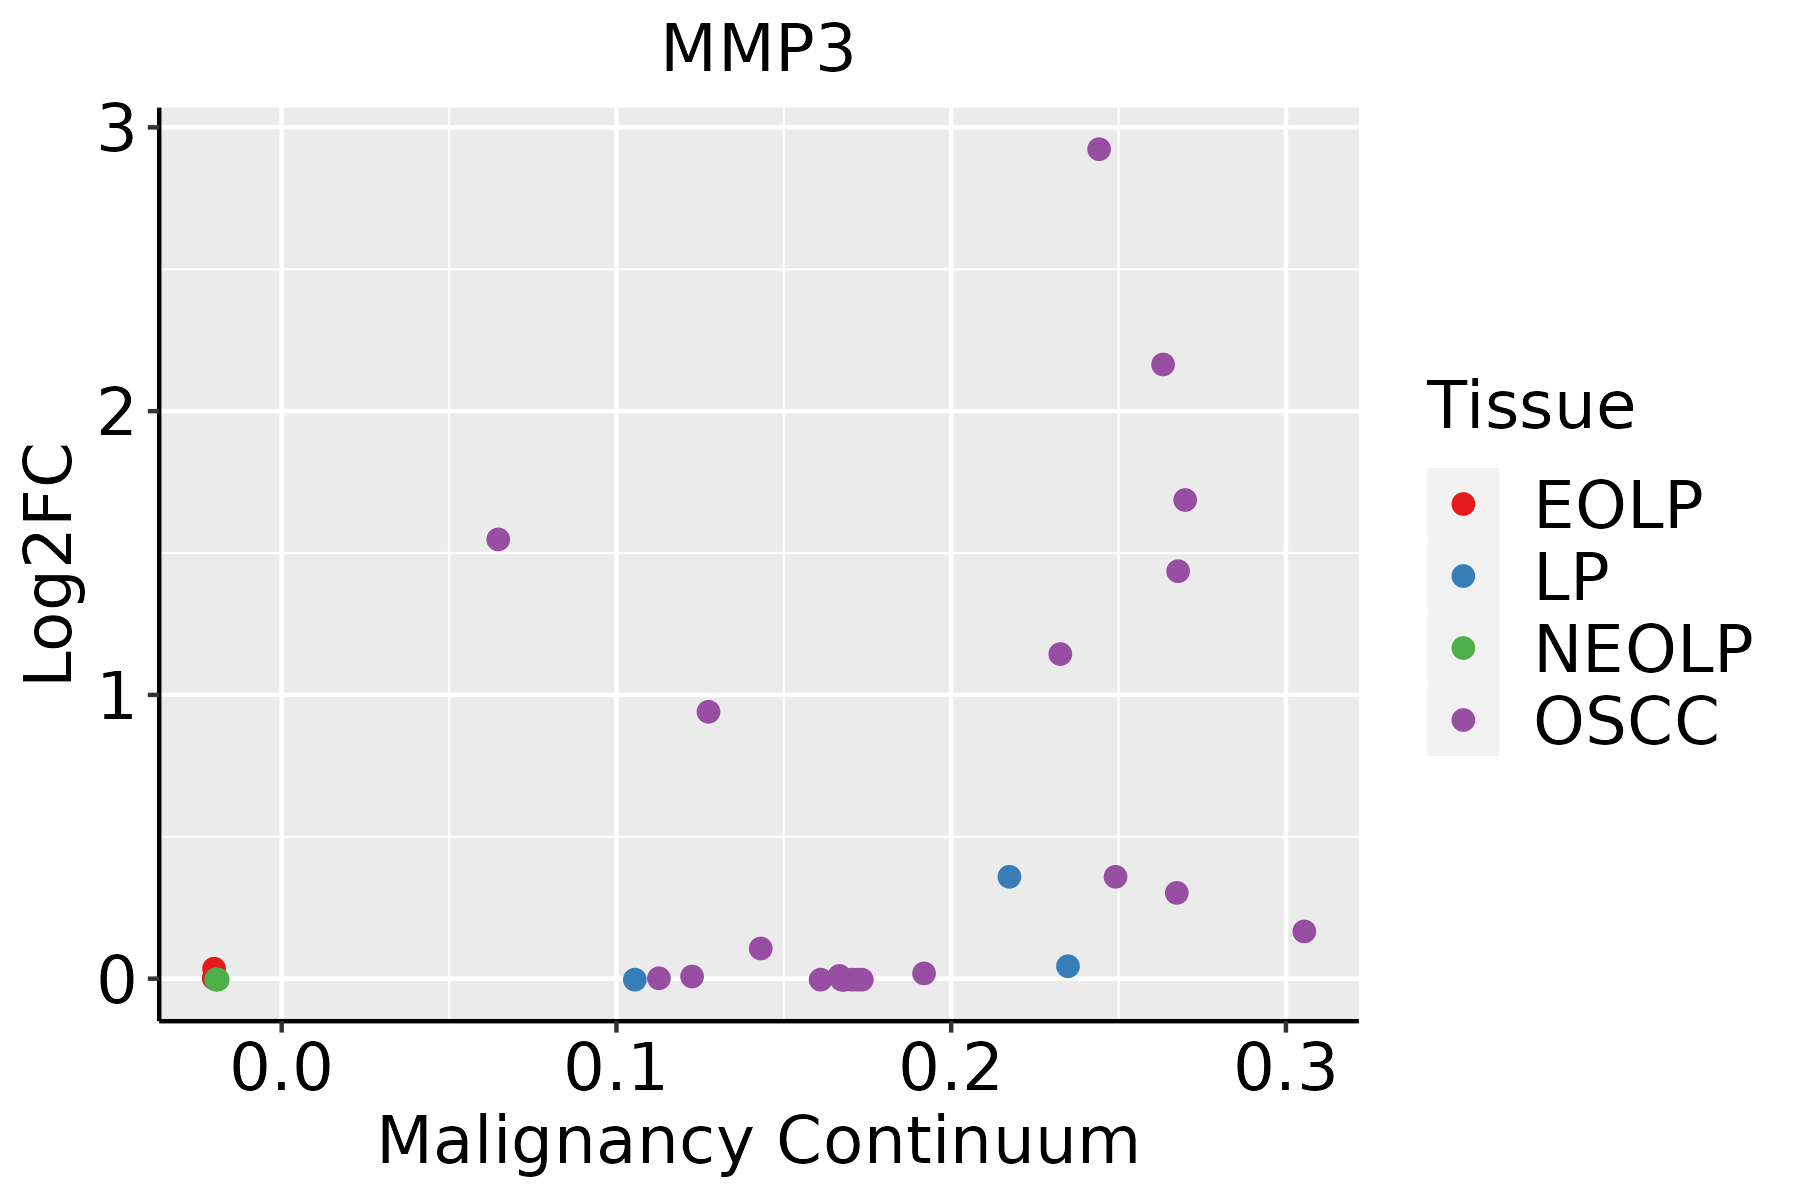 | EOLP: Erosive Oral lichen planus |
| LP: leukoplakia | ||
| NEOLP: Non-erosive oral lichen planus | ||
| OSCC: Oral squamous cell carcinoma | ||
| Skin | 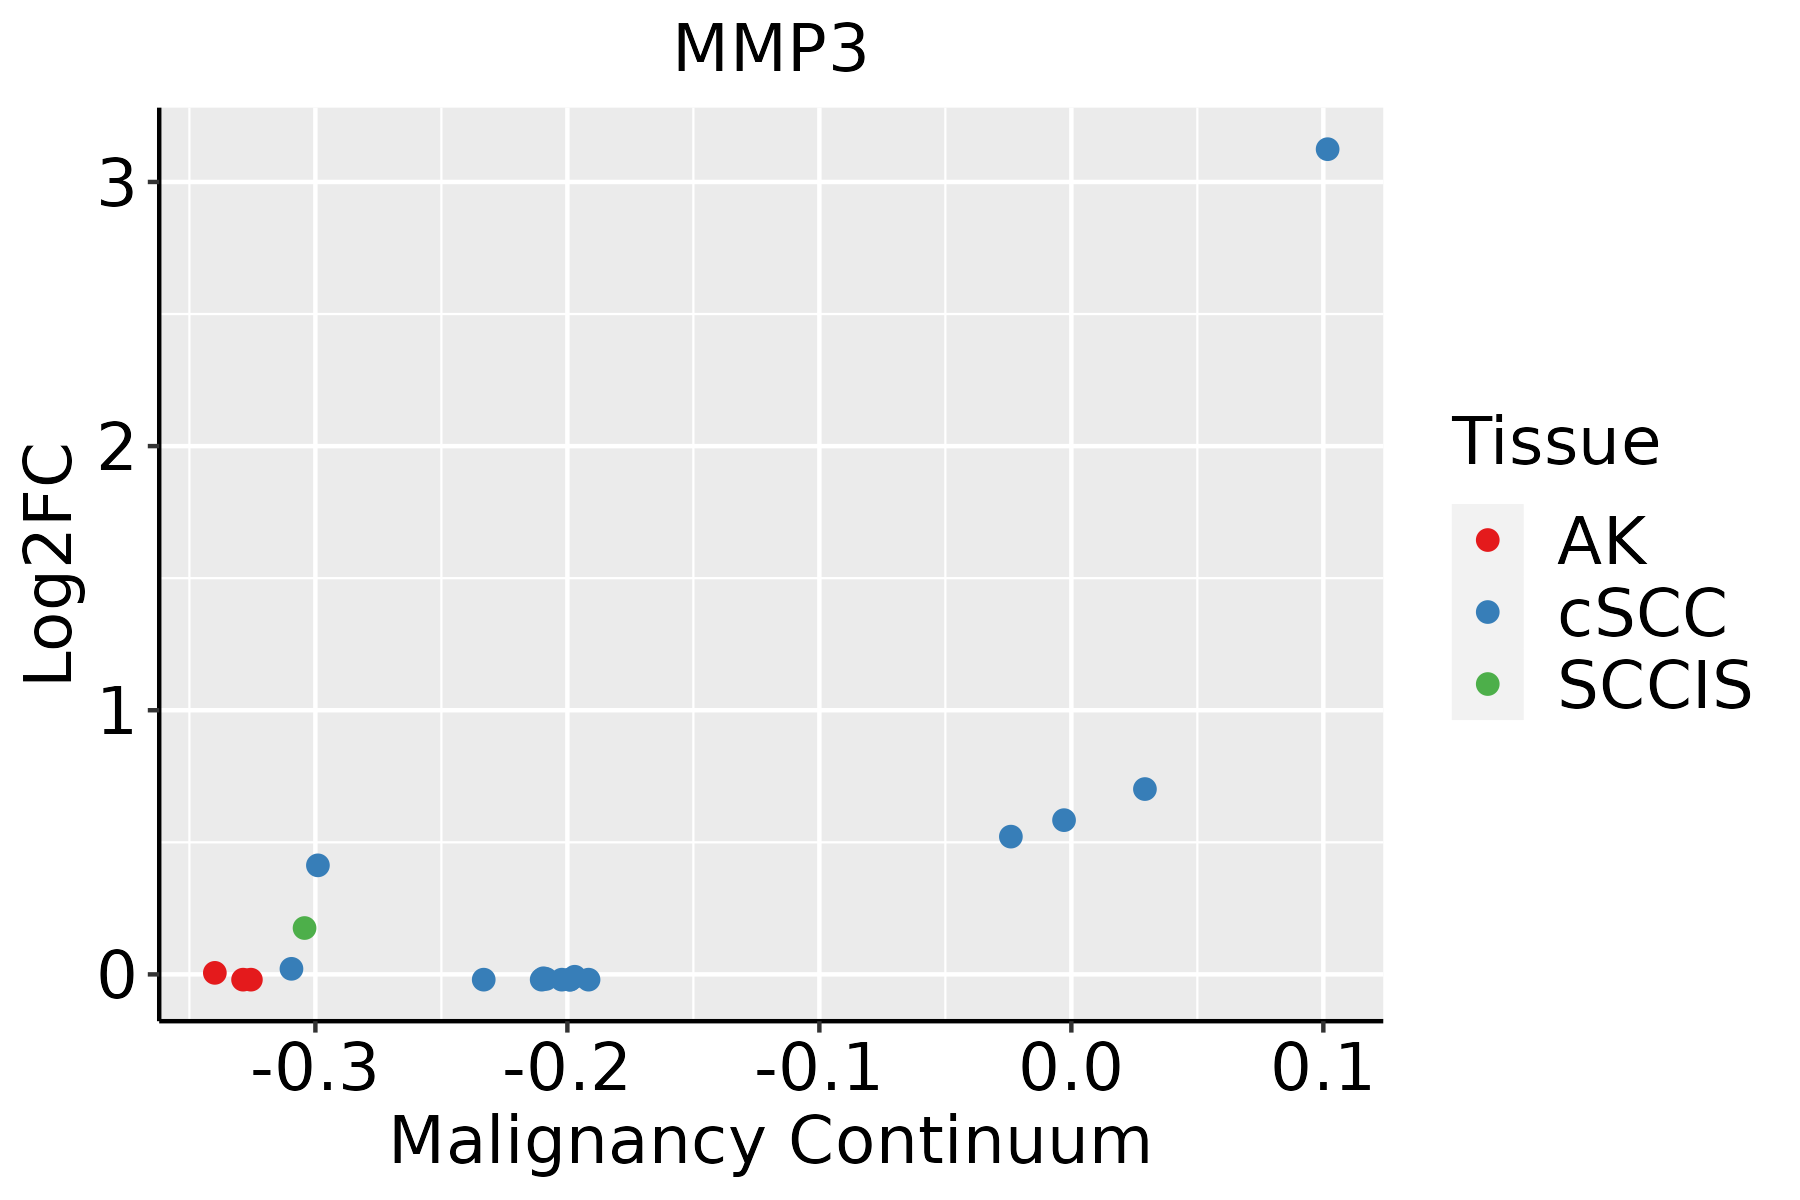 | AK: Actinic keratosis |
| cSCC: Cutaneous squamous cell carcinoma | ||
| SCCIS:squamous cell carcinoma in situ |
| ∗log2FC in expression of this searched gene in stem-like cells from each diseased tissue sample relative to stem-like cells in normal samples in each tissue plotted against the malignancy continuum. Samples are colored based on if they are from different disease stage. |
Top |
Malignant transformation related pathway analysis |
| Find out the enriched GO biological processes and KEGG pathways involved in transition from healthy to precancer to cancer |
| Tissue | Disease Stage | Enriched GO biological Processes |
| Colorectum | AD |  |
| Colorectum | SER |  |
| Colorectum | MSS |  |
| Colorectum | MSI-H |  |
| Colorectum | FAP |  |
| ∗Top 15 enriched GO BP terms are showed in the bar plot of each disease state in each tissue. Each row represents a significant GO biological process which is colored according to the -log10(p.adjust). |
| Page: 1 2 3 4 5 6 7 8 9 |
| GO ID | Tissue | Disease Stage | Description | Gene Ratio | Bg Ratio | pvalue | p.adjust | Count |
| GO:00069799 | Breast | Precancer | response to oxidative stress | 70/1080 | 446/18723 | 1.59e-14 | 4.26e-12 | 70 |
| GO:00621979 | Breast | Precancer | cellular response to chemical stress | 51/1080 | 337/18723 | 2.40e-10 | 2.34e-08 | 51 |
| GO:00345999 | Breast | Precancer | cellular response to oxidative stress | 42/1080 | 288/18723 | 2.78e-08 | 1.79e-06 | 42 |
| GO:00432549 | Breast | Precancer | regulation of protein-containing complex assembly | 50/1080 | 428/18723 | 1.63e-06 | 5.97e-05 | 50 |
| GO:00313349 | Breast | Precancer | positive regulation of protein-containing complex assembly | 33/1080 | 237/18723 | 2.39e-06 | 8.21e-05 | 33 |
| GO:19032019 | Breast | Precancer | regulation of oxidative stress-induced cell death | 16/1080 | 74/18723 | 3.80e-06 | 1.20e-04 | 16 |
| GO:0050727 | Breast | Precancer | regulation of inflammatory response | 44/1080 | 386/18723 | 1.26e-05 | 3.22e-04 | 44 |
| GO:00364739 | Breast | Precancer | cell death in response to oxidative stress | 17/1080 | 95/18723 | 2.74e-05 | 6.21e-04 | 17 |
| GO:19004079 | Breast | Precancer | regulation of cellular response to oxidative stress | 16/1080 | 89/18723 | 4.42e-05 | 9.42e-04 | 16 |
| GO:00725938 | Breast | Precancer | reactive oxygen species metabolic process | 30/1080 | 239/18723 | 5.13e-05 | 1.07e-03 | 30 |
| GO:00093148 | Breast | Precancer | response to radiation | 47/1080 | 456/18723 | 8.39e-05 | 1.62e-03 | 47 |
| GO:00712147 | Breast | Precancer | cellular response to abiotic stimulus | 37/1080 | 331/18723 | 9.12e-05 | 1.73e-03 | 37 |
| GO:01040047 | Breast | Precancer | cellular response to environmental stimulus | 37/1080 | 331/18723 | 9.12e-05 | 1.73e-03 | 37 |
| GO:19028829 | Breast | Precancer | regulation of response to oxidative stress | 16/1080 | 98/18723 | 1.46e-04 | 2.50e-03 | 16 |
| GO:00714785 | Breast | Precancer | cellular response to radiation | 24/1080 | 186/18723 | 1.83e-04 | 2.96e-03 | 24 |
| GO:00224119 | Breast | Precancer | cellular component disassembly | 44/1080 | 443/18723 | 3.17e-04 | 4.51e-03 | 44 |
| GO:00427437 | Breast | Precancer | hydrogen peroxide metabolic process | 11/1080 | 58/18723 | 4.17e-04 | 5.56e-03 | 11 |
| GO:00712418 | Breast | Precancer | cellular response to inorganic substance | 26/1080 | 226/18723 | 6.23e-04 | 7.78e-03 | 26 |
| GO:20003778 | Breast | Precancer | regulation of reactive oxygen species metabolic process | 20/1080 | 157/18723 | 7.19e-04 | 8.65e-03 | 20 |
| GO:19032091 | Breast | Precancer | positive regulation of oxidative stress-induced cell death | 5/1080 | 18/18723 | 2.88e-03 | 2.49e-02 | 5 |
| Page: 1 2 3 4 5 6 |
| Pathway ID | Tissue | Disease Stage | Description | Gene Ratio | Bg Ratio | pvalue | p.adjust | qvalue | Count |
| hsa0517118 | Breast | Precancer | Coronavirus disease - COVID-19 | 81/684 | 232/8465 | 3.74e-32 | 2.36e-30 | 1.81e-30 | 81 |
| hsa0541718 | Breast | Precancer | Lipid and atherosclerosis | 37/684 | 215/8465 | 7.64e-06 | 9.29e-05 | 7.12e-05 | 37 |
| hsa0465716 | Breast | Precancer | IL-17 signaling pathway | 20/684 | 94/8465 | 4.74e-05 | 4.54e-04 | 3.48e-04 | 20 |
| hsa0532312 | Breast | Precancer | Rheumatoid arthritis | 19/684 | 93/8465 | 1.30e-04 | 1.14e-03 | 8.73e-04 | 19 |
| hsa0517119 | Breast | Precancer | Coronavirus disease - COVID-19 | 81/684 | 232/8465 | 3.74e-32 | 2.36e-30 | 1.81e-30 | 81 |
| hsa0541719 | Breast | Precancer | Lipid and atherosclerosis | 37/684 | 215/8465 | 7.64e-06 | 9.29e-05 | 7.12e-05 | 37 |
| hsa0465717 | Breast | Precancer | IL-17 signaling pathway | 20/684 | 94/8465 | 4.74e-05 | 4.54e-04 | 3.48e-04 | 20 |
| hsa0532313 | Breast | Precancer | Rheumatoid arthritis | 19/684 | 93/8465 | 1.30e-04 | 1.14e-03 | 8.73e-04 | 19 |
| hsa0466810 | Esophagus | ESCC | TNF signaling pathway | 89/4205 | 114/8465 | 3.36e-10 | 4.01e-09 | 2.06e-09 | 89 |
| hsa05417211 | Esophagus | ESCC | Lipid and atherosclerosis | 143/4205 | 215/8465 | 3.30e-07 | 2.45e-06 | 1.26e-06 | 143 |
| hsa0521516 | Esophagus | ESCC | Prostate cancer | 72/4205 | 97/8465 | 6.12e-07 | 4.10e-06 | 2.10e-06 | 72 |
| hsa0465727 | Esophagus | ESCC | IL-17 signaling pathway | 66/4205 | 94/8465 | 3.93e-05 | 1.75e-04 | 8.99e-05 | 66 |
| hsa052028 | Esophagus | ESCC | Transcriptional misregulation in cancer | 116/4205 | 193/8465 | 2.08e-03 | 5.95e-03 | 3.05e-03 | 116 |
| hsa0466817 | Esophagus | ESCC | TNF signaling pathway | 89/4205 | 114/8465 | 3.36e-10 | 4.01e-09 | 2.06e-09 | 89 |
| hsa05417310 | Esophagus | ESCC | Lipid and atherosclerosis | 143/4205 | 215/8465 | 3.30e-07 | 2.45e-06 | 1.26e-06 | 143 |
| hsa0521517 | Esophagus | ESCC | Prostate cancer | 72/4205 | 97/8465 | 6.12e-07 | 4.10e-06 | 2.10e-06 | 72 |
| hsa0465734 | Esophagus | ESCC | IL-17 signaling pathway | 66/4205 | 94/8465 | 3.93e-05 | 1.75e-04 | 8.99e-05 | 66 |
| hsa0520213 | Esophagus | ESCC | Transcriptional misregulation in cancer | 116/4205 | 193/8465 | 2.08e-03 | 5.95e-03 | 3.05e-03 | 116 |
| hsa0517123 | Lung | AIS | Coronavirus disease - COVID-19 | 98/961 | 232/8465 | 2.82e-34 | 9.14e-32 | 5.85e-32 | 98 |
| hsa0541723 | Lung | AIS | Lipid and atherosclerosis | 46/961 | 215/8465 | 1.33e-05 | 3.32e-04 | 2.12e-04 | 46 |
| Page: 1 2 |
Top |
Cell-cell communication analysis |
| Identification of potential cell-cell interactions between two cell types and their ligand-receptor pairs for different disease states |
| Ligand | Receptor | LRpair | Pathway | Tissue | Disease Stage |
| Page: 1 |
Top |
Single-cell gene regulatory network inference analysis |
| Find out the significant the regulons (TFs) and the target genes of each regulon across cell types for different disease states |
| TF | Cell Type | Tissue | Disease Stage | Target Gene | RSS | Regulon Activity |
| ∗The dot plots of a searched regulon are shown for all cell subpopulations in each disease state of each tissue based on the regulon specific score inferred using pySCENIC and by calculating the average expression. |
| Page: 1 |
Top |
Somatic mutation of malignant transformation related genes |
| Annotation of somatic variants for genes involved in malignant transformation |
| Hugo Symbol | Variant Class | Variant Classification | dbSNP RS | HGVSc | HGVSp | HGVSp Short | SWISSPROT | BIOTYPE | SIFT | PolyPhen | Tumor Sample Barcode | Tissue | Histology | Sex | Age | Stage | Therapy Types | Drugs | Outcome |
| MMP3 | SNV | Missense_Mutation | c.604N>A | p.Gln202Lys | p.Q202K | P08254 | protein_coding | tolerated(0.93) | benign(0) | TCGA-A8-A097-01 | Breast | breast invasive carcinoma | Female | >=65 | I/II | Hormone Therapy | tamoxiphen | SD | |
| MMP3 | SNV | Missense_Mutation | c.1234N>C | p.Asp412His | p.D412H | P08254 | protein_coding | deleterious(0) | probably_damaging(1) | TCGA-A8-A09N-01 | Breast | breast invasive carcinoma | Female | <65 | III/IV | Unknown | Unknown | SD | |
| MMP3 | SNV | Missense_Mutation | novel | c.563N>T | p.Gly188Val | p.G188V | P08254 | protein_coding | deleterious(0) | probably_damaging(1) | TCGA-A8-A09Z-01 | Breast | breast invasive carcinoma | Female | >=65 | I/II | Unknown | Unknown | SD |
| MMP3 | SNV | Missense_Mutation | c.1191N>T | p.Lys397Asn | p.K397N | P08254 | protein_coding | tolerated(0.31) | benign(0.007) | TCGA-AN-A046-01 | Breast | breast invasive carcinoma | Female | >=65 | I/II | Unknown | Unknown | SD | |
| MMP3 | SNV | Missense_Mutation | novel | c.973G>C | p.Glu325Gln | p.E325Q | P08254 | protein_coding | tolerated(0.06) | benign(0.202) | TCGA-MA-AA3Z-01 | Cervix | cervical & endocervical cancer | Female | <65 | I/II | Unknown | Unknown | SD |
| MMP3 | SNV | Missense_Mutation | novel | c.1239N>C | p.Glu413Asp | p.E413D | P08254 | protein_coding | deleterious(0.04) | possibly_damaging(0.67) | TCGA-VS-A9U7-01 | Cervix | cervical & endocervical cancer | Female | <65 | I/II | Chemotherapy | cisplatin | CR |
| MMP3 | SNV | Missense_Mutation | c.1000C>T | p.Pro334Ser | p.P334S | P08254 | protein_coding | tolerated(0.06) | probably_damaging(0.923) | TCGA-AA-3947-01 | Colorectum | colon adenocarcinoma | Female | <65 | I/II | Unknown | Unknown | SD | |
| MMP3 | SNV | Missense_Mutation | novel | c.1389G>T | p.Lys463Asn | p.K463N | P08254 | protein_coding | deleterious(0.04) | benign(0.146) | TCGA-AA-A00N-01 | Colorectum | colon adenocarcinoma | Male | >=65 | I/II | Unknown | Unknown | PD |
| MMP3 | SNV | Missense_Mutation | novel | c.274N>C | p.Cys92Arg | p.C92R | P08254 | protein_coding | deleterious(0) | probably_damaging(1) | TCGA-AD-6964-01 | Colorectum | colon adenocarcinoma | Male | <65 | III/IV | Chemotherapy | folfox | PD |
| MMP3 | SNV | Missense_Mutation | c.984G>T | p.Leu328Phe | p.L328F | P08254 | protein_coding | tolerated(0.77) | benign(0.017) | TCGA-AZ-4315-01 | Colorectum | colon adenocarcinoma | Male | <65 | I/II | Unknown | Unknown | SD |
| Page: 1 2 3 4 5 6 7 |
Top |
Related drugs of malignant transformation related genes |
| Identification of chemicals and drugs interact with genes involved in malignant transfromation |
| (DGIdb 4.0) |
| Entrez ID | Symbol | Category | Interaction Types | Drug Claim Name | Drug Name | PMIDs |
| 4314 | MMP3 | DRUGGABLE GENOME, NEUTRAL ZINC METALLOPEPTIDASE, PROTEASE, ENZYME | BERKELEYACETAL A | BERKELEYACETAL A | 17970594 | |
| 4314 | MMP3 | DRUGGABLE GENOME, NEUTRAL ZINC METALLOPEPTIDASE, PROTEASE, ENZYME | lisinopril | LISINOPRIL | ||
| 4314 | MMP3 | DRUGGABLE GENOME, NEUTRAL ZINC METALLOPEPTIDASE, PROTEASE, ENZYME | vaccine | PRINOMASTAT | PRINOMASTAT | |
| 4314 | MMP3 | DRUGGABLE GENOME, NEUTRAL ZINC METALLOPEPTIDASE, PROTEASE, ENZYME | inhibitor | 252827503 | CGS-27023A | |
| 4314 | MMP3 | DRUGGABLE GENOME, NEUTRAL ZINC METALLOPEPTIDASE, PROTEASE, ENZYME | GM6001 | |||
| 4314 | MMP3 | DRUGGABLE GENOME, NEUTRAL ZINC METALLOPEPTIDASE, PROTEASE, ENZYME | pravastatin | PRAVASTATIN | 10190398 | |
| 4314 | MMP3 | DRUGGABLE GENOME, NEUTRAL ZINC METALLOPEPTIDASE, PROTEASE, ENZYME | PMID29130358-Compound-Figure10(2a) | |||
| 4314 | MMP3 | DRUGGABLE GENOME, NEUTRAL ZINC METALLOPEPTIDASE, PROTEASE, ENZYME | MARIMASTAT | MARIMASTAT | ||
| 4314 | MMP3 | DRUGGABLE GENOME, NEUTRAL ZINC METALLOPEPTIDASE, PROTEASE, ENZYME | BERKELEYACETAL B | BERKELEYACETAL B | 17970594 | |
| 4314 | MMP3 | DRUGGABLE GENOME, NEUTRAL ZINC METALLOPEPTIDASE, PROTEASE, ENZYME | BERKELEYAMIDE C | BERKELEYAMIDE C | 18330993 |
| Page: 1 2 |

Copyright 2023-Present -The University of Texas Health Science Center at Houston |