
|
|||||
|
 | |
| |
| |
| |
| |
| |
|
Gene: MMP28 |
Gene summary for MMP28 |
| Gene information | Species | Human | Gene symbol | MMP28 | Gene ID | 79148 |
| Gene name | matrix metallopeptidase 28 | |
| Gene Alias | EPILYSIN | |
| Cytomap | 17q12 | |
| Gene Type | protein-coding | GO ID | GO:0002376 | UniProtAcc | B3KV06 |
Top |
Malignant transformation analysis |
| Identification of the aberrant gene expression in precancerous and cancerous lesions by comparing the gene expression of stem-like cells in diseased tissues with normal stem cells |
| Entrez ID | Symbol | Replicates | Species | Organ | Tissue | Adj P-value | Log2FC | Malignancy |
| 79148 | MMP28 | CCI_3 | Human | Cervix | CC | 7.64e-15 | 8.66e-01 | 0.516 |
| 79148 | MMP28 | Tumor | Human | Cervix | CC | 1.37e-11 | 3.17e-01 | 0.1241 |
| 79148 | MMP28 | sample3 | Human | Cervix | CC | 1.25e-44 | 6.84e-01 | 0.1387 |
| 79148 | MMP28 | T3 | Human | Cervix | CC | 1.16e-39 | 6.85e-01 | 0.1389 |
| 79148 | MMP28 | P5T-E | Human | Esophagus | ESCC | 1.22e-10 | 2.57e-01 | 0.1327 |
| 79148 | MMP28 | P8T-E | Human | Esophagus | ESCC | 3.09e-02 | 8.94e-02 | 0.0889 |
| 79148 | MMP28 | P11T-E | Human | Esophagus | ESCC | 2.15e-25 | 1.71e+00 | 0.1426 |
| 79148 | MMP28 | P17T-E | Human | Esophagus | ESCC | 1.22e-12 | 7.75e-01 | 0.1278 |
| 79148 | MMP28 | P19T-E | Human | Esophagus | ESCC | 3.18e-05 | 8.09e-01 | 0.1662 |
| 79148 | MMP28 | P20T-E | Human | Esophagus | ESCC | 6.23e-15 | 6.19e-01 | 0.1124 |
| 79148 | MMP28 | P21T-E | Human | Esophagus | ESCC | 1.22e-10 | 3.14e-01 | 0.1617 |
| 79148 | MMP28 | P24T-E | Human | Esophagus | ESCC | 7.08e-39 | 9.17e-01 | 0.1287 |
| 79148 | MMP28 | P32T-E | Human | Esophagus | ESCC | 2.75e-41 | 9.77e-01 | 0.1666 |
| 79148 | MMP28 | P36T-E | Human | Esophagus | ESCC | 2.59e-05 | 7.29e-01 | 0.1187 |
| 79148 | MMP28 | P37T-E | Human | Esophagus | ESCC | 3.94e-34 | 1.15e+00 | 0.1371 |
| 79148 | MMP28 | P42T-E | Human | Esophagus | ESCC | 2.48e-04 | 4.09e-01 | 0.1175 |
| 79148 | MMP28 | P44T-E | Human | Esophagus | ESCC | 3.36e-08 | 4.74e-01 | 0.1096 |
| 79148 | MMP28 | P52T-E | Human | Esophagus | ESCC | 5.81e-36 | 1.20e+00 | 0.1555 |
| 79148 | MMP28 | P62T-E | Human | Esophagus | ESCC | 5.54e-77 | 2.03e+00 | 0.1302 |
| 79148 | MMP28 | P75T-E | Human | Esophagus | ESCC | 5.71e-24 | 6.53e-01 | 0.1125 |
| Page: 1 2 3 |
| Tissue | Expression Dynamics | Abbreviation |
| Cervix |  | CC: Cervix cancer |
| HSIL_HPV: HPV-infected high-grade squamous intraepithelial lesions | ||
| N_HPV: HPV-infected normal cervix | ||
| Esophagus | 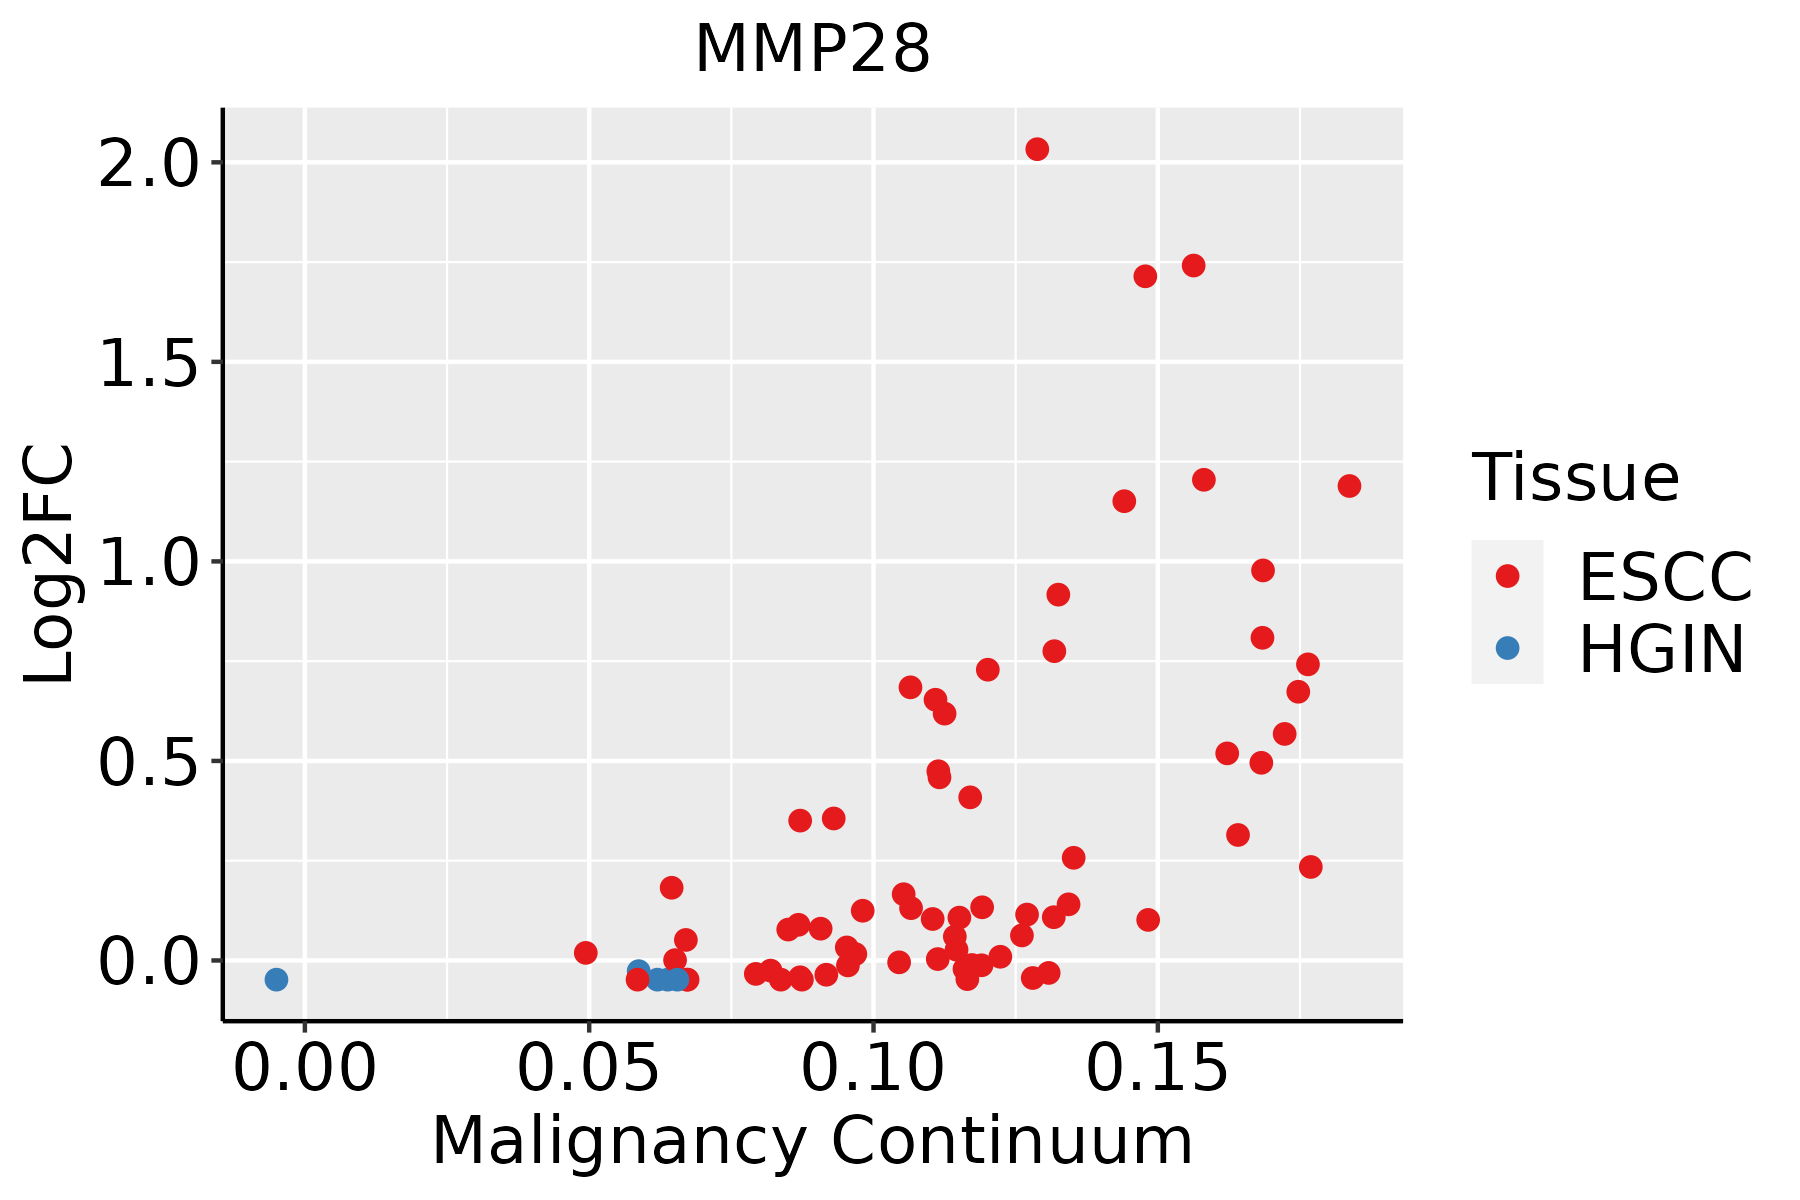 | ESCC: Esophageal squamous cell carcinoma |
| HGIN: High-grade intraepithelial neoplasias | ||
| LGIN: Low-grade intraepithelial neoplasias | ||
| Oral Cavity | 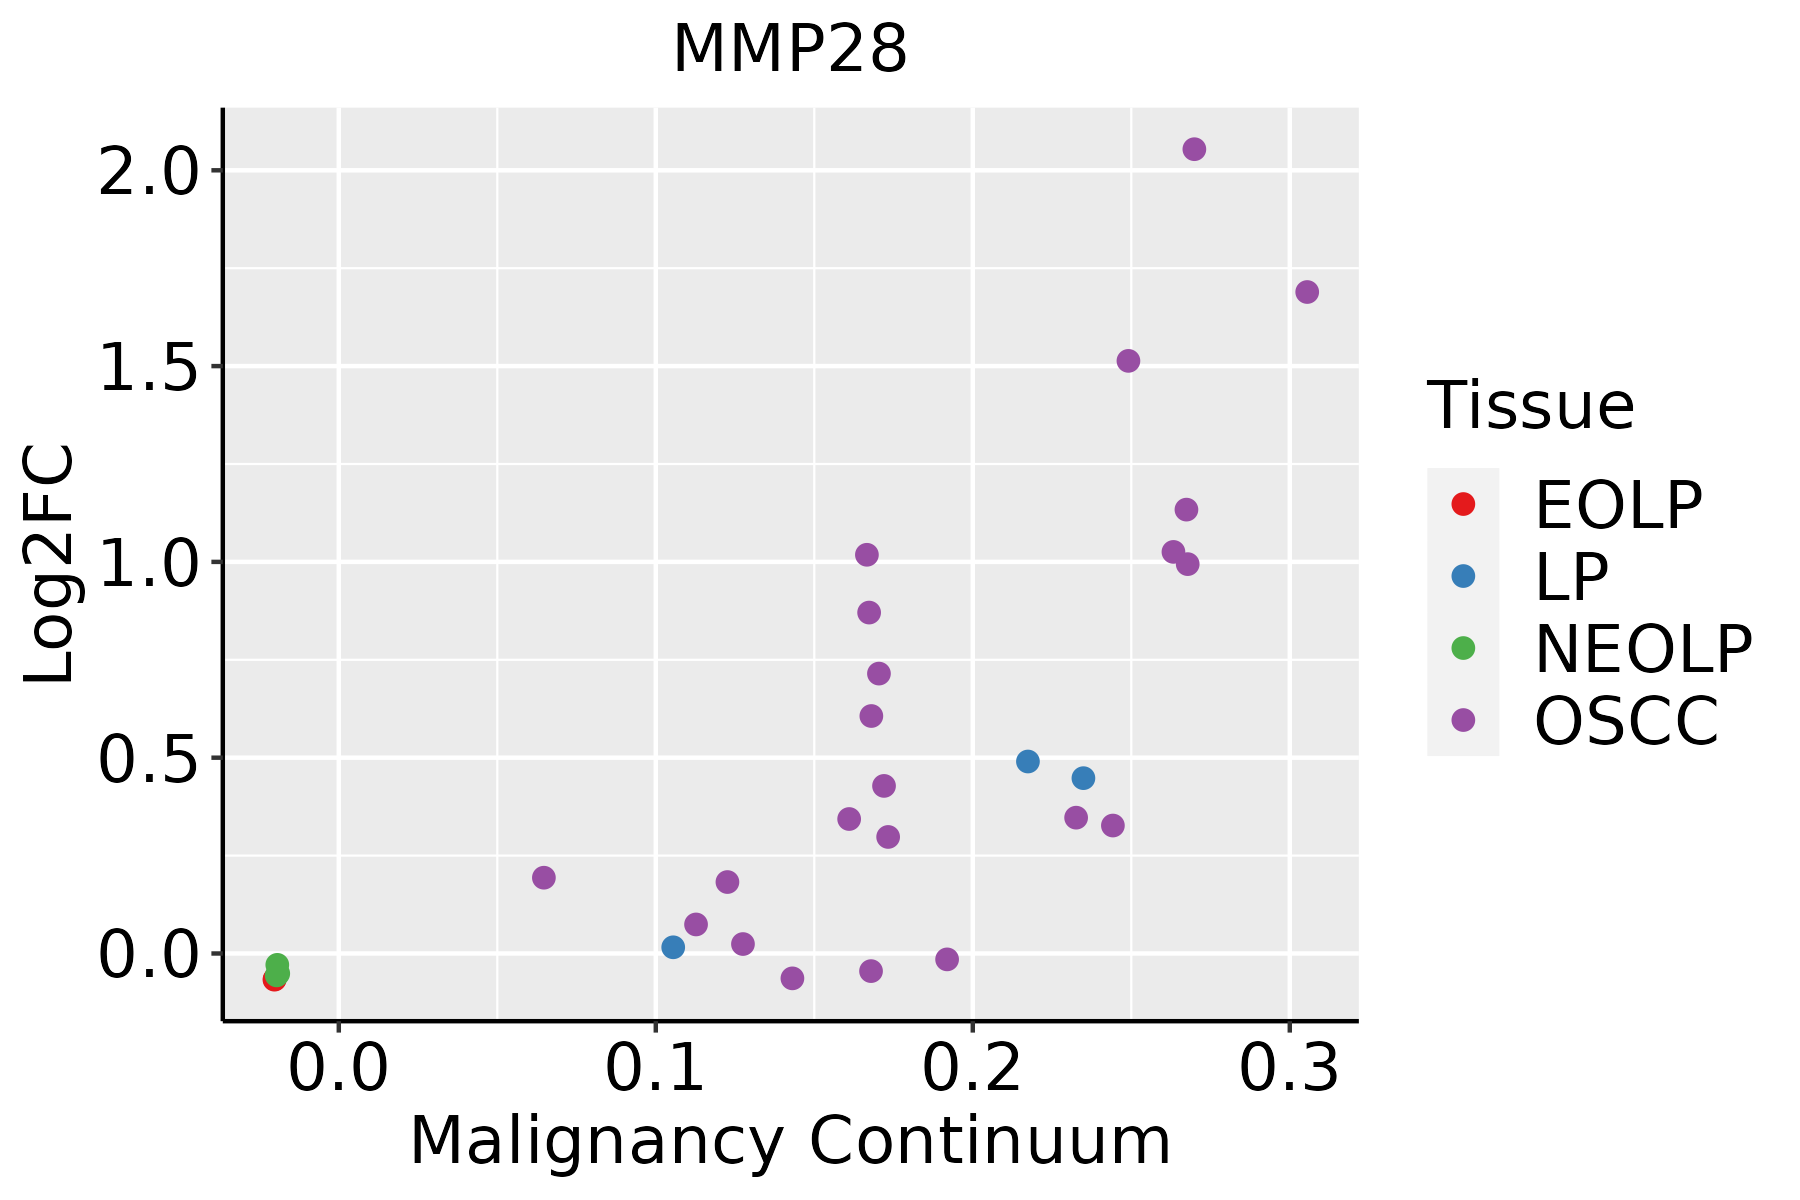 | EOLP: Erosive Oral lichen planus |
| LP: leukoplakia | ||
| NEOLP: Non-erosive oral lichen planus | ||
| OSCC: Oral squamous cell carcinoma | ||
| Skin |  | AK: Actinic keratosis |
| cSCC: Cutaneous squamous cell carcinoma | ||
| SCCIS:squamous cell carcinoma in situ |
| ∗log2FC in expression of this searched gene in stem-like cells from each diseased tissue sample relative to stem-like cells in normal samples in each tissue plotted against the malignancy continuum. Samples are colored based on if they are from different disease stage. |
Top |
Malignant transformation related pathway analysis |
| Find out the enriched GO biological processes and KEGG pathways involved in transition from healthy to precancer to cancer |
| Tissue | Disease Stage | Enriched GO biological Processes |
| Colorectum | AD |  |
| Colorectum | SER |  |
| Colorectum | MSS |  |
| Colorectum | MSI-H |  |
| Colorectum | FAP |  |
| ∗Top 15 enriched GO BP terms are showed in the bar plot of each disease state in each tissue. Each row represents a significant GO biological process which is colored according to the -log10(p.adjust). |
| Page: 1 2 3 4 5 6 7 8 9 |
| GO ID | Tissue | Disease Stage | Description | Gene Ratio | Bg Ratio | pvalue | p.adjust | Count |
| GO:00026837 | Cervix | CC | negative regulation of immune system process | 94/2311 | 434/18723 | 2.63e-08 | 1.87e-06 | 94 |
| GO:00603267 | Cervix | CC | cell chemotaxis | 73/2311 | 310/18723 | 2.82e-08 | 1.96e-06 | 73 |
| GO:00975298 | Cervix | CC | myeloid leukocyte migration | 56/2311 | 220/18723 | 7.21e-08 | 4.15e-06 | 56 |
| GO:00305957 | Cervix | CC | leukocyte chemotaxis | 57/2311 | 230/18723 | 1.48e-07 | 7.07e-06 | 57 |
| GO:00509007 | Cervix | CC | leukocyte migration | 78/2311 | 369/18723 | 1.09e-06 | 3.80e-05 | 78 |
| GO:00026857 | Cervix | CC | regulation of leukocyte migration | 50/2311 | 210/18723 | 2.95e-06 | 8.31e-05 | 50 |
| GO:00026888 | Cervix | CC | regulation of leukocyte chemotaxis | 34/2311 | 122/18723 | 3.00e-06 | 8.38e-05 | 34 |
| GO:00509203 | Cervix | CC | regulation of chemotaxis | 51/2311 | 223/18723 | 8.03e-06 | 1.86e-04 | 51 |
| GO:00512713 | Cervix | CC | negative regulation of cellular component movement | 73/2311 | 367/18723 | 2.22e-05 | 3.95e-04 | 73 |
| GO:00400133 | Cervix | CC | negative regulation of locomotion | 76/2311 | 391/18723 | 3.47e-05 | 5.60e-04 | 76 |
| GO:20001463 | Cervix | CC | negative regulation of cell motility | 71/2311 | 359/18723 | 3.47e-05 | 5.60e-04 | 71 |
| GO:00303363 | Cervix | CC | negative regulation of cell migration | 68/2311 | 344/18723 | 5.11e-05 | 7.70e-04 | 68 |
| GO:00482464 | Cervix | CC | macrophage chemotaxis | 14/2311 | 38/18723 | 9.80e-05 | 1.27e-03 | 14 |
| GO:00321022 | Cervix | CC | negative regulation of response to external stimulus | 75/2311 | 420/18723 | 5.96e-04 | 5.61e-03 | 75 |
| GO:19055174 | Cervix | CC | macrophage migration | 16/2311 | 55/18723 | 7.23e-04 | 6.51e-03 | 16 |
| GO:0030198 | Cervix | CC | extracellular matrix organization | 52/2311 | 301/18723 | 7.43e-03 | 3.98e-02 | 52 |
| GO:0043062 | Cervix | CC | extracellular structure organization | 52/2311 | 302/18723 | 7.92e-03 | 4.17e-02 | 52 |
| GO:0045229 | Cervix | CC | external encapsulating structure organization | 52/2311 | 304/18723 | 9.00e-03 | 4.57e-02 | 52 |
| GO:19055212 | Cervix | CC | regulation of macrophage migration | 11/2311 | 41/18723 | 9.17e-03 | 4.62e-02 | 11 |
| GO:00301984 | Esophagus | ESCC | extracellular matrix organization | 171/8552 | 301/18723 | 6.08e-05 | 4.67e-04 | 171 |
| Page: 1 2 |
| Pathway ID | Tissue | Disease Stage | Description | Gene Ratio | Bg Ratio | pvalue | p.adjust | qvalue | Count |
| Page: 1 |
Top |
Cell-cell communication analysis |
| Identification of potential cell-cell interactions between two cell types and their ligand-receptor pairs for different disease states |
| Ligand | Receptor | LRpair | Pathway | Tissue | Disease Stage |
| Page: 1 |
Top |
Single-cell gene regulatory network inference analysis |
| Find out the significant the regulons (TFs) and the target genes of each regulon across cell types for different disease states |
| TF | Cell Type | Tissue | Disease Stage | Target Gene | RSS | Regulon Activity |
| ∗The dot plots of a searched regulon are shown for all cell subpopulations in each disease state of each tissue based on the regulon specific score inferred using pySCENIC and by calculating the average expression. |
| Page: 1 |
Top |
Somatic mutation of malignant transformation related genes |
| Annotation of somatic variants for genes involved in malignant transformation |
| Hugo Symbol | Variant Class | Variant Classification | dbSNP RS | HGVSc | HGVSp | HGVSp Short | SWISSPROT | BIOTYPE | SIFT | PolyPhen | Tumor Sample Barcode | Tissue | Histology | Sex | Age | Stage | Therapy Types | Drugs | Outcome |
| MMP28 | SNV | Missense_Mutation | novel | c.306N>T | p.Trp102Cys | p.W102C | Q9H239 | protein_coding | deleterious(0.01) | possibly_damaging(0.514) | TCGA-A2-A25D-01 | Breast | breast invasive carcinoma | Female | >=65 | III/IV | Hormone Therapy | tamoxiphen | SD |
| MMP28 | SNV | Missense_Mutation | rs781178488 | c.1328N>A | p.Arg443Gln | p.R443Q | Q9H239 | protein_coding | tolerated(0.25) | benign(0) | TCGA-AC-A5XS-01 | Breast | breast invasive carcinoma | Female | >=65 | I/II | Hormone Therapy | femara | SD |
| MMP28 | SNV | Missense_Mutation | rs573447178 | c.312G>C | p.Glu104Asp | p.E104D | Q9H239 | protein_coding | tolerated(0.16) | benign(0.003) | TCGA-BH-A0HP-01 | Breast | breast invasive carcinoma | Female | >=65 | III/IV | Chemotherapy | doxorubicin | SD |
| MMP28 | SNV | Missense_Mutation | rs373463098 | c.238N>T | p.Arg80Cys | p.R80C | Q9H239 | protein_coding | tolerated(0.05) | possibly_damaging(0.553) | TCGA-2W-A8YY-01 | Cervix | cervical & endocervical cancer | Female | <65 | I/II | Chemotherapy | cisplatin | CR |
| MMP28 | SNV | Missense_Mutation | rs781178488 | c.1328N>A | p.Arg443Gln | p.R443Q | Q9H239 | protein_coding | tolerated(0.25) | benign(0) | TCGA-HM-A4S6-01 | Cervix | cervical & endocervical cancer | Female | <65 | III/IV | Chemotherapy | cisplatin | CR |
| MMP28 | SNV | Missense_Mutation | novel | c.1414N>G | p.Arg472Gly | p.R472G | Q9H239 | protein_coding | tolerated(0.16) | benign(0.001) | TCGA-VS-A8QF-01 | Cervix | cervical & endocervical cancer | Female | <65 | I/II | Chemotherapy | cisplatin | CR |
| MMP28 | SNV | Missense_Mutation | rs371940194 | c.1261G>A | p.Ala421Thr | p.A421T | Q9H239 | protein_coding | deleterious(0) | probably_damaging(0.98) | TCGA-CK-4951-01 | Colorectum | colon adenocarcinoma | Female | >=65 | I/II | Unknown | Unknown | PD |
| MMP28 | SNV | Missense_Mutation | rs762938904 | c.1537G>A | p.Ala513Thr | p.A513T | Q9H239 | protein_coding | tolerated(0.09) | benign(0.356) | TCGA-CK-5916-01 | Colorectum | colon adenocarcinoma | Female | >=65 | I/II | Unknown | Unknown | PD |
| MMP28 | SNV | Missense_Mutation | novel | c.1142N>C | p.Asn381Thr | p.N381T | Q9H239 | protein_coding | tolerated(0.65) | benign(0.048) | TCGA-CM-4743-01 | Colorectum | colon adenocarcinoma | Male | >=65 | I/II | Chemotherapy | capecitabine | SD |
| MMP28 | SNV | Missense_Mutation | novel | c.1247G>A | p.Arg416His | p.R416H | Q9H239 | protein_coding | deleterious(0.03) | benign(0.142) | TCGA-CM-4746-01 | Colorectum | colon adenocarcinoma | Male | <65 | I/II | Unknown | Unknown | SD |
| Page: 1 2 3 4 5 6 7 |
Top |
Related drugs of malignant transformation related genes |
| Identification of chemicals and drugs interact with genes involved in malignant transfromation |
| (DGIdb 4.0) |
| Entrez ID | Symbol | Category | Interaction Types | Drug Claim Name | Drug Name | PMIDs |
| Page: 1 |

Copyright 2023-Present -The University of Texas Health Science Center at Houston |